
Molecular insight into nanoscale water films dewetting on modified silica surfaces
Jun
Zhang
*ab,
Wen
Li
ab,
Youguo
Yan
ab,
Yefei
Wang
*c,
Bing
Liu
ab,
Yue
Shen
ab,
Haixiang
Chen
ab and
Liang
Liu
ab
aCollege of Science, China University of Petroleum, 266580 Qingdao, Shandong, People's Republic of China. E-mail: zhangjun.upc@gmail.com
bKey Laboratory of New Energy Physics & Materials Science in Universities of Shandong, China University of Petroleum, 266580 Qingdao, Shandong, People's Republic of China
cSchool of Petroleum Engineering, China University of Petroleum, 266580 Qingdao, Shandong, People's Republic of China. E-mail: Wangyf@upc.edu.cn
First published on 5th November 2014
Abstract
In this work, molecular dynamics simulations are adopted to investigate the microscopic dewetting mechanism of nanoscale water films on methylated silica surfaces. The simulation results show that the dewetting process is divided into two stages: the appearance of dry patches and the quick contraction of the water film. First, the appearance of dry patches is due to the fluctuation in the film thickness originating from capillary wave instability. Second, for the fast contraction of water film, the unsaturated electrostatic and hydrogen bond interactions among water molecules are the driving forces, which induce the quick contraction of the water film. Finally, the effect of film thickness on water films dewetting is studied. Research results suggest that upon increasing the water film thickness from 6 to 8 Å, the final dewetting patterns experience separate droplets and striation-shaped structures, respectively. But upon further increasing the water film thickness, the water film is stable and there are no dry patches. The microscopic dewetting behaviors of water films on methylated silica surfaces discussed here are helpful in understanding many phenomena in scientific and industrial processes better.
1. Introduction
The adsorbed water on a solid surface determines many interfacial physical and chemical processes,1–5 such as chemical reactivity, corrosion and molecular transport of co-adsorbed components. And the adsorption behavior of the adsorbed water is determined by the wettability of the solid surface and generally probed by the contact angle, θwa, which is related to interfacial tension based on Young's equation6σsa = σsw + σwa![[thin space (1/6-em)]](https://www.rsc.org/images/entities/char_2009.gif) cosθwa cosθwa | (1) |
Herein, σ is the interfacial tension, and the subscripts w, a, and s denote water, air, and solid, respectively. According to Young's equation, we can observe that the water–air contact angle is determined by the three-phase interactions, which are solid–water, solid–air, and water–air interactions. Generally, a solid surface is hydrophilic for water–air contact angles from 0° to 65°, intermediate wet from 65° to 105°, and hydrophobic from 105° to 180°, respectively.7
Up to now, a great number of scientific research studies have been performed to investigate the adsorption behaviors of water on solid surfaces with various wettability.8–12 Among these investigations, the intermediate wet, hydrophobic or even super-hydrophobic surfaces have aroused great research enthusiasm due to their special properties of antifog, self-clean and so on. During the antifogging or self-cleaning process, the adsorbed water would aggregate and form discrete droplets via dewetting. Furthermore, by means of dewetting, some amazing dewetting patterns with defined spatial correlations could be formed, and the dewetting patterns could also be regulated through pre-patterned surfaces with heterogeneous wettability,13,14 electric-field controlled dewetting,15 and probe-assisted dewetting.16 These patterned structures are often serviceable in many research fields, such as lithograph, magnetic recording, biosensors, etc.17,18
Therefore, many efforts have been devoted to investigating film dewetting mechanisms and developing multiple methods to control dewetting patterns.19–22 In a number of research studies, two well-known mechanisms were provided to explain the dewetting mechanisms of thin fluid films:23 spinodal dewetting on a homogeneous nonwettable substrate; heterogeneous dewetting or “nucleation” produced by the microscale wettability contrasts on a heterogeneous substrate. Xie et al. investigated the dewetting of polystyrene films on a silicon substrate.24 They observed nucleation of dry patches in the early stage of dewetting for relatively thick films (h > 100 Å), but the break up of thinner films (h < 100 Å) occurred through the growth of uniformly distributed surface undulations (“spinodal dewetting”). This indicates that film thickness has a profound influence on the film dewetting process. Although there have been numerous research reports on film dewetting, as far as we know, they mainly focus on the dewetting of relatively thick films (hundreds of angstroms) like polymer film. The dewetting of a nanoscale water film has not been investigated in detail previously, because it is extremely hard to detect the microcosmic dewetting process of such a thin film experimentally.
Molecular dynamics (MD) simulations have been developed to investigate the microscopic interactions, which can provide detailed information about dynamical, energetic and structural properties of complex systems at the molecular level.25–29 For example, Yang et al. investigated the critical rupturing thickness of water films in the air.28 Their simulation results were approximate to the theoretical and experimental results. Luo et al. studied the dewetting dynamics of nanofilled polymer thin film on a substrate.29 Their research approved that the addition of nanofillers could retard the dewetting of polymer film significantly. These research studies have proved that MD simulations are an efficient method to investigate the dewetting of thin fluid film on a solid surface.
In this paper, MD simulations are adopted to study the dynamic dewetting mechanism of water films on methylated silica surfaces. First, the adsorption behavior and structural transition of water film on the methylated silica surface are investigated. Second, the interactions of water–solid and water–water are analyzed to rationalize the driving forces controlling the water film dewetting and illustrate the dewetting mechanism. Finally, the influence of water film thickness on the water film dewetting is also investigated. The microscopic dewetting behaviors of water films on the methylated silica surfaces discussed here are helpful in understanding many interfacial phenomena and scientific processes better.
2. Computational details
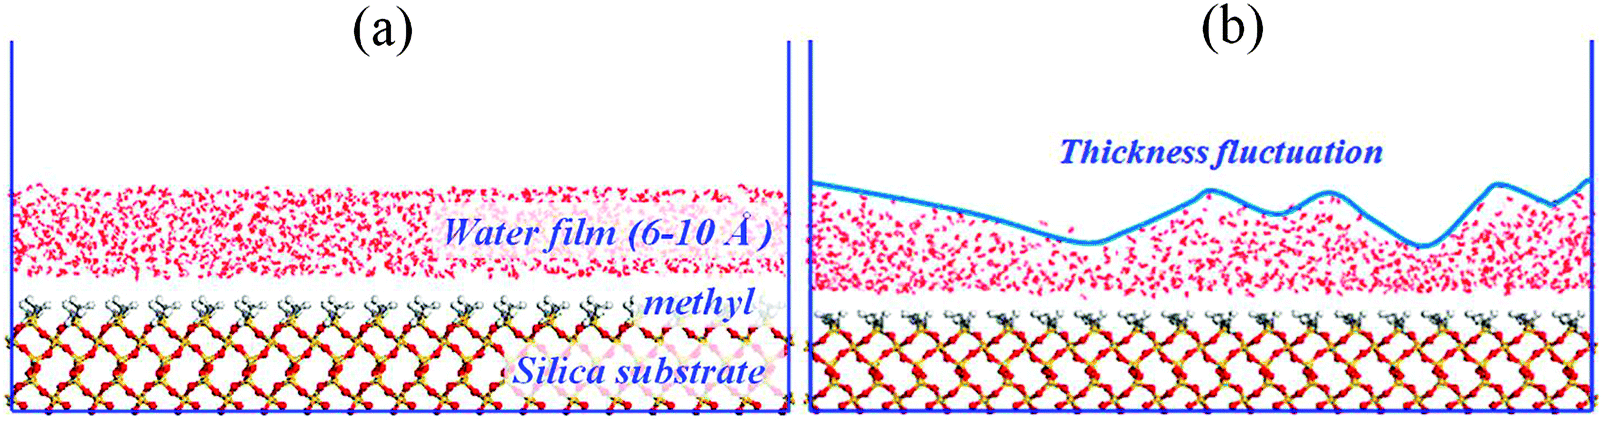
MD simulations are performed using Discover and Amorphous Cell modules in Materials Studio of Accelrys Inc. The constructed model is composed of an aqueous layer and a silica surface.Silica surface: the initial silica (quartz) lattice is taken from the structural database of Material Studio. A repeat unit of silica with a depth of 10.8 Å is cleaved along (001) crystallographic orientation. After that, a silica supercell of 16 × 9 × 1 is then rebuilt with dimensions of x = 78.61 Å, y = 76.59 Å, and z = 10.80 Å. The silica surface is completely methylated and the area of occupancy per methyl is 10.45 Å2.
Water films: three water films with thicknesses of 6, 8 and 10 Å are constructed using Amorphous Cell modules. The dimensions of the aqueous layer are x = 78.61 Å, y = 76.59 Å, and z = 6–10 Å. Next, the water film is placed onto the methylated silica surface to construct the initial simulation configuration, as shown in Fig. 1a.
 | ||
| Fig. 1 The configuration of water film adsorbed on a methylated silica surface: (a) initial configuration; (b) instantaneous configuration at t = 10 ps. | ||
The condensed-phase-optimized molecular potentials for atomistic simulation studies (COMPASS) Force Field is adopted in all the simulations.30 The total energy is given as the combination of valence terms and non-bonding interactions, and the summation of energies are listed in eqn (2):
| E = Ebonds + Eangles + Edihedrals + Ecross + EvdW + Eele | (2) |
The nonbonding interaction terms include a LJ-9–6 function for the van der Waals (vdW) term and a Coulombic function for an electrostatic interaction, represented by 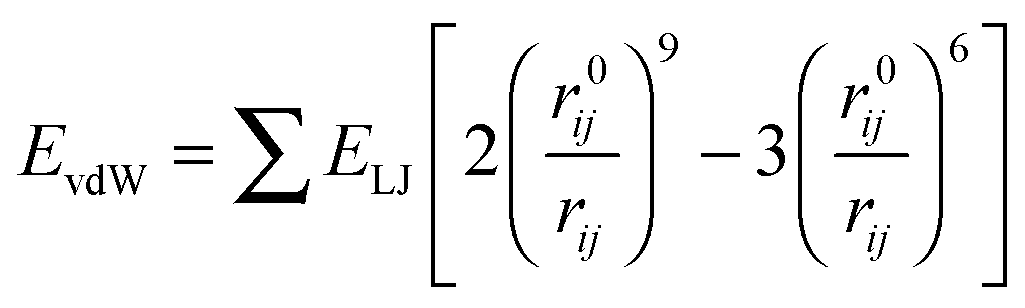 and
and 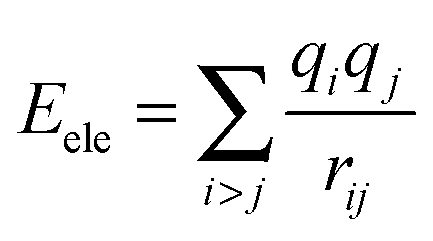 respectively. The vdW interactions are calculated by the atom-based method, and the cutoff distance is 12.5 Å. The long-range electrostatic interactions are described by the Ewald method,31 which is rather costly but accurate to the long-range electrostatic interactions. The charge parameters of COMPSS Force Field for silica and water are given in Table 1. All the MD simulations are carried out under canonical ensemble (NVT), and the equations of motion are integrated using the Velocity-Verlet algorithm32 with a time step of 1.0 fs. The simulations are carried out at 298 K using the Andersen thermostat33 with a coupling constant of 0.1 ps to control the temperature.
| Atom | Charge/e |
|---|---|
| Si of SiO2 | 0.89 |
| O of SiO2 | −0.445 |
| C of –CH3 | −0.294 |
| H of –CH3 | 0.053 |
| O of H2O | −0.82 |
| H of H2O | 0.41 |
During the simulation, silica surfaces are fixed because the vibration of these atoms is very small and could be neglected at room temperature. At the top of each model, a 5 nm vacuum slab is adopted to avoid any interaction of the periodic image in the adjacent simulation box originating from three-dimensional periodic boundaries. Finally, 2 ns simulations are conducted for all models. In order to avoid the occasionality of our simulation results, in the present study, three parallel simulations are run at the same time for each simulation system.
3. Results and discussion
3.1. Water film dewetting on methylated silica surface
Fig. 2 shows a series of snapshots for water film dewetting on the completely methylated silica surface. These snapshots are viewed from top of the water film at various times during the evolution process. The local white regions in each snapshot represent dry patches.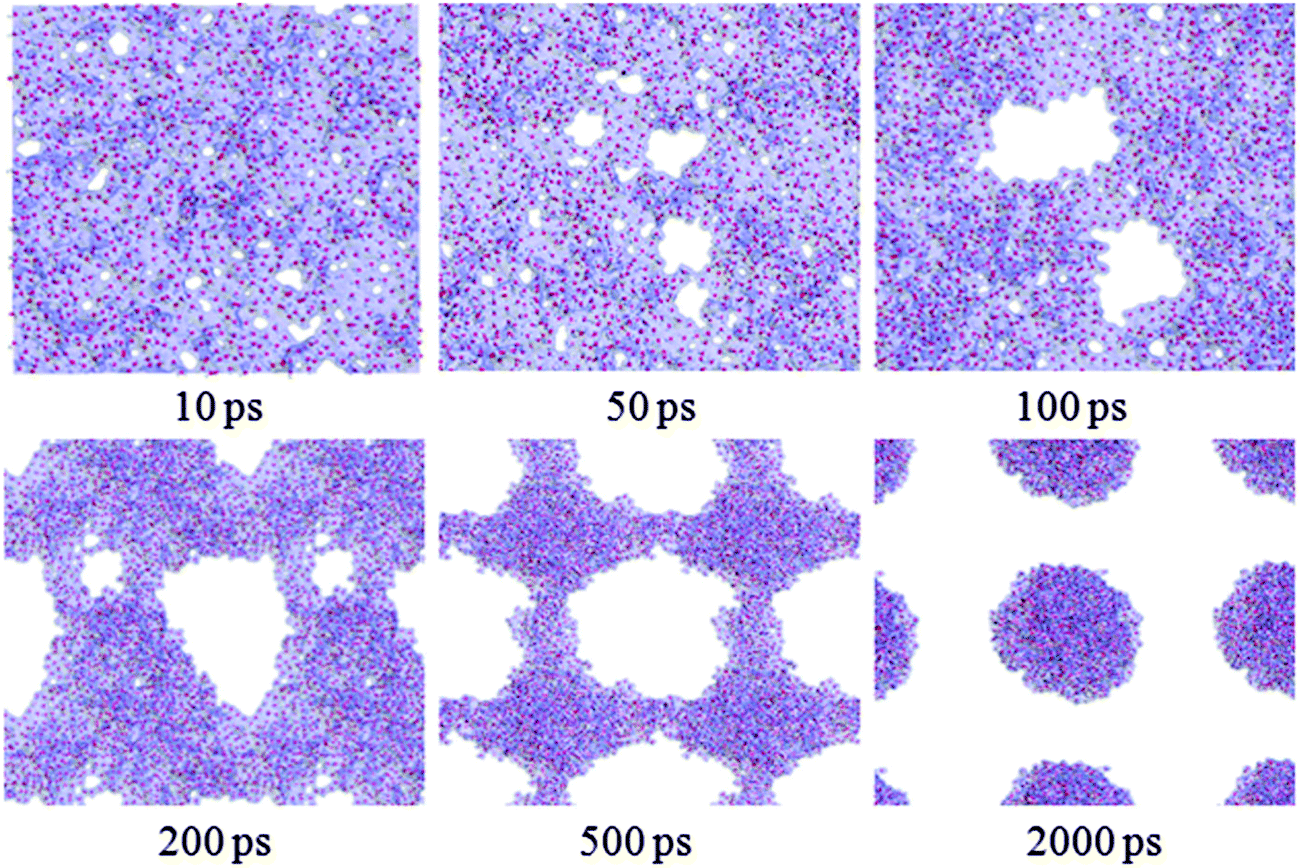 | ||
| Fig. 2 The structural evolution of water film of 6 Å on a completely methylated silica surface as a function of simulation time. The silica surface is hidden for clarity. | ||
From Fig. 2, at 10 ps, it can be observed that some dry patches appear. But in our simulation, the completely methylated silica surface is flat, and the water film is homogeneous. Therefore, there is no nucleation site at all. The appearance of dry patches through nucleation is unreasonable. On the other hand, previous theories and experiments have proved that the stability of thin film could also be controlled by the balance between disjoining pressure originating from molecular forces such as van der Waals forces and Laplace pressure due to film thickness fluctuation originating from capillary wave instability.34,35 These unstable fluctuations might develop into holes or dry patches (spinodal dewetting) when the surface is nonwettable to the film. In our study, the silica surface is methylated, and the polarity of the methyl group is weak. So there is a weak interaction between water molecules and the silica surface, and the modified silica surface is nonwettable to the water film. (Detailed information about the wettability of the methylated silica surface is analyzed below.) Furthermore, the simulation configuration at 10 ps (Fig. 1b) also shows that the water film experiences strong thickness fluctuations. Therefore, the appearance of dry patches through spinodal dewetting is supported.
However, as the simulation proceeds, many of these patches cannot be seen later and some new patches appear unceasingly. Through detailed observation of the simulation results from 10 to 500 ps, we find that only if a dry patch is larger than a couple of molecular diameters, that is to say once the molecules on the two sides of the dry patch are out of the mutual interaction range, does the dry patch grow continuously. After 500 ps, the bridges among water clusters collapse, and eventually, the water film withdraws into some discrete droplets at 2000 ps.
A better understanding of the contraction of the water film can be gained by the energy profiles. The total energy, Et, is defined as Et = Es–s + Ew–w + Es–w, where Es–s, Ew–w and Es–w represent the surface–surface, water–water and surface–water interactions, respectively. Naturally, Es–s is constant because of the fixation of the surface. Es–w is the resisting force which hinders the contraction of the water film as it acts in the reverse direction to the contraction. Therefore, Ew–w is the driving force. The energy difference, ΔEw–w, is partially transformed into kinetic energy of the water film, which induces the contraction.
Fig. 3 gives the changes of Es–w, Ew–w and the patch area as a function of simulation time. At the first 400 ps, the rapid decrease of the resisting force of Es–w and the increase of the driving force of the absolute value of Ew–w accelerate the contraction of the water film, thus leading to the rapid nearly-linear increase of the patch area. During the period of 400–800 ps, there are no significant changes in Es–w, Ew–w and the patch area. The dewetting process reaches a relatively stable state and a checkerboard-shaped configuration forms. After that, the bridges among water clusters collapse. The Es–w value decreases and the absolute value of Ew–w increases further, which drives the formation of discrete water droplets; and the patch area increases accordingly.
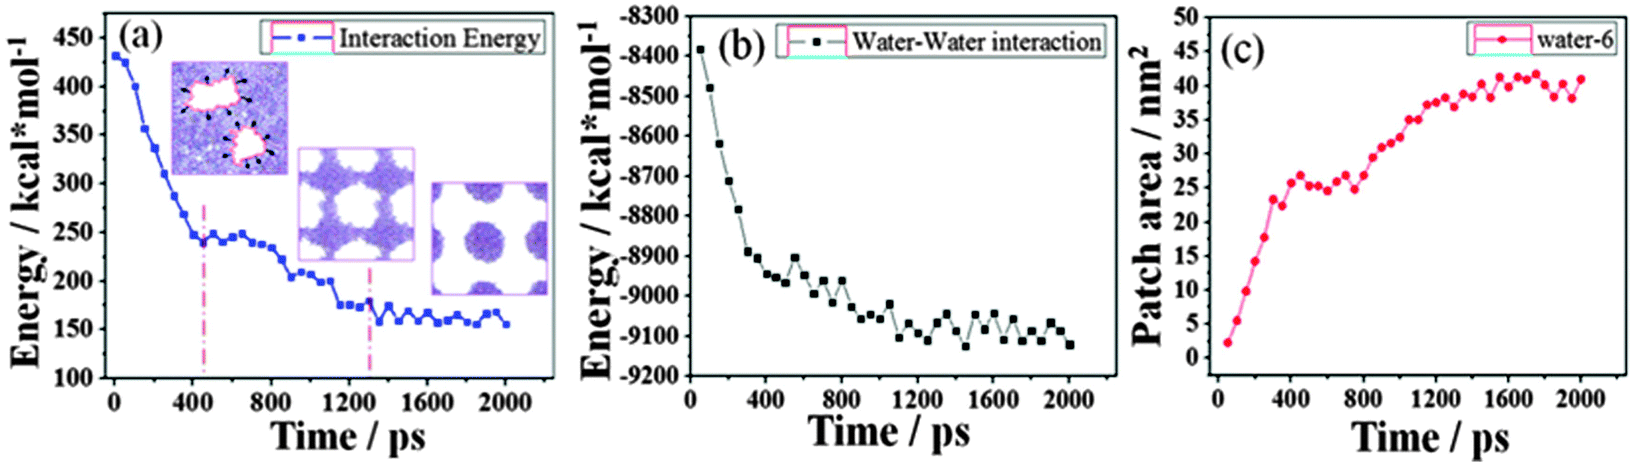 | ||
| Fig. 3 The changes in (a) Es–w and (b) Ew–w and (c) patch area as a function of simulation time. | ||
3.2. The microscopic mechanism for the contraction of water film
In the process of water film dewetting, it is important to reveal the microscopic interactions. In this section, the wetting behavior of the methylated silica surface is investigated to verify that the surface is nonwettable to the water film, and the microscopic mechanism for the contraction of water film is also studied. Initially, a water film with dimensions of 64.12 × 64.12 × 6.00 Å3 is put on the methylated (–CH3) silica surface. Fig. 4 shows the snapshots of the water film dewetting at different simulation times. It gives an intuitive vision of the dynamic dewetting process of the water film on the –CH3 silica surface.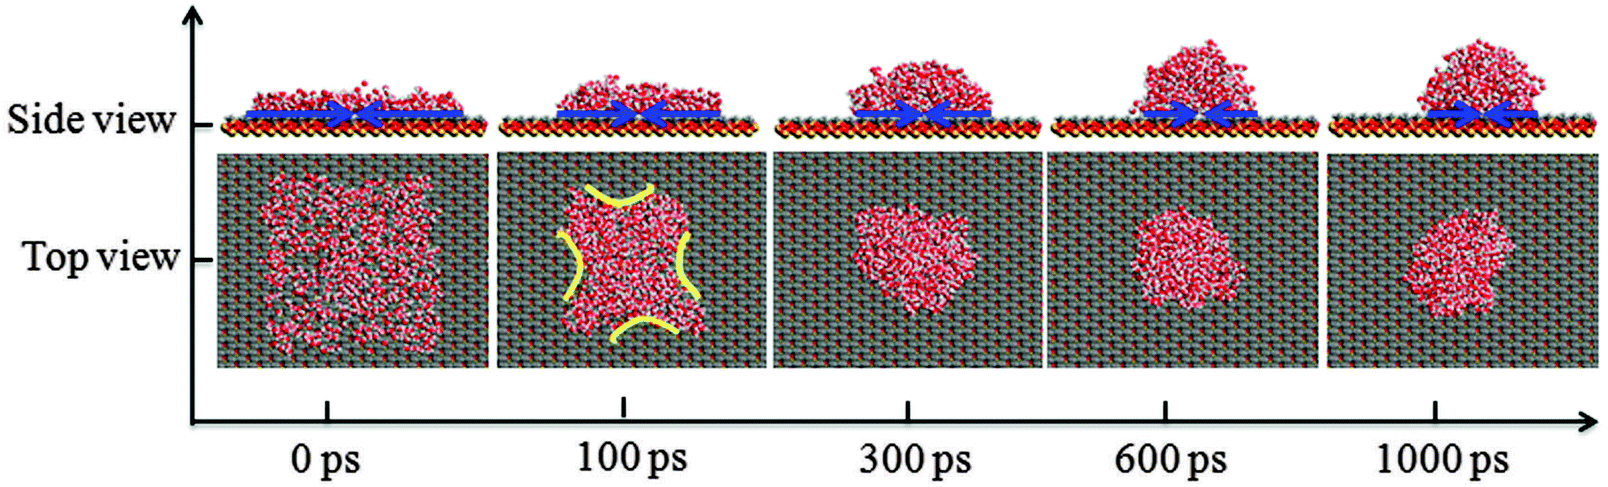 | ||
| Fig. 4 The dynamic dewetting process of water film on the –CH3 silica surface as a function of simulation time. | ||
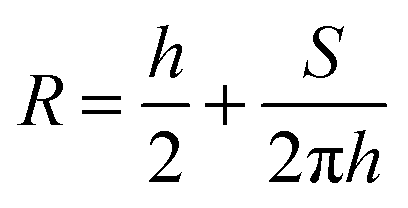
The contact angle (θwa) of the hemispherical water droplet is a crucial parameter to characterize the wettability of the surface. In this article, the method of Fan and Caǧin is exploited for the calculation of the contact angle.39 In this method, the θ is calculated by the following equations:
| S = πr2 | (3) |
 | (4) |
 | (5) |
The parameters in above equations are depicted in Fig. 5. Based on this method, the contact angle of the hemispherical water droplet (Fig. 4) is calculated, as shown in Table 2.
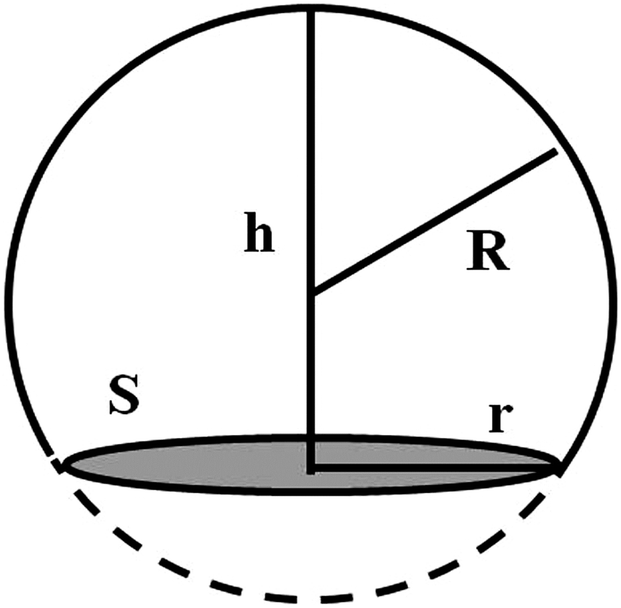 | ||
| Fig. 5 Geometrical parameters for the calculation of the contact angle θ. | ||
| Modified group | h/Å | r/Å | R/Å | cosθ |
θ° |
|---|---|---|---|---|---|
| –CH3 | 22.15 | 21.79 | 21.79 | −0.01 | 90.95 |
From Table 2, it is noticed that the contact angle of the hemispherical water droplet, θwa, on the –CH3 silica surface is 90.95°, which satisfies Young's equation σsa = σsw + σwacosθwa. During the simulation, the interfacial tensions of σsa, σwa and σsw are constant. When the water film is put on the –CH3 silica surface, the initial contact angle is approximately 0°. In order to satisfy Young's equation, the water film will contract, and the contact angle will increase. This also proves that the –CH3 silica surface is nonwettable to this water film.
(1) Interactions between water film and the –CH3 surface. We investigate the non-bonding interaction energies including van der Waals and electrostatic interaction energies between the water film and the –CH3 silica surface. The interaction energy can be calculated by the following equation:
| Ebind = Ewater + Esurface − Etotal | (6) |
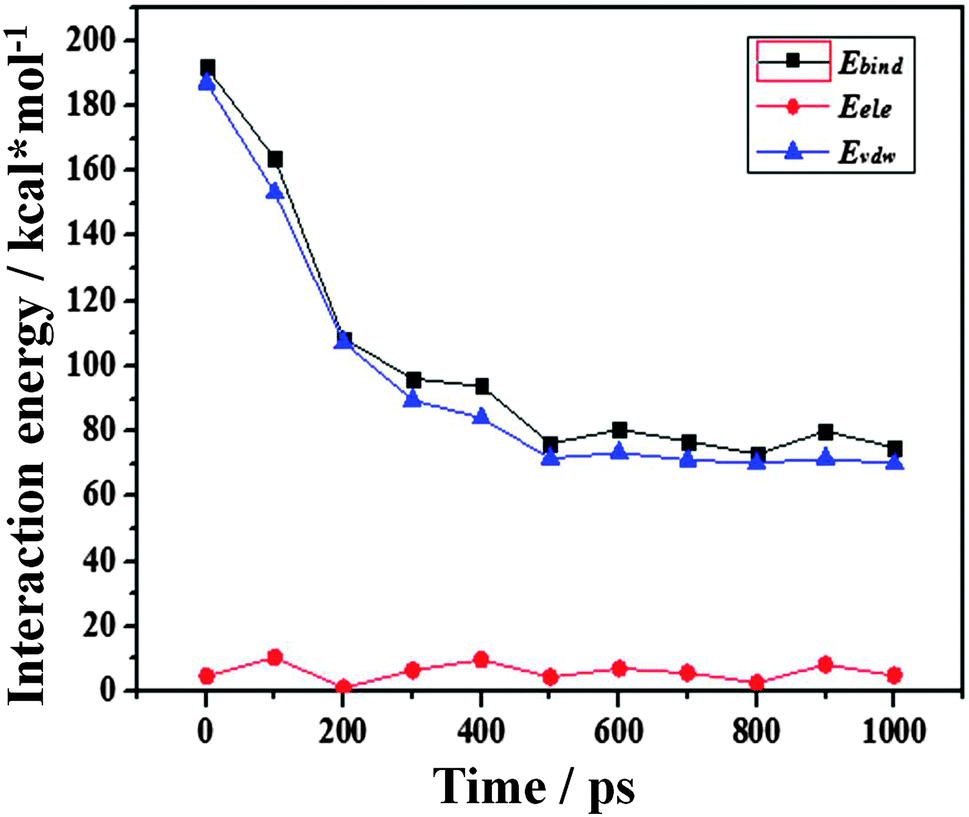 | ||
| Fig. 6 Non-bonding interaction energies of Ebind, EvdW and Eele between water molecules and the –CH3 silica surface as a function of simulation time. | ||
From Fig. 6, it can be found that all the interaction energies decrease as the dewetting of the water film takes place. But the changes in Ebind and EvdW are nearly synchronous while the Eele changes little, which implies that the interactions between the water film and the –CH3 silica surface are mainly contributed by the van der Waals potentials. Because the van der Waals potential is one type of weak interaction, the Ebind between the water film and the –CH3 surface should not be very large.
(2) Interactions among water molecules. The non-bonding interaction energies of EvdW and Eele among water molecules at 0 ps and 100 ps are calculated, respectively. The ΔEvdW is 106.94 kcal mol−1 and ΔEele is −453.21 kcal mol−1. The positive value indicates repulsive interaction and the negative value indicates attractive interaction. The absolute value of ΔEele of 453.21 kcal mol−1 is much larger than the ΔEvdW of 106.94 kcal mol−1 and Ebind between water molecules and the silica surface (0–100 ps in Fig. 6). The energy difference, ΔEele, is partially transformed into kinetic energy of the water film, which induces the contraction. Therefore, from the above value of ΔEele, it can be inferred that the electrostatic interactions among water molecules provide the main driving force to overcome the repulsive force of vdW among water molecules and the attractive force between water molecules and the –CH3 surface, which induces the rapid contraction of the water film.
(3) Hydrogen bond interactions. The interactions of hydrogen bonds (H-bonds) also play an important role in the contraction of the water film. The H-bonds can be formed among water molecules, while there are no H-bonds between water molecules and the –CH3 silica surface. In this study, the average number of H-bonds per water molecule (Fig. 4) along with simulation time is calculated, as shown in Fig. 7.
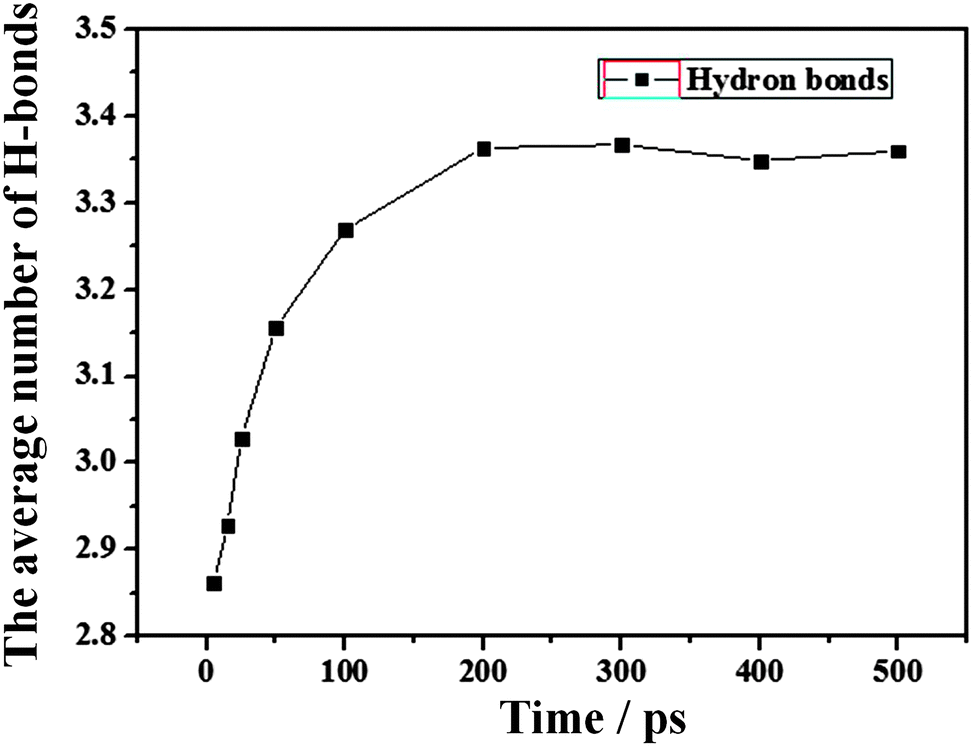 | ||
| Fig. 7 The time evolution (0–500 ps) of the average number of HBs per water molecule for the water film as shown in Fig. 4. | ||
The H-bond definition employed in this work is a geometrical criterion. Two water molecules are hydrogen-bonded if the following three conditions are fulfilled:40 (1) the distance ROO between the oxygen of both molecules has to be smaller than 3.6 Å. (2) The distance ROH between the oxygen of the acceptor molecule and the hydrogen of the donor has to be lower than 2.4 Å. (3) The bond angle φ between the O–O direction and the molecular O–H direction of the donor, where H is the hydrogen which forms the bond, has to be lower than 30°. From Fig. 7, the final average number of H-bonds per water molecule is approximately 3.35, which is in reasonable agreement but less than the experiment bulk value of 3.941 and the previous MD studies of 3.4–3.740,42,43 due to the large number of surface water molecules with unsaturated H-bonds. At the same time, the average number of H-bonds per water molecule increases with simulation time, which indicates that more H-bonds are formed among water molecules. Generally, forming more H-bonds means that the transfer of water molecules would be largely restrained, which results in high stabilization. This indicates that the interactions of H-bonds among water molecules will drive the water molecules around the boundary of the water film to the inner part of the film, which induces the contraction.
θ − cosθ0), in which θ is the dynamic contact angle and θ0 is the equilibrium contact angle.44,45 As the contraction of the water film begins, the dynamic contact angle increases. As a result, the driving force decreases. Finally, θ is equal to θ0, and the contraction of water film is over. At the molecular level, it can be seen that the unsaturated intermolecular interactions for water molecules located at the edge of the water film are interpreted as the main contributions to the contraction of the water film. The water molecules at the edge of the water film could overcome the pinning force from the surface and move upward.
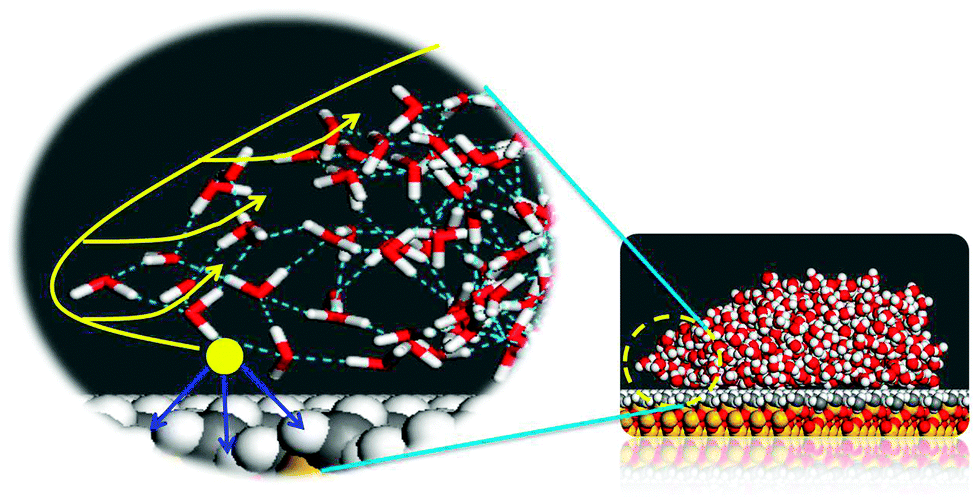 | ||
| Fig. 8 Illustration of the unbalanced interaction at the edge of the water film during dewetting. The blue arrows represent the pinning effect of the surface to water molecules. The yellow arrows show the contractive direction of water film. | ||
3.3. The effect of film thickness on water film dewetting
It is obvious that when the thickness of a water film is more than a critical value, the water film will stay on the –CH3 silica surface steadily without dewetting. Therefore, the film thickness has a great effect on the water film dewetting. In this section, we control the water film thickness accurately to investigate the effect of film thickness on water film dewetting. Three water films with different initial thicknesses of 6, 8 and 10 Å are selected. The simulation results are shown in Fig. 9. From this figure, it is interesting to observe that the final dewetting patterns undergo discrete droplets and striation-shaped structures with film thicknesses of 6 and 8 Å, respectively. This indicates that the dewetting patterns could be regulated by film thickness, which might be helpful in the field of self-assembly of nanomaterials through film dewetting.46,47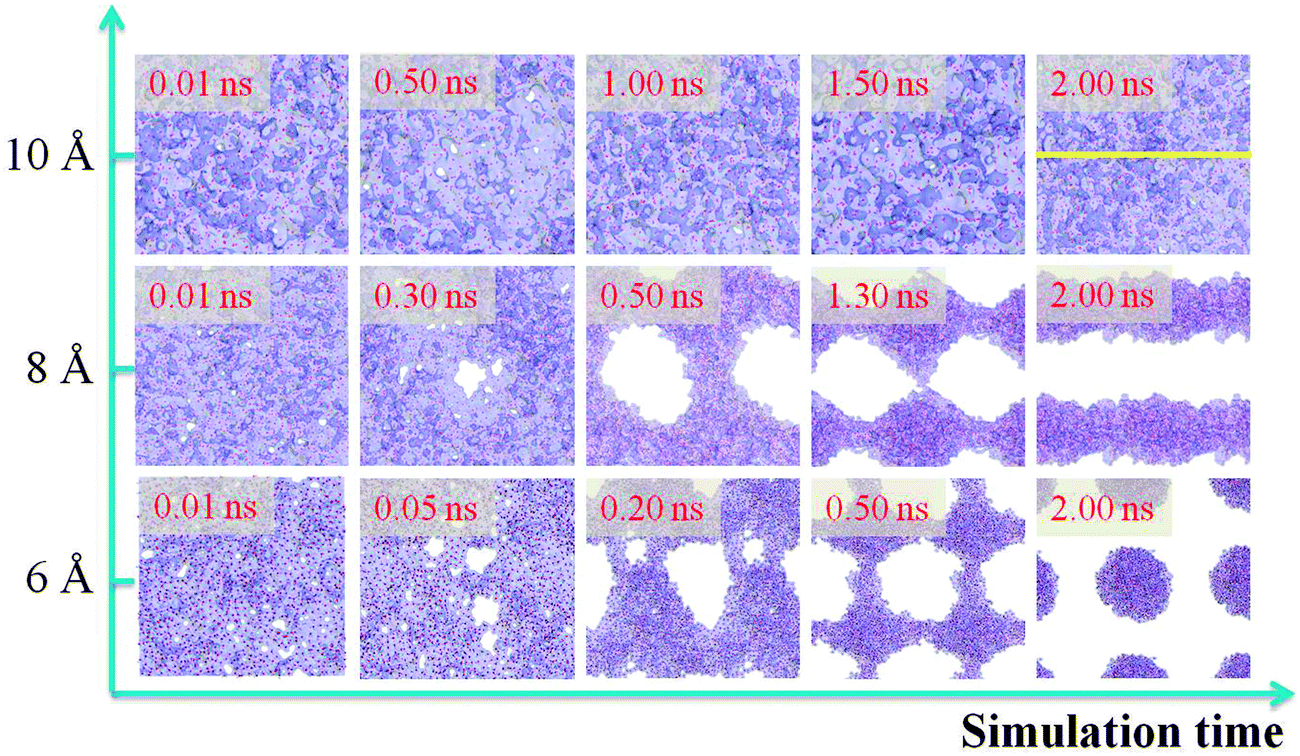 | ||
| Fig. 9 Matrix of snapshots from dewetting simulation as a function of the increase of water film thickness (along the y-axis) and simulation time (along the x-axis). | ||
However, when the film thickness is 10 Å, there are no dry patches along the whole simulation time. As has been proved,24,48 the dry patches stem from surface undulation. In order to describe surface undulation, the film thickness along the yellow line in Fig. 9 is calculated, and one of the surface undulations of the statistical final thirty frames is shown in Fig. 10. From the figure, the maximum surface undulation, H, is approximately 9.08 Å. However, the film could not rupture until H becomes nearly equal to the film thickness, 10 Å, which is a general rupture criterion for the break up of the liquid film and threads into droplets.24,34,35 This indicates that the critical rupturing thickness of water films on the methylated silica surface is approximately 10 Å.
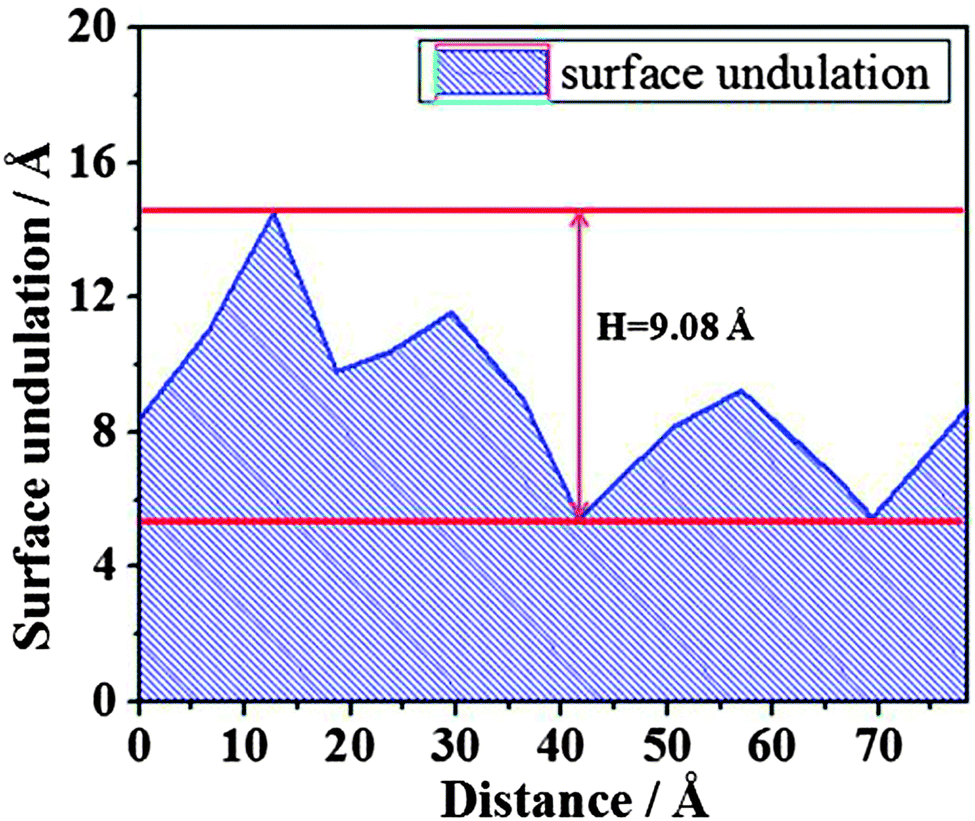 | ||
| Fig. 10 The surface undulation of water film of 10 Å along the yellow line in Fig. 9. | ||
4. Conclusion
In this paper, the dewetting behaviors of nanoscale water films on –CH3 silica surfaces are investigated to reveal the microscopic dewetting mechanism. The simulation results show that the dewetting process is divided into two stages: the appearance of dry patches and the contraction of water film. First, the appearance of dry patches is due to the film thickness fluctuation originating from capillary wave instability. Second, for the contraction of water film, the interactions between water molecules and the silica surface is the resisting force which hinders the contraction of water film, while the interactions among water molecules, Ew–w, is the driving force. The energy difference of ΔEw–w is partially transformed into kinetic energy of water film, which induces the contraction of the film. Detailed studies suggest that the driving forces stem from the unsaturated electrostatic and hydrogen bond interactions among water molecules. Finally, the effect of film thickness on the water film dewetting is studied. The simulation results indicate that upon increasing the water film thickness, the final dewetting patterns experience discrete droplets and striation-shaped structures. Upon increasing the film thickness further, the water film is stable and there are no dry patches. From our study, the critical rupturing thickness of water films on the –CH3 silica surface is approximately 10 Å.Our research studies investigate the microscopic dewetting behavior of water film on the –CH3 silica surface following a theoretical approach, which is helpful in understanding many phenomena in scientific and industrial processes better, such as self-assembly, coatings, detergency, etc.
Author contributions
All authors have contributed to this work, and a have given their approval to the final version of the manuscript.Acknowledgements
This work is financially supported by National Natural Science Foundation of China (51034007 and 51302321), PetroChina Innovation Foundation (2013D-5006-0206), Fundamental Research Funds for the Central Universities (14CX02002A and 13CX05019A) and National Major Project of Fundamental Research (2014CB239204).References
- J. H. Park and N. R. Aluru, J. Phys. Chem. C, 2010, 114, 2595–2599 CAS.
- G. E. Ewing, Chem. Rev., 2006, 106, 1511–1526 CrossRef PubMed.
- N. Severin, P. Lange, I. M. Sokolov and J. P. Rabe, Nano Lett., 2012, 12, 774–779 CrossRef PubMed.
- T. K. Tokunaga, Langmuir, 2013, 29, 3152 CrossRef CAS.
- X. Wang and C. You, J. Aerosol Sci., 2013, 63, 1–9 CrossRef PubMed.
- T. Young, Philos. Trans. R. Soc. London, 1805, 95, 65–87 CrossRef.
- W. G. Anderson, J. Pet. Technol., 1986, 38, 1371–1378 CrossRef PubMed.
- D. B. Asay and S. H. Kim, J. Chem. Phys., 2006, 124, 174712 CrossRef PubMed.
- J. Janeček and R. R. Netz, Langmuir, 2007, 23, 8417–8429 CrossRef PubMed.
- C. Wang, B. Zhou, P. Xiu and H. Fang, J. Phys. Chem. C, 2011, 115, 3018–3024 CAS.
- X. Chen, R. Ma, J. Li, C. Hao, W. Guo, B. L. Luk, S. C. Li, S. Yao and Z. Wang, Phys. Rev. Lett., 2012, 109, 116101 CrossRef.
- T. Koishi, K. Yasuoka, S. Fujikawa and X. C. Zeng, ACS Nano, 2011, 5, 6834–6842 CrossRef CAS PubMed.
- A. Sehgal, D. Bandyopadhyay, K. Kargupta, A. Sharma and A. Karim, Soft Matter, 2012, 8, 10394–10402 RSC.
- K. Kargupta and A. Sharma, J. Chem. Phys., 2002, 116, 3042–3051 CrossRef CAS PubMed.
- A. Calò, P. Stoliar, M. Cavallini, S. Sergeyev, Y. H. Geerts and F. Biscarini, J. Am. Chem. Soc., 2008, 130, 11953–11958 CrossRef PubMed.
- C. Favazza, R. Kalyanaraman and R. Sureshkumar, Nanotechnology, 2006, 17, 4229 CrossRef CAS PubMed.
- T. Bublat and D. Goll, Nanotechnology, 2011, 22, 315301 CrossRef CAS PubMed.
- M. Cavallini, J. Gomez-Segura, C. Albonetti, D. Ruiz-Molina, J. Veciana and F. Biscarini, J. Phys. Chem. B, 2006, 110, 11607–11610 CrossRef CAS PubMed.
- I. Karapanagiotis, D. F. Evans and W. W. Gerberich, Langmuir, 2001, 17, 3266–3272 CrossRef CAS.
- S. K. Lim, S. Perrier and C. Neto, Soft Matter, 2013, 9, 2598–2602 RSC.
- S. K. Kalpathy, L. F. Francis and S. Kumar, J. Colloid Interface Sci., 2013, 408, 212–219 CrossRef CAS PubMed.
- L. Xue and Y. Han, Prog. Polym. Sci., 2011, 36, 269–293 CrossRef CAS PubMed.
- J. Bischof, D. Scherer, S. Herminghaus and P. Leiderer, Phys. Rev. Lett., 1996, 77, 1536–1539 CrossRef CAS.
- R. Xie, A. Karim, J. F. Douglas, C. C. Han and R. A. Weiss, Phys. Rev. Lett., 1998, 81, 1251–1254 CrossRef CAS.
- C. D. Wu, L. M. Kuo, S. J. Lin, T. H. Fang and S. F. Hsieh, Comput. Mater. Sci., 2012, 53, 25–30 CrossRef CAS PubMed.
- C. Wang, H. Lu, Z. Wang, P. Xiu, B. Zhou, G. Zuo, R. Wan, J. Hu and H. Fang, Phys. Rev. Lett., 2009, 103, 137801 CrossRef.
- J. W. Kang, H. J. Hwang and K.-S. Kim, Comput. Mater. Sci., 2012, 65, 216–220 CrossRef CAS PubMed.
- W. Yang, R. Wu, B. Kong, X. Zhang and X. Yang, J. Phys. Chem. B, 2009, 113, 8332–8338 CrossRef CAS PubMed.
- H. Luo and D. Gersappe, Macromolecules, 2004, 37, 5792–5799 CrossRef CAS.
- H. Sun, J. Phys. Chem. B, 1998, 102, 7338–7364 CrossRef CAS.
- P. P. Ewald, Ann. Phys., 1921, 369, 253–287 CrossRef.
- L. Verlet, Phys. Rev., 1967, 159, 98–103 CrossRef CAS.
- H. C. Andersen, J. Chem. Phys., 1980, 72, 2384–2393 CrossRef CAS PubMed.
- A. Vrij and J. T. G. Overbeek, J. Am. Chem. Soc., 1968, 90, 3074–3078 CrossRef CAS.
- A. Milchev and K. Binder, J. Chem. Phys., 1997, 106, 1978–1989 CrossRef CAS PubMed.
- Z. Xu, K. Song, S. L. Yuan and C. B. Liu, Langmuir, 2011, 27, 8611–8620 CrossRef CAS PubMed.
- M. Szöri, D. J. Tobias and M. Roeselová, J. Phys. Chem. B, 2009, 113, 4161–4169 CrossRef PubMed.
- X. Y. Li, Y. Z. He, Y. Wang, J. C. Dong and H. Li, Sci. Rep., 2014, 4, 1–6 Search PubMed.
- C. F. Fan and T. Caǧin, J. Chem. Phys., 1995, 103, 9053–9061 CrossRef CAS PubMed.
- J. Martí, J. Chem. Phys., 1999, 110, 6876–6886 CrossRef PubMed.
- N. Matubayasi, C. Wakai and M. Nakahara, J. Chem. Phys., 1997, 107, 9133–9140 CrossRef CAS PubMed.
- T. Werder, J. H. Walther, R. L. Jaffe, T. Halicioglu and P. Koumoutsakos, J. Phys. Chem. B, 2003, 107, 1345–1352 CrossRef CAS.
- J. H. Walther, R. Jaffe, T. Halicioglu and P. Koumoutsakos, J. Phys. Chem. B, 2001, 105, 9980–9987 CrossRef CAS.
- T. D. Blake, J. Colloid Interface Sci., 2006, 299, 1–13 CrossRef CAS PubMed.
- F. C. Wang and H. A. Wu, Soft Matter, 2013, 9, 5703–5709 RSC.
- A. M. Higgins and R. A. L. Jones, Nature, 2000, 404, 476–478 CrossRef CAS PubMed.
- J. Huang, F. Kim, A. R. Tao, S. Connor and P. Yang, Nat. Mater., 2005, 4, 896–900 CrossRef CAS PubMed.
- H. Liu, A. Bhattacharya and A. Chakrabarti, J. Chem. Phys., 1998, 109, 8607–8611 CrossRef CAS PubMed.
| This journal is © the Owner Societies 2015 |