
 Open Access Article
 This Open Access Article is licensed under a Creative Commons Attribution-Non Commercial 3.0 Unported Licence
The influence of reaction media on CdIn2S4 and ZnIn2S4 nanocrystallite formation and growth of mesocrystal structures†
M. V.
Carević
a,
M. I.
Čomor
*a,
M. N.
Mitrić
a,
T. S.
Barudžija
a,
S. P.
Ahrenkiel
b and
N. D.
Abazović
*a
aVinča Institute of Nuclear Sciences, University of Belgrade, P.O. Box 522, Belgrade, Serbia. E-mail: mirjanac@vinca.rs; kiki@vinca.rs
bSouth Dakota School of Mines and Technology, 501 E. Saint Joseph Street, Rapid City, SD 57701, USA
First published on 5th October 2015
Abstract
A hot-injection method for the synthesis of CdIn2S4 in three different compositions of organic media/solvents was studied. Nanosized CdIn2S4 is successfully synthesized in an oleic acid/oleylamine mixture of complexing/capping agents. The obtained mesocrystals of 20–30 nm in diameter are self-organized in marigold-like structures. The estimated band-gap of synthesized semiconductor is in the visible spectral region and has a value of about 2.1 eV. The potential of the band edges is calculated using an empirical equation. The as-prepared material was successfully transferred from organic to aqueous media by using 2-mercaptoethanol in a surface ligand exchange process. Using a similar synthetic procedure, ZnIn2S4 synthesis was performed. The obtained materials were characterized using UV/vis spectroscopy, XRD and TEM. Formation and growth mechanisms of the synthesized materials are proposed.
Introduction
It is well known that binary II–VI metal sulfides (CdS, ZnS) are unstable during photocatalytic processes and easily undergo photocorrosion under the influence of photogenerated holes. Efforts have been made in order to stabilize these materials, mostly by the incorporation of metal sulfides into their interlayers, but although this step stabilizes the photocatalyst, its photocatalytic efficiency is reduced.1 As a replacement, ternary metal sulfides can be considered since they have narrow band gaps and strong absorption in the visible spectral region.2 Beside their possible application as photocatalysts in degradation processes of various pollutants, these properties make this class of materials suitable for application in photoproduction of H2 from water and H2S. Two semiconductors from this II–III2–VI4 family that are especially interesting are CdIn2S4 (CIS) and ZnIn2S4 (ZIS). CIS has a direct band gap of 2.1–2.2 eV (about 560 nm) meaning that it has strong absorption in the visible part of the spectrum. It usually crystallizes in a cubic spinel structure which belongs to the Fd3m space group. In contrast, bulk ZIS has an indirect band-gap, with reported energy values from 2.1 to 1.8 eV (590 to 690 nm) which makes it a very suitable material for solar energy conversion applications. It has three polymorphs: rhombohedral, cubic and hexagonal, wherein the hexagonal form (space group P63mc) is the most common one.Both materials are typically synthesized via a solvothermal/hydrothermal route2–8 but a few groups have used different approaches: a hot-wall epitaxy method,9 a microwave-solvothermal approach10,11 and ultrasonic spray pyrolysis (USP).12 Interestingly, there are very few articles13–16 where a hot-injection approach is used for the synthesis of these materials. The hot-injection method has been widely used in synthesis of II–VI semiconductors since the first article of Murray et al.17 where the authors presented a new way to synthesize highly crystalline CdE (E = S, Se, Te) nanoparticles. In the huge number of articles that followed that deal with the hot-injection method, it has been shown that this route of synthesis provides not just control over sizes and shapes, but also over the crystallinity and crystal phase of the obtained particles. The only “catch” is choosing the appropriate combination of ion precursors and surfactants/organic solvents, since temperature/time frame is not the only factor that can influence the reaction rates and sizes of obtained nanoparticles. This approach was our method of choice for the synthesis of CIS and ZIS as a continuation of our previously published results.18,19
In this paper, we have studied the influence of different organic reaction media on the crystallinity and crystal phase of the obtained materials. The importance of this dependence, as Bhirud et al.5 proposed, is crucial for the application of these materials. Photocatalytic activity of CIS particles highly depends on their crystallinities rather than on particle sizes or surface areas, since a lack of defect sites promotes separation and migration of photogenerated carriers towards their surfaces. We tried to show that by proper combination of organic surfactants, it is possible to obtain highly crystalline samples. For most applications, aqueous media is required, so here we also proposed an easy way to transfer the obtained samples from organic media to water, by using 2-mercaptoethanol as a capping agent.
Experimental
Materials
All chemicals were of analytical grade (highest available) and were used without further purification. All precursor solutions were freshly prepared before synthesis.Cadmium acetate dihydrate (Cd(Ac)2), zinc acetate (Zn(Ac)2), indium acetate (In(Ac)3), oleic acid (OA, C17H33COOH), 1-octadecene (ODE, C18H36), oleylamine (OLAM, C18H35NH2) and 2-mercaptoethanol (2ME, HS–C2H4–OH) were purchased from Sigma-Aldrich. Sulfur powder was obtained from Alfa Aesar. Toluene and acetone were purchased from JT Baker.
Sample C1
Sample C2
Sample C3
Sample Z1
(Molarities of all precursor solutions are given in Table S1 in ESI.†)
General procedure for synthesis
In a typical synthesis, separate precursor solutions of Cd/Zn, In, and S were prepared in a convenient organic solvent, under a constant Ar flow. Then, at 270 °C, the Cd/Zn and S solutions were swiftly injected into the In solution, and the reaction mixture was kept at that temperature for a fixed time. Exact combinations of precursors and reaction times are presented in Table 1. After synthesis, the mixtures were left to cool down to room temperature, and then the obtained precipitates were washed three times with a toluene–acetone mixture (3/1, v/v) in order to discard excess organic molecules. Finally, the obtained nanocrystals were either re-dispersed in toluene (for TEM and optical measurements) or dried at 60 °C for XRD measurements.| Sample | Precursor combination | Reaction time |
|---|---|---|
| C1 | Cd1 + In1 + S1 | 4 h |
| C2 | Cd2 + In2 + S2 | 4 h |
| C3 | Cd2 + In2 + S3 | 1 h |
| Z1 | Zn1 + In2 + S4 | 30 min |
Organic to aqueous phase transfer of C3
4 ml of CIS–toluene dispersion was dried under Ar flow. Then, 4 ml of a 1 M aqueous solution of 2-mercaptoethanol (pH = 8–9) was added to this dried sample. After slight shaking, nanoparticles were dispersed in water and used for optical and TEM measurements. This dispersion was stable for months (no precipitation or degradation).Results and discussion
CdIn2S4
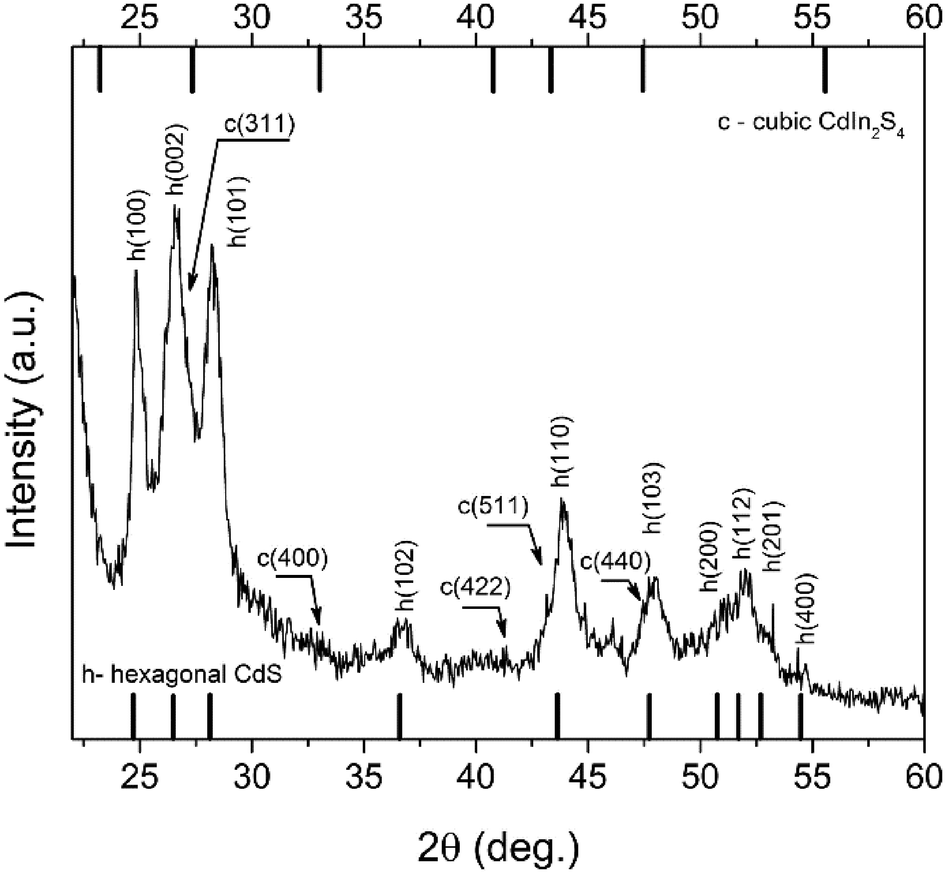
Typically, in hot-injection synthesis of II–VI semiconductors, a TOP/TOPO combination of solvent/capping agents is used. Both molecules contain a phosphorus ion, and because of this fact, their usage and later disposal could be considered as extremely harmful to the environment. As the method has developed through the years, hydrocarbon molecules with some other functional groups (amino, carboxyl, etc.) have been used instead, in order to control the reaction course and growth of the particles, as these molecules are regarded as a lesser threat to humans and the environment. Lately, all these considerations went one step further, and utilization of 1-octadecene or paraffin (both are hydrocarbon chains without any functional groups) as solvent/reaction media, meaning the reaction occurred primarily in the organic phase, took place. Such a method was firstly introduced by Yu et al.,20 for synthesis of CdS.Guided by this “greener” approach, we also have tried to synthesize CIS in conditions where oleic acid is used only in stoichiometric amounts, i.e. only as a complexation agent for cations, while ODE was used as both a solvent for elemental sulfur and an overall reaction medium. The X-ray diffractogram of a sample (C1) synthesized in this way is presented in Fig. 1 (and Fig. S1 in ESI†). However, as can be seen in Fig. 1, all the major diffraction peaks originate from hexagonal CdS (JCPDS card No. 75-1545). However, more careful consideration of the diffraction pattern reveals the presence of cubic CdIn2S4 (JCPDS card No. 27-0060). Namely, low-intensity peaks may be seen at about 33° and 40.7° that originate from reflections (400) and (422) of the cubic CdIn2S4 phase. Additionally, diffraction peaks at about 27°, 44° and 48° are obviously broader due to overlapping of the (002), (110) and (103) reflections of the major hexagonal CdS phase and (311), (511) and (440) reflections of the cubic CdIn2S4 phase, respectively.
 | ||
| Fig. 1 XRD pattern of sample C1, synthesized in 1-octadecene. | ||
Evidently, these reaction conditions did not favour formation of CIS, even if the temperature was high enough (270 °C) for degradation of cation–acid complexes, and the reaction time was 4 h which should be enough for completion of the reaction between ions. Clearly, temperature/time frame is not a major factor in determining the course and output of the reaction. Rather, in this case the chemical properties of oleic acid and ODE are a major factor, oleic acid having a dual role as both a complexing and capping agent, but the most important factor is the ratio between In ions and oleic acid. Battaglia and Peng21 have investigated the influence that different fatty acids have on formation of InP . They found that not just the length of the hydrocarbon chain, but also the relative molar ratio between In and fatty acid determines whether InP will be formed or not. For example, if the molar ratio between In and myristic acid in the reaction mixture was 1![[thin space (1/6-em)]](https://www.rsc.org/images/entities/char_2009.gif) :2, there was no distinguishable absorption peak of InP nanoparticles as proof of their formation. Also, if this ratio is 1:4.5 at longer reaction times, the absorption peak is not well defined. They concluded that for each examined acid there is a certain molar ratio between In and fatty acid, at which it is possible to synthesize InP nanoparticles of high quality. Such a ratio surely exists also for In and oleic acid, and we presumed that we were not within that specific concentration window, so the reactivity of In ions necessary for formation of CIS was not reached. However, this question needs detailed study, especially because here we are trying to synthesize ternary (not binary) sulfides. An additional drawback of this combination of solvent/complexation agents is that neither the size nor morphology of the particles can be controlled, as can be seen from TEM images (Fig. 2). Although the sample is highly crystalline and crystal planes are clearly visible, the sizes of the particles range from 2 to 20 nm while the morphology varies from spherical particles to faceted flakes (Fig. 2b–d).
:2, there was no distinguishable absorption peak of InP nanoparticles as proof of their formation. Also, if this ratio is 1:4.5 at longer reaction times, the absorption peak is not well defined. They concluded that for each examined acid there is a certain molar ratio between In and fatty acid, at which it is possible to synthesize InP nanoparticles of high quality. Such a ratio surely exists also for In and oleic acid, and we presumed that we were not within that specific concentration window, so the reactivity of In ions necessary for formation of CIS was not reached. However, this question needs detailed study, especially because here we are trying to synthesize ternary (not binary) sulfides. An additional drawback of this combination of solvent/complexation agents is that neither the size nor morphology of the particles can be controlled, as can be seen from TEM images (Fig. 2). Although the sample is highly crystalline and crystal planes are clearly visible, the sizes of the particles range from 2 to 20 nm while the morphology varies from spherical particles to faceted flakes (Fig. 2b–d).
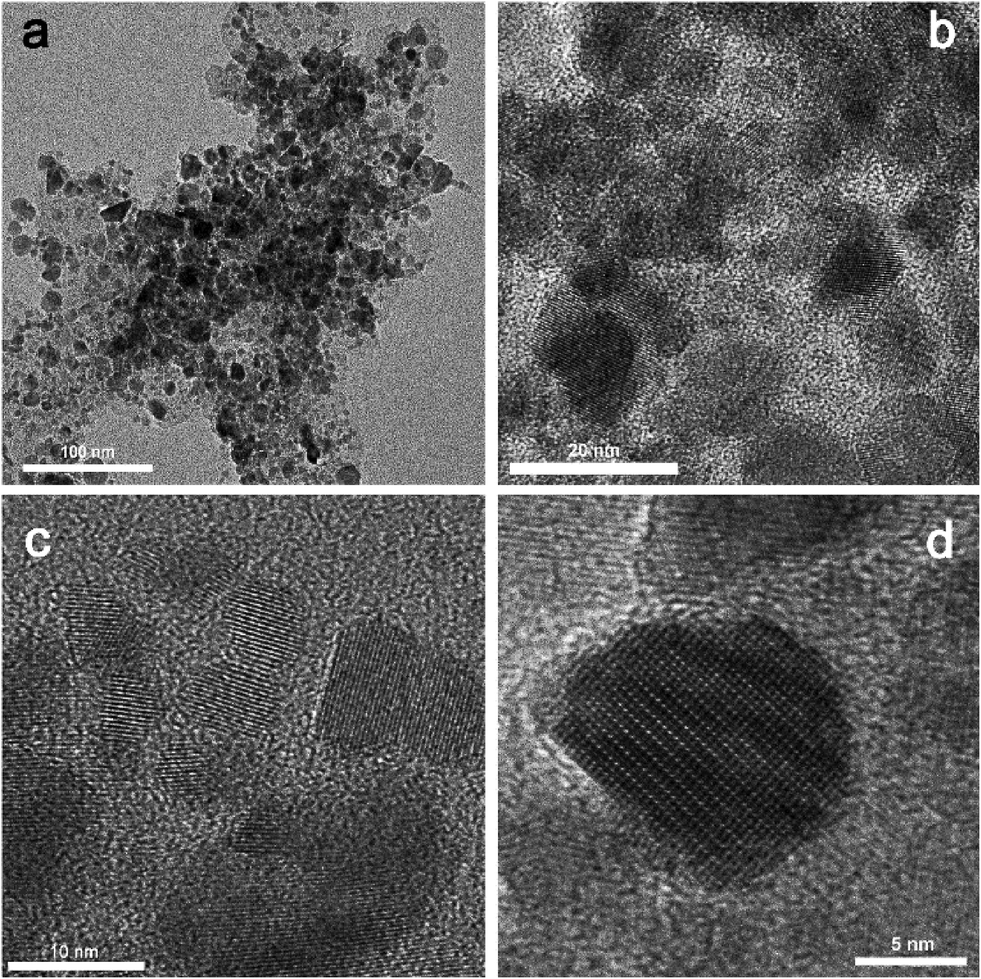 | ||
| Fig. 2 TEM images (a–d) of sample C1, synthesized in presence of 1-octadecene. | ||
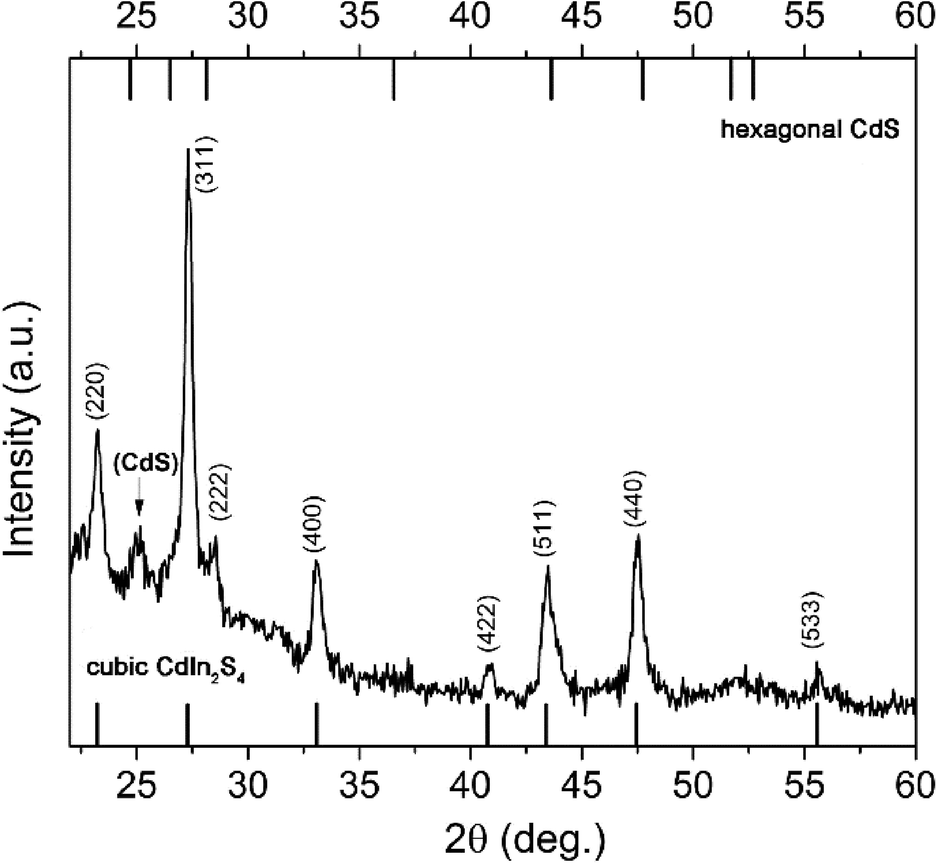
Our next step was to go to the extreme, and to use only oleic acid, while in order to push the reaction towards formation of CIS, the molarity of Cd ions was decreased to 2/3 of the stoichiometric value (sample C2). A diffractogram of this sample is presented in Fig. 3 (and Fig. S2 in ESI†).
 | ||
| Fig. 3 XRD pattern of sample C2, synthesized in oleic acid. | ||
Clearly, the majority of the material is cubic crystalline form CIS (JCPDS card No. 27-0060), but there are still a few low-intensity peaks that most probably originate from hexagonal CdS. The existence of well-defined sharp peaks that are broad at the low intensity and form so-called “hills” at lower degrees regions, indicated a simultaneous presence of well-crystallized crystal domains together with crystal domains of just a few nanometers. Using an X-ray Line Profile Fitting Program (XFIT)22 we calculated that coherent domain sizes of the larger fraction/particles in the sample are about 29 nm. Co-existence of two types of materials in sample C2 is confirmed with TEM images (Fig. 4a). SAED confirmed the existence of CdS and CIS in the sample (Fig. 4d). According to the XRD pattern larger particles originate from CIS (Fig. 4b), while particles of about 4 nm are from CdS (Fig. 4c). Interestingly, there is a certain uniformity in the particle sizes in both groups (indicated by the arrows in Fig. 4a).
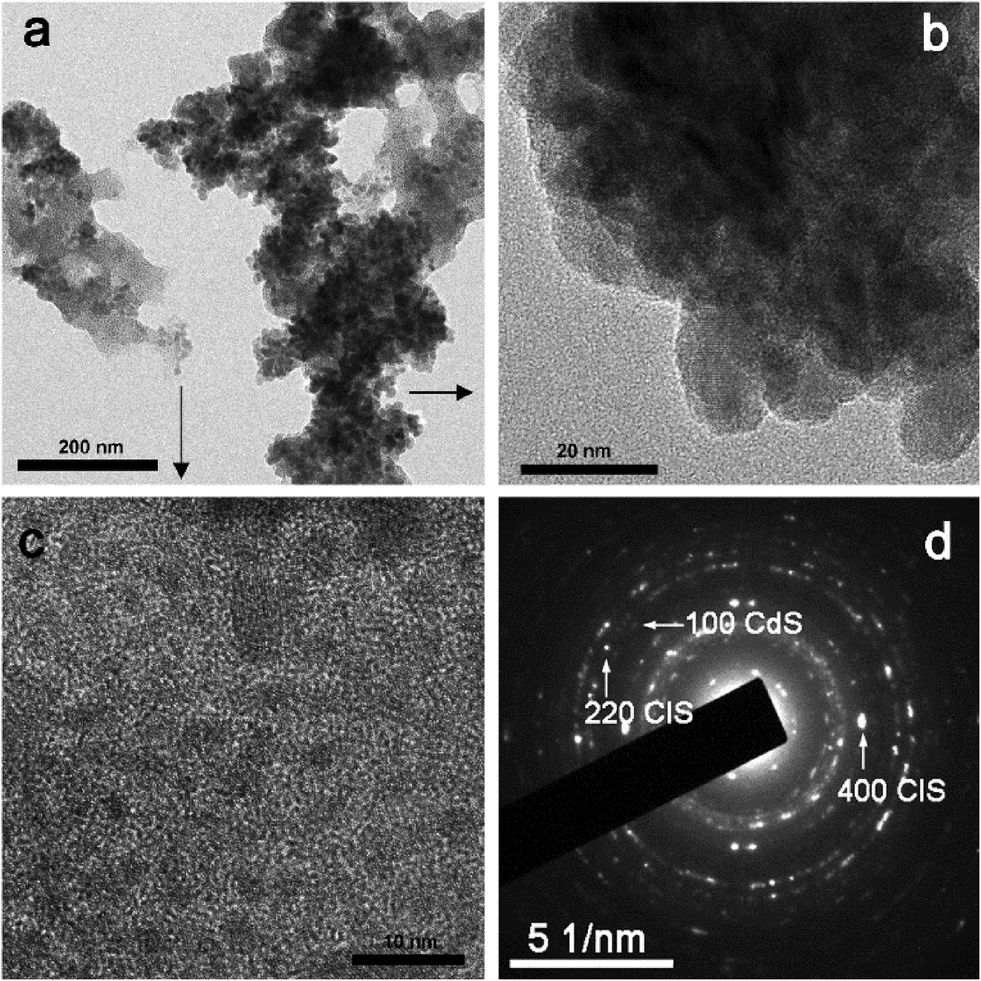 | ||
| Fig. 4 TEM images (a, b, c) of sample C2, synthesized in oleic acid, (d) SAED pattern. | ||
Diffractograms and TEM images of both samples gave us a hint about the growth mechanism of CIS. Since CdS is in both samples, it seems that initially CdS nanoparticles are formed, while later through a cation exchange process Cd ions are partially replaced with In ions, with formation of CIS as the final product. This means that the reaction between the ions needs to be accelerated. One of the ways this can be achieved is to speed up degradation of the metal–oleic acid complex by addition of oleylamine, which, as an organic base, enables faster decomposition of this complex.23 Bearing in mind that OLAM is also a reducing agent and may serve as a weak capping agent, we kept the volume of oleic acid higher than that of OLAM, so the final volume ratio was OA:OLAM = 4:1. In order to track the influence of OLAM addition, the reaction time was varied from 15 min to 1 h. XRD patterns of these samples are presented in Fig. 5 (and Fig. S3 in ESI†).
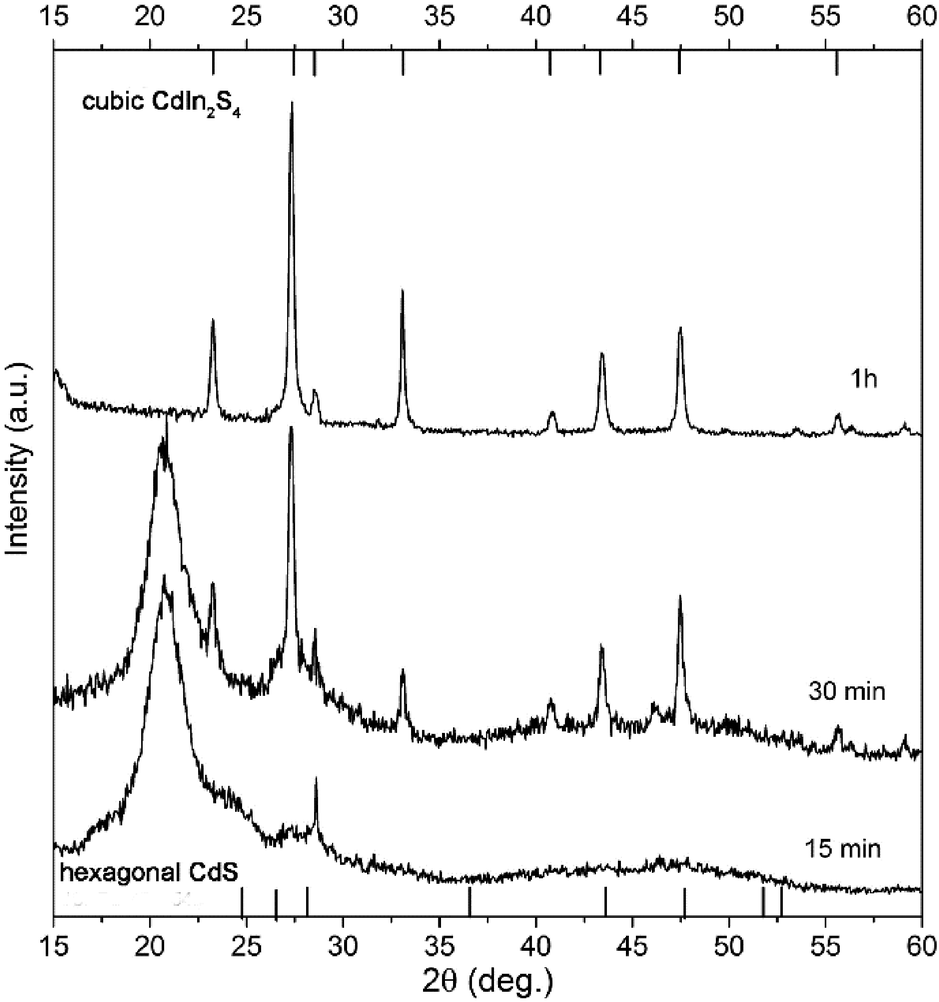 | ||
| Fig. 5 XRD pattern of the sample synthesized with an OA/OLAM ratio of 4/1, taken after 15 min, 30 min and 1 h (C3). | ||
After 15 min, a peak at about 20.8° dominates the diffractogram, which we believe originates from metal–oleic acid complexes. The rest of the diffractogram (from 22–60 deg) indicates the presence of amorphous forms only, with the exception of a sharp peak at 28.6°, which can be attributed to the (222) plane of cubic CIS. After 30 min, there are still some residues from metal–oleates, but the majority of the sample is CIS (due to the peak intensity ratio, as can be seen in Fig. 5). XRD of this sample underlined two major points:
1. Even if OLAM is added, decomposition of metal–oleates and subsequent nucleation is the process that controls the overall kinetics of CIS synthesis.
2. XRD indicates the presence of both metal–oleate complexes and CIS, which means that nucleation and growth are two simultaneous processes under these reaction conditions.
Finally, after 1 h we presumed that the reaction was over, and the peaks from XRD matched to pure cubic CIS, with no detectable presence of binary sulfides or metals. By adding OLAM, when compared to synthesis in pure OA, the reaction time was decreased from 4 h to 1 h, and also a pure CIS phase was synthesized. By applying XFIT on each diffraction peak we have calculated coherent domain sizes for C3 (Table 2). The calculated crystal domain sizes are very similar for all diffractions; the majority of the domains are in the range of 22 to 28 nm, except for the (400) crystal diffraction plane, for which the calculated value is about 40 nm. This difference could be an indication that crystal domains preferentially grow along the (400) direction.
| Diffraction plane | 2θ (deg) exp | 2θ (deg) (JCPDS27-060) | Crystal domain (nm) (calc) |
|---|---|---|---|
| 220 | 23.26 | 23.18 | 28.1 |
| 311 | 27.33 | 27.24 | 26.7 |
| 222 | 28.56 | 28.48 | 28.0 |
| 400 | 33.08 | 33.0 | 39.6 |
| 422 | 40.83 | 40.73 | 22.2 |
| 511 | 43.42 | 43.31 | 24.6 |
| 440 | 47.48 | 47.40 | 26.2 |
TEM images (Fig. 6) reveal that the OA/OLAM combination provides a convenient environment for the formation of complex hierarchical morphologies. From Fig. 6a the presence of small subunits with diameters ranging from 8 to 14 nm is visible, interspaced by organic layers at their surfaces (indicated by the arrows). The existence of organic capping agents on their surfaces facilitates rotation of these subunits, so they can share a common crystal plane, and through an oriented attachment process form bigger structures known as mesocrystals.24–26 Namely, the classical crystallization process can be represented as: ions/atoms/molecules → clusters → nanocrystals → single crystal. On the contrary, non-classical crystallization takes nanocrystals as the primary building blocks. In the next step, nanocrystals orientate in such a manner to share a common crystal plane and attach to each other or merge, forming bigger structures known as mesocrystals.25 If primary nanocrystals have organic molecules attached on their surfaces, this way of growth through fusion of primary subunits will lead to inclusion of organic molecules in the mesocrystal structures and formation of defects. This mode of material growth can lead to the differences in crystal sizes calculated from XRD data and seen from TEM images. Namely, nanocrystalline subunits in mesocrystals are oriented almost perfectly, so the corresponding diffraction pattern will be very similar to that of single crystals.24 However, building subunits can be interspaced by an organic layer, so the existence of these defects make them observable by TEM. This is also a reason why calculated values from XRD data are higher. Anyhow, from Fig. 6b, it is clear that the mesocrystals have diameters ranging from 20 to 30 nm, which is in good agreement with calculated crystal domain sizes.
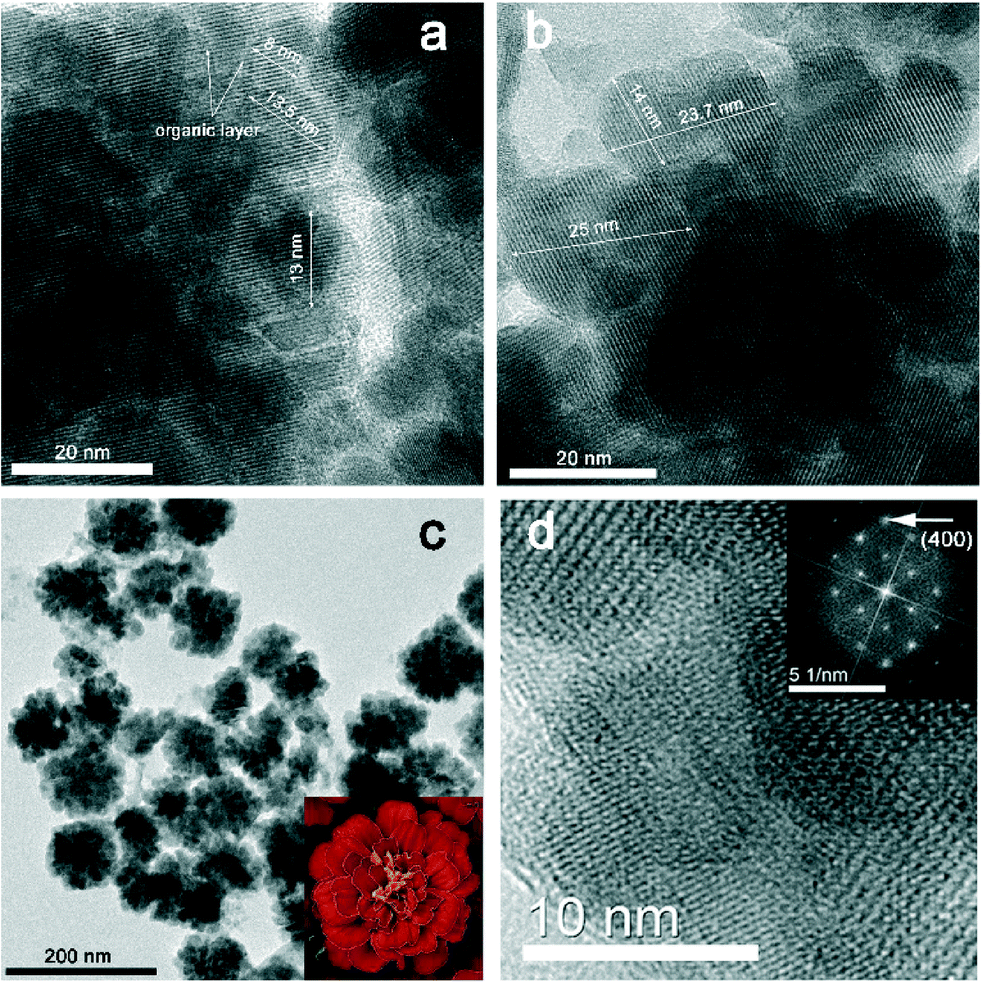 | ||
| Fig. 6 Representative TEM (a, b, c, d) images of sample C3, synthesized in OA/OLAM, and FFT analysis (inset in d). | ||
The obtained mesocrystals are self-organized in marigold-like structures (Fig. 6c) and highly crystalline. The well-ordered crystalline planes are clearly seen all over the marigold-like structures, although individual smaller nanoparticles and subunits can also be seen. Similar marigold-like superstructures can be found in the literature,2,4,5,11,12 but, as far as we know, their growth through mesocrystal arrangement has not been reported until now. Fig. 6d represents one fragment of the marigold-like structures and the matching FFT analysis. The spot indicated by the arrow corresponds to the (400) planes.
In order to evaluate the optical properties of C3, a UV/vis absorption spectrum was recorded, and then presented as a Tauc plot (Fig. 7a). By extrapolation of the linear region of this plot we have estimated that the band-gap energy of this sample is in the visible part of the spectrum and has a value of ~2.1 eV. Besides the value of the band-gap, very important parameters that determine if a material is suitable for water splitting and photocatalytic applications at all, are the relative potentials at which the semiconductor's conduction and valence band edges are suited. For successful application, it is necessary that the edge potential of the conduction band (CB) is situated above the H+/H2 potential, while the valence band (VB) edge potential should be below the oxygen evolution level. The easiest way to calculate these values is by using an empirical equation related to electronegativity27
| ECB,VB = E0 + (χCd + χIn2 + χS4)1/7 ± 1/2Eg |
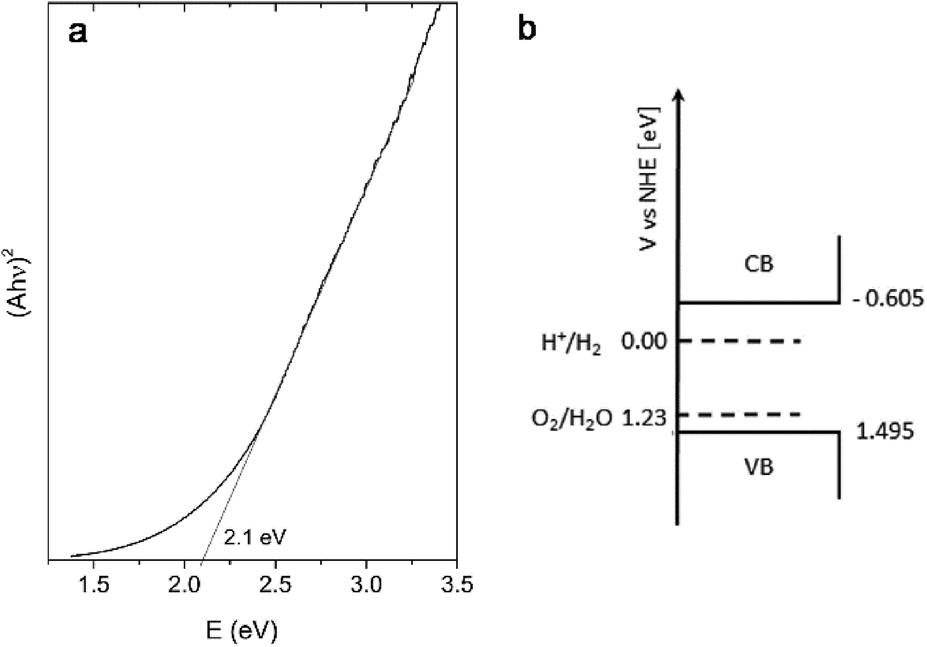 | ||
| Fig. 7 a) Tauc plot of sample C3, b) positions of calculated band edges versus NHE. | ||
According to this equation, the bottom of the conduction band of C3 is situated at −0.605 eV, while the top of the valence band is at 1.495 eV. These calculated potentials are schematically depicted in Fig. 7b. As can be seen, the calculated positions of the band edges are properly positioned versus the H+/H2 and O2/H2O potentials. According to this, the obtained sample could be considered as an appropriate material for water splitting.
However, for most applications one of the requirements is the possibility of working in aqueous media. As the synthesized particles are capped with a combination of organic OA/OLAM molecules, it was necessary to exchange these surface ligands with a hydrophilic molecule. For this purpose we chose 2-mercaptoethanol (2ME, HS–C2H4–OH) since it has a mercapto (–SH) group which enables easy bonding to cations on a CIS particle’s surface, and a hydrophilic hydroxyl (–OH) group. Adjacent absorption spectra of sample C3 capped with OA/OLAM and capped with 2ME are presented in Fig. 8a. Upon surface ligand exchange, the main optical characteristics were preserved, but it is also interesting to notice that for the 2ME capped sample in the long wavelength region there was less light scattering; a sign that particles/agglomerates were better dispersed. Actually, from the TEM images (Fig. 8b and c, Fig. S5 and S6 in ESI†) it is clear that while the crystallinity (inset) and size of the mesocrystalline agglomerates are preserved, the structures are less compacted. Such dispersions stayed stable for a few months without any precipitation even if they were kept at room temperature, not protected from light, which is an advantage for this method of organic/water transfer. Here, it should be stressed that mesocrystals could be considered as “nanoparticles that are glued together by an inorganic or organic linker”.26 If the nature of the “glue” is changed, it could be expected that the properties of the mesocrystals will change. The properties of mesocrystals are usually inherited from the nanoparticles they are built from, but if fusion between these primary building blocks is achieved, the newly-formed mesocrystals could have some new and enhanced characteristics (specific surface area, porosity, photocatalytic activity, etc.). Anyhow, whether mesocrystals are considered for applications in photocatalysis, solar energy conversion or optoelectronics, they need to be well characterized, and compared with their nanocrystalline and single-crystal counterparts.24–26
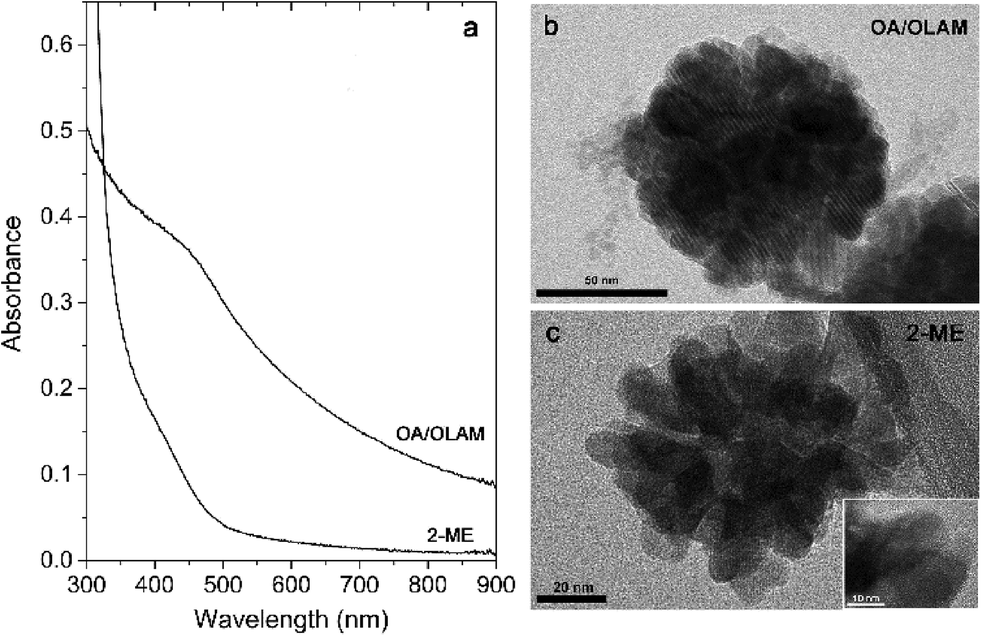 | ||
| Fig. 8 a) Adjacent UV/vis spectra of sample C3 capped with OA/OLAM dispersed in toluene and 2ME dispersed in water; b) TEM image of “marigold” capped with OA/OLAM; c) TEM image of “marigold” capped with 2ME. Inset: enlarged fragment of “marigold” capped with 2ME. | ||
ZnIn2S4
In order to check if it is possible to use the same general method of synthesis for the other three-component semiconductors, we have chosen to synthesize ZIS, another semiconductor from the II–III2–VI4 family. As Bae et al.28 suggested, Cd2+ has a weaker binding energy with oleic acid than Zn2+, hence the same principle of OLAM usage was tried for the synthesis of ZnIn2S4. Considering this difference between strengths of metal–oleate bonds, the volume of OLAM was increased, so the final ratio was OA:OLAM = 2:1. The reaction was stopped after 30 min, in order to see the early stages of nucleation and growth, and to characterize the system in an intermediate state. The XRD pattern of this sample (Z1) (Fig. 9 and S7 in ESI†) revealed a presence of both hexagonal ZIS (JCPDS No. 065-2023) and rhombohedral ZnS (JCPDS No. 089-2181). Peaks of these two phases are at very similar 2θ values, so it was not possible to calculate crystallite sizes. The only feature that unmistakably distinguishes ZIS from ZnS is a peak at 21.6°, which corresponds to diffraction from the (006) crystal plane. Again, the existence of both binary and ternary sulfides leads us to conclude that the ZIS grows through a Zn2+/In3+ cation exchange process.
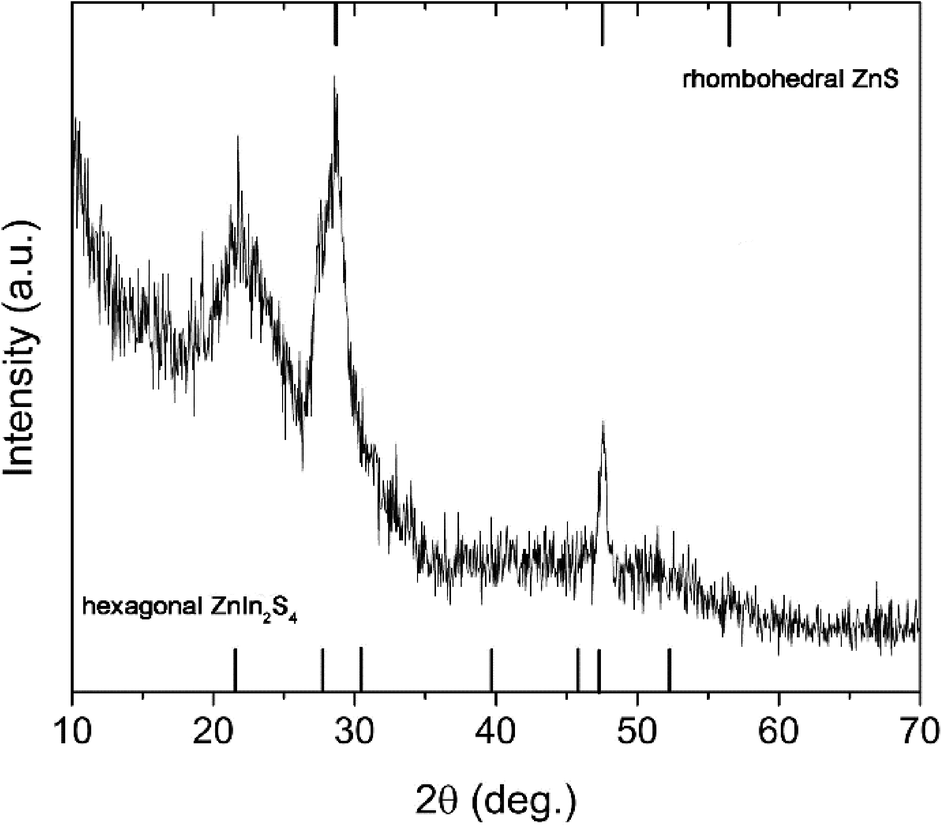 | ||
| Fig. 9 XRD pattern of sample Z1 synthesized in OA/OLAM = 2/1. | ||
The morphology of Z1 was examined by TEM (Fig. 10). The images revealed the presence of small round particles, with diameters of about 3 nm (Fig. 10a and b), but also thin flakes with diameters of about 25 nm (Fig. 10a). Hexagonal ZnIn2S4 has a lamellar crystal structure13,29 so formation of such layered structures or flakes is not unexpected. In their article from 2006, Gou et al.6 have shown that reaction temperature and time are the main factors that influence whether these layers will fold into tubes or not. In their synthesis, for temperatures higher than 180 °C, lamellar structures start to fold at the edges and if the sample was kept at elevated temperature for sufficient time, the resulting morphology can be tubular.
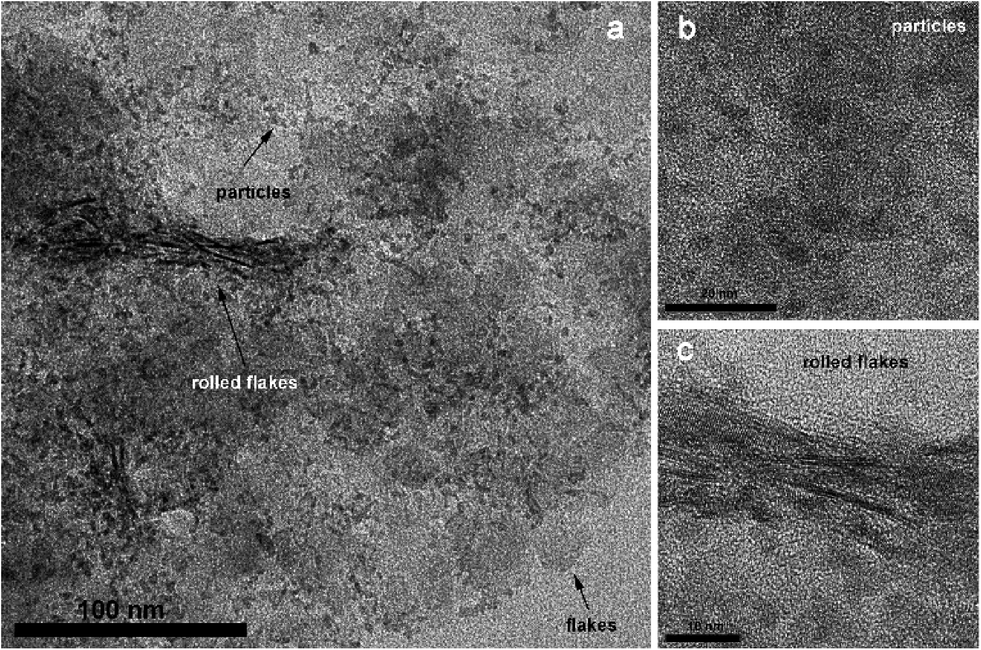 | ||
| Fig. 10 TEM (a, b, c) images of sample Z1 synthesized in OA/OLAM = 2/1. | ||
Our samples also showed the beginning of tube formation (Fig. 10a and c). The length of the tubular structures matches well with the flake diameters. However, we believe that the reaction time of 30 min was not sufficient for completion of folding and formation of tubular structure. A possible explanation could be that ZnS nucleation/Zn2+/In3+ cation exchange/flake rolling are simultaneous processes. Anyhow, additional detailed experiments must be conducted in order to be sure that our synthetic procedure can finally lead to tubular ZnIn2S4.
Conclusions
A hot-injection method for the synthesis of CIS is presented. The influences of different organic reaction media on CIS formation are followed and explained, and it was found that for the given experimental conditions pure CIS can be synthesized only with a combination of OA and OLAM. It is proposed that CIS grows from binary CdS through a Cd/In cation exchange process. Synthesized particles of about 25 nm in diameter are self-organized in marigold-like mesocrystal structures. By using an empirical equation we have calculated the positions of the conduction (−0.605 V) and valence band (1.495 V) edges of synthesized CIS. According to these calculated values, the synthesized material could be considered as an appropriate material for water splitting.Furthermore, we have proposed an easy way to transfer CIS from the organic phase to aqueous media, by using 2ME. Upon transfer, all the main characteristics of the material are preserved, but also better stability of the obtained dispersion is achieved. Mainly, the mesocrystalline structure of the marigold agglomerates is preserved, making applications of these materials demanding an aqueous medium feasible.
Additionally, initial experiments in the synthesis of ZIS by using the OA/OLAM combination are presented. Mixed binary/ternary sulfides are obtained. Ternary sulfides grow in the form of flakes, that over time probably start to roll, forming tubes. Future work will be directed towards the synthesis of pure ZIS, as well as clarifying its nucleation, growth and tube formation mechanisms.
Acknowledgements
Financial support for this study was granted by the Ministry of Education and Science of the Republic of Serbia (Projects: III45020 and OI172056) and COST actions CM1101 and MP1106.Notes and references
- W. Shangguan and A. Yoshida, J. Phys. Chem. B, 2002, 106, 12227 CrossRef CAS.
- B. B. Kale, J.-O. Baeg and S. M. Lee, Adv. Funct. Mater., 2006, 16, 1349 CrossRef CAS PubMed.
- L. Fan and R. Guo, J. Phys. Chem. C, 2008, 112, 17000 Search PubMed.
- W. Jiang, X. Yin, F. Xin, Y. Bi, Y. Liu and X. Li, Appl. Surf. Sci., 2014, 288, 138 CrossRef CAS PubMed.
- A. Bhirud, N. Chaudhari, L. Nikam, R. Sonawane, K. Patil, J.-O. Baeg and B. Kale, Int. J. Hydrogen Energy, 2011, 36, 11628 CrossRef CAS PubMed.
- X. Gou, F. Cheng, Y. Shi, L. Zhang, S. Peng, J. Chen and P. Shen, J. Am. Chem. Soc., 2006, 128, 7222 CrossRef CAS PubMed.
- J. Zhou, G. Tian, Y. Chen, X. Meng, Y. Shi, X. Cao, K. Pan and H. Fu, Chem. Commun., 2013, 49, 2237 RSC.
- S. N. Baek, T. S. Jeong, C. J. Youn, K. J. Hong, J. S. Park, D. C. Shin and Y. T. Yoo, J. Cryst. Growth, 2004, 262, 259 CrossRef CAS PubMed.
- L. Ye, J. Fu, Z. Xu, R. Yuan and Z. Li, ACS Appl. Mater. Interfaces, 2014, 6, 3483 CAS.
- X. Hu, J. C. Yu, J. Gong and Q. Li, Cryst. Growth Des., 2007, 7(12), 2444 CAS.
- S. K. Apte, S. N. Garaje, R. D. Bolade, J. D. Ambekar, M. V. Kulkarni, S. D. Naik, S. W. Gosavi, J.-O. Baeg and B. B. Kale, J. Mater. Chem., 2010, 20, 6095 RSC.
- W. Wang, T. W. Ng, W. K. Ho, J. Huang, S. Liang, T. An, G. Li, J. C. Yu and P. K. Wong, Appl. Catal., B, 2013, 129, 482 CrossRef CAS PubMed.
- L. Shang, C. Zhou, T. Bian, H. Yu, L.-Z. Wu, C.-H. Tung and T. Zhang, J. Mater. Chem. A, 2013, 1, 4552 CAS.
- S. Peng, L. Li, Y. Wu, L. Ji, L. Tian, M. Srinivasan, S. Ramakrishna, Q. Yan and S. G. Mhaisalkar, CrystEngComm, 2013, 15, 1922 RSC.
- S. Peng, S. G. Mhaisalkara and S. Ramakrishna, Mater. Lett., 2012, 79, 216 CrossRef CAS PubMed.
- J. Feng, H. Zhu, X. Wang and X. Yang, Chem. Commun., 2012, 48, 5452 RSC.
- C. B. Murray, D. J. Norris and M. G. Bawendi, J. Am. Chem. Soc., 1993, 115, 8706 CrossRef CAS.
- N. D. Abazović, M. I. Čomor, M. N. Mitrić, E. Piscopiello, T. Radetić, I. A. Janković and J. M. Nedeljković, J. Nanopart. Res., 2012, 14, 810 CrossRef.
- M. V. Beloš, N. D. Abazović, J. Kuljanin Jakovljević, I. Janković, S. P. Ahrenkiel, M. Mitrić and M. I. Čomor, J. Nanopart. Res., 2013, 15, 2148 CrossRef.
- W. W. Yu and X. Peng, Angew. Chem., Int. Ed., 2002, 41, 2368 CrossRef CAS.
- D. Battaglia and X. Peng, Nano Lett., 2002, 2, 1027 CrossRef CAS.
- R. W. Cheary and A. A. Coelho, J. Appl. Crystallogr., 1992, 25, 109 CrossRef CAS.
- N. Bao, X. Qiu, Y.-H. A. Wang, Z. Zhou, X. Lu, C. A. Grimes and A. Gupta, Chem. Commun., 2011, 47, 9441 RSC.
- H. Cölfen and M. Antonietti, Angew. Chem., Int. Ed., 2005, 44, 5576 CrossRef PubMed.
- Y. Liu, Y. Zhang and J. Wang, CrystEngComm, 2014, 16, 5948 RSC.
- L. Zhou and P. O'Brien, J. Phys. Chem. Lett., 2012, 3, 620 CrossRef CAS PubMed.
- Y. Xu and M. A. A. Schoonen, Am. Mineral., 2000, 85, 543 CrossRef CAS.
- W. K. Bae, M. K. Nam, K. Char and S. Lee, Chem. Mater., 2008, 20, 5307 CrossRef CAS.
- L. Shi, P. Yin and Y. Dai, Langmuir, 2013, 29, 12818 CrossRef CAS PubMed.
Footnote |
| † Electronic supplementary information (ESI) available: Table S1. Molarities of precursor solutions; XRD patterns of synthesized samples together with corresponding JCPDS cards and relative intensities of related diffraction peaks; Tauc plots of samples C2; additional TEM images of sample C3 (CdIn2S4) before and after surface ligand exchange. See DOI: 10.1039/c5ce01432h |
| This journal is © The Royal Society of Chemistry 2015 |