 Open Access Article
Creative Commons Attribution 3.0 Unported Licence
Systematic solvate screening of trospium chloride: discovering hydrates of a long-established pharmaceutical†
V.
Sládková
*a,
T.
Skalická
a,
E.
Skořepová
a,
J.
Čejka
a,
V.
Eigner
ab and
B.
Kratochvíl
a
aDepartment of Solid State Chemistry, University of Chemistry and Technology, Prague, Technicka 5, 16628, Prague 6, Czech Republic. E-mail: Veronika.Sladkova@vscht.cz
bInstitute of Physics AS CR, v.v.i., Na Slovance 2, 18221, Prague 8, Czech Republic
First published on 25th May 2015
Abstract
The ability of the antispasmodic agent trospium chloride (TCl) to form solvates was investigated by applying conventional solvate screening methods on 20 solvents. According to the solubility of TCl, different approaches were considered (slow evaporation, slurrying and anti-solvent addition). Five solvates, with the solvents methanol, acetonitrile, propionitrile, N,N-dimethylformamide, nitromethane and dihydrate, were identified and characterized by various analytical techniques. Moreover, a solvate with isopropyl alcohol and TCl sesquihydrate was prepared circumstantially outside the systematic screening. The structures of all the solvates were determined by single crystal X-ray diffraction. The reproducible forms were further characterized by powder X-ray diffraction and desolvation behaviour was observed by thermoanalytical (TGA/DSC) methods. Structural features of novel solvates and of previously described polymorphs and cocrystals of TCl were compared, presented by a tree diagram which classifies the structures according to their molecular packing.
Introduction
Polymorph screening, which inherently includes solvate screening, is nowadays a necessary step taken from the early development stages of an API (active pharmaceutical ingredient). It is also often supplemented for long-known APIs already established on the market, as new forms might provide unexpected advantageous properties or explain unanswered problems which arise during production, transfer, generic development or reformulation to a new drug with the combination of more APIs.The precipitation of a new solid form also presents a risk which could endanger a robust production of an API1 and might appear even if minor changes in the technology are installed, an appearing polymorph of ritonavir representing a very challenging scenario.2
Creative methods applied for polymorph and solvate screens are being introduced,3 but basically the solvent-based techniques used in the solid form screening narrow down to solvent evaporation,4 anti-solvent addition5 and slurrying.6,7 The possibility of the preparation of various polymorphs can be also investigated/controlled via desolvation of the solvate as was reported in the case of furosemide,8 sulfamerazine9 or spironolactone10 polymorphs.
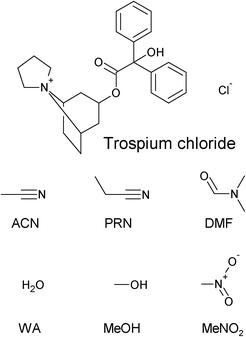
One of the long-established pharmaceutical substances which lacks thorough solid state screening is trospium chloride. Trospium chloride (TCl, Fig. 1), a muscarinic antispasmodic drug used for the treatment of an over-active bladder, exhibits high solubility in water and other polar solvents (ethanol, methanol) and is insoluble in nonpolar solvents. Recently, the structural characterization of new cocrystals, as well as the polymorphs of TCl, has been reported.11,12 An ethanol solvate has been reported as well.11
The motivation of this study was to further investigate its propensity to include small molecules within the crystal structure, thus forming solvates, as trospium chloride seems to be a very accommodating molecule providing a whole range of different phases.
We proposed a conventional solvate screening investigating the solvatomorphism of TCl, using the three most common techniques: slurrying, slow evaporation and anti-solvent addition on 20 solvents. The chosen solvents belong to classes 2 (“solvents to be limited”) and 3 (“solvents with low toxic potential”) according to the Q3C guideline classification13 and have a polar protic or polar aprotic character. We questioned the possible relation between TCl solubility in the solvents and its propensity to form solvates with them; are there any limits restricting the solvate formation?
Experimental
Materials
Trospium chloride was kindly provided by the Interpharma Praha, a.s. company (Prague, Czech Republic) as form I and was used without further purification. Solvents were purchased from various suppliers and were used as received. Due to the hygroscopicity of some of the used solvents, only freshly opened bottles of solvents were used for solubility measurements, to assure the declared water content.Systematic screening
TCl (20 mg) was placed in a glass vial and solvent was gradually added until TCl dissolved or until 5 mL of solvent was added. The suspensions with TCl as an undissolved powder were treated as slurry screening samples. When TCl dissolved in less than 5 mL of solvent, the solutions were transferred to 50 mL round-bottomed flasks and left at ambient temperature until crystalline material was formed. The approximate solubility of TCl at room temperature was determined. All slurry experiment solvents (where the estimated solubility was around or below 4 mg per mL) were selected as being suitable for anti-solvent addition experiments.Slow evaporation (SE)
In the slow evaporation experiments, the solutions of TCl (20 mg) in cyclohexanol, 1-butanol (nBuOH), ethanol (EtOH), isobutyl alcohol (iBuOH), methanol (MeOH), 2-methoxyethanol, N-methylpyrrolidone, 1-propanol (nPrOH) and water (WA) were placed in 50 mL round-bottomed flasks and left open at ambient temperature until crystalline material was formed.Slurrying (Sl)
Slurries of TCl (20 mg) in acetone, acetonitrile (ACN), N,N-dimethylformamide (DMF), ethyl acetate (EtAc), isopropyl alcohol (iPrOH), methyl acetate (MeAc), methyl ethyl ketone (MEK), nitromethane (MeNO2), 1-octanol, propionitrile (PRN), tetrahydrofuran (THF) and water (WA) in glass vials with caps and parafilm were placed in an orbital shaker (IKA MS 3 digital, 500 rpm) for 48 hours at ambient temperature, then filtered and analyzed.Anti-solvent addition (AS)
The saturated solution of TCl in water (25 μL) was pipetted into a vial with 1 ml of solvent in which the solubility of TCl was below 4 mg per mL.Solubility measurement
A more precise determination of the solubility of TCl in solvents in which it forms solvates was measured by UV-vis spectrophotometry and by gravimetry.UV-vis spectrophotometry
Using a solution of a known concentration of TCl, the absorbance of the sample was measured on a UV-visible spectrophotometer and an appropriate wavelength for calibration was determined for each solvent. Linear calibration curves were obtained from the measurements of 5 calibration samples (prepared by dilution of a solution of known concentration) with absorbance in the range of 0.3–0.9. Saturated solutions were diluted to fall in the range of the linear calibration and concentrations of the saturated solutions were calculated.Gravimetry
The saturated solutions of TCl were prepared, 3 mL were pipetted in weighed round-bottomed flasks and the solvents were removed by a rotary vacuum evaporator. The solid precipitates in the flasks were further dried in the oven (24 h, at 50 °C) and the flasks were reweighed. The solid precipitates were then analyzed by PXRD, confirming the presence of anhydrous TCl (form I). The procedure was repeated 3 times, and an average value of solubility is presented.Analytical techniques
A measuring program was used: the sample was measured by one cycle of 0% relative humidity to 90% relative humidity (adsorption) and then of 90% relative humidity to 0% relative humidity (desorption). A measuring gas of 4.0 nitrogen flow of 200 sccm was used.
| Compound | ACN (1) | DMF (2) | iPrOH (3) | MeOH (4) | MeNO2 (5) | PRN (6) | sesHyd (7) | diHyd (8) |
|---|---|---|---|---|---|---|---|---|
| Empirical formula | C25H30NO3·C2H3N·Cl | C25H30NO3·C3H7NO·Cl | C25H30NO3·C3H8O·Cl | C25H30NO3·CH4O·Cl | C25H30NO3·CH3NO2·Cl | C25H30NO3·C3H5N·Cl | 2(C25H30NO3)·2(Cl)·3(H2O) | C25H30NO3·Cl·2(H2O) |
| Formula wt. | 469.0 | 501.1 | 488.1 | 460.0 | 489.0 | 483.1 | 910.0 | 464.0 |
| Crystal system | Monoclinic | Monoclinic | Monoclinic | Monoclinic | Monoclinic | Monoclinic | Monoclinic | Monoclinic |
| Space group | P21/n | P21/n | P21/n | P21/n | P21/n | P21/n | P21/c | P21/c |
| a (Å) | 14.9067(4) | 15.1865(6) | 9.9394(6) | 13.654(2) | 9.9289(3) | 15.1562(7) | 39.7859(5) | 19.1988(7) |
| b (Å) | 9.4670(3) | 9.6504(3) | 9.3964(8) | 9.7390(14) | 9.4290(3) | 9.5360(3) | 6.95750(10) | 13.1107(3) |
| c (Å) | 18.6466(5) | 19.3822(6) | 28.5819(17) | 18.621(2) | 26.8357(10) | 18.8677(8) | 17.1898(4) | 9.5387(3) |
| β (°) | 108.471(2) | 112.605(3) | 98.318(5) | 106.609(12) | 97.556(3) | 109.782(4) | 100.0985(14) | 98.175(3) |
| V (Å3) | 2495.88(13) | 2622.35(17) | 2641.3(3) | 2372.8(6) | 2490.53(14) | 2566.02(19) | 4684.60(14) | 2376.59(13) |
| Z | 4 | 4 | 4 | 4 | 4 | 4 | 4 | 4 |
| T (K) | 180 | 180 | 180 | 150 | 180 | 150 | 180 | 120 |
| ρ calc (g cm−3) | 1.248 | 1.269 | 1.227 | 1.287 | 1.304 | 1.250 | 1.290 | 1.297 |
| μ (mm−1) | 1.59 | 1.58 | 1.54 | 1.68 | 1.68 | 1.57 | 1.72 | 1.71 |
| F(000) | 1000 | 1072 | 1048 | 984 | 1040 | 1032 | 1944 | 992 |
| Reflns. collected | 35![[thin space (1/6-em)]](https://www.rsc.org/images/entities/char_2009.gif) 012 012 |
11![[thin space (1/6-em)]](https://www.rsc.org/images/entities/char_2009.gif) 578 578 |
24![[thin space (1/6-em)]](https://www.rsc.org/images/entities/char_2009.gif) 465 465 |
13![[thin space (1/6-em)]](https://www.rsc.org/images/entities/char_2009.gif) 045 045 |
16![[thin space (1/6-em)]](https://www.rsc.org/images/entities/char_2009.gif) 871 871 |
24![[thin space (1/6-em)]](https://www.rsc.org/images/entities/char_2009.gif) 850 850 |
98![[thin space (1/6-em)]](https://www.rsc.org/images/entities/char_2009.gif) 885 885 |
9602 |
| Indep. reflns. (Rint) | 5017 (0.042) | 5307 (0.029) | 5573 (0.043) | 4800 (0.034) | 5114 (0.046) | 5239 (0.032) | 9845 (0.061) | 4145 (0.024) |
| GOF | 1.86 | 1.59 | 1.53 | 1.80 | 1.82 | 1.83 | 1.91 | 1.56 |
| R 1, wR2 [I > 3 σ(I)] | 0.045, 0.119 | 0.038, 0.101 | 0.045, 0.116 | 0.047, 0.120 | 0.051, 0.131 | 0.042, 0.111 | 0.046, 0.120 | 0.036, 0.096 |
| R 1, wR2 (all data) | 0.056, 0.125 | 0.043, 0.105 | 0.058, 0.125 | 0.055, 0.126 | 0.059, 0.137 | 0.049, 0.116 | 0.051, 0.125 | 0.041, 0.099 |
| Res. el. dens. (e Å−3) | 0.40, −0.29 | 0.19, −0.18 | 0.24, −0.17 | 0.22, −0.25 | 0.38, −0.27 | 0.24, −0.27 | 0.42, −0.37 | 0.26, −0.17 |
| CCDC number | 1056149 | 1056150 | 1056151 | 1056152 | 1056153 | 1056154 | 1056155 | 1056156 |
Results and discussion
Screening results
We carried out a conventional solvate screening investigating the solvatomorphism of TCl. All the screening samples with a crystalline material were analyzed by PXRD and their diffraction patterns were compared with the diffraction patterns of pure trospium chloride form I.A total of 8 new crystal structures are reported, 6 of which were obtained repeatedly. All the obtained crystalline phases were analyzed by PXRD or SXRD. The solid state purity was confirmed by Rietveld refinement (see ESI†); the single crystal structure was successfully fitted to an experimental powder diffraction pattern.
In the systematic screening, the material consumption was taken into account during making the choice of the applied screening method. Where the solubility of TCl in the solvent was low, slurrying (Sl) and anti-solvent addition (AS) were applied. Due to the higher solubility of TCl in most protic solvents and, therefore, due to the increased material consumption needed for slurrying, only the slow evaporation (SE) method was applied in some protic solvents.
The slurries gave solvates with ACN (1), DMF (2), MeNO2 (5) and PRN (6) at single crystal quality for structure determination.
For anti-solvent addition (AS) experiments, the saturated solution of TCl in water was prepared, which was added into solvents where TCl had a low solubility. Solvates with ACN (1) and PRN (6) were thus prepared. When the solution was added into MEK, 1-octanol and EtAc, the dihydrate (8) was formed. In MeNO2 three phases were prepared: solvate (5), diHyd (8) and anhydrous TCl (form I). In the other solvents anhydrous TCl form I was prepared. Thus, the method shown was more efficient for the dihydrate (8) preparation rather than for the preparation of the solvates, also the DMF solvate was not prepared by AS. Single crystals of diHyd (8) were also collected at the bottom of the vial with a saturated solution in water (slurry).
By slow evaporation, the solvate with MeOH (4) was prepared. Its single crystals for SXRD structure determination were obtained from repeated experiments.
Two more structures are presented in the paper, which were prepared serendipitously. The single crystal of sesquihydrate (7) was found during cocrystal screening experiments (but its structure was not included in the paper).21 The single crystal of the iPrOH solvate (3) was discovered in the mixture with pure TCl recrystallized from iPrOH and the solvate has not been recollected since.9 All the repeated experiments to obtain sesquihydrate (7), isopropyl alcohol solvate (3) and the previously published ethanol solvate, led to the formation of anhydrous TCl form I.
Hydrate appearance
Interestingly, no hydrate form was prepared during any preceding crystallization experiments. The hydrate appearance during our systematic screening was therefore unexpected. This pseudopolymorph, appearing more than 50 years after the discovery of the parent compound, could be reproduced easily in the slurry and presented opportunities for a new drug formulation.To characterize it, we performed the dynamic vapour sorption experiment of both TCl form I and of TCl dihydrate (8). While the anhydrous TCl was not hygroscopic, diHyd (8) absorbed more than 13 wt% at 90% RH and its crystals visibly dissolved. The absorption curve of TCl form I showed no indication of the sesqui- or di-hydrate formation.
Solubility of TCl
We questioned the possible relation between TCl solubility in the solvents and its propensity to form solvates with them.To observe any relation between the solubility of TCl in the solvent and the solvate formation, the solubilities of TCl in the solvents, with which it forms solvates, were determined by gravimetry or UV-vis spectrophotometry. From the solubilities estimated during the screening, the formation of some solvates seemed improbable.
We were unable to determine the precise solubility of TCl in iPrOH, as no wavelength maxima were observed in the range of 200–700 nm. The measurement by gravimetry was not suitable, as solubility was lower than 1 mg per 100 mL of iPrOH from a freshly opened bottle. The occurrence of an iPrOH solvate (3) seemed therefore to be an unexpected anomaly.
The solubility of TCl in MeOH and MeNO2 was also not determined by UV-vis spectrophotometry due to the lack of suitable wavelength maxima, but gravimetry was successfully applied. The results are shown in Table 2.
| Solvent | Abbreviation | Class (ICH) | Polar P/A | Approx. solubility (mg mL−1) | Precise solubility (mg mL−1) | Applied screening method |
|---|---|---|---|---|---|---|
| a Index indicates solubility determination via UV-vis spectrophotometry. b Index indicates solubility determination via gravimetry. AS: anti-solvent addition, Sl: slurry, SE: slow evaporation. c The slurries of TCl in MeOH and WA were prepared even though slow evaporation as the main screening technique was applied. The slurry in MeOH was prepared for gravimetry, and the slurry in WA was prepared to be used during anti-solvent experiments. For the precise UV-vis solubility measurements, the standard deviation was calculated from 3 repeated measurements in WA, ACN and DMF; the %RSD (q0.95) was below 5%. It was assumed that the RSD for PRN was comparable, since the identical measurement methodology was followed. | ||||||
| N,N-Dimethylformamide | DMF | 2 | Aprotic | <4 | 1.85a | AS, Sl |
| Isopropyl alcohol | iPrOH | 3 | Protic | <4 | <0.01 | AS, Sl |
| Methanol | MeOH | 2 | Protic | >100 | 159.7b | SE, Slc |
| Nitromethane | MeNO2 | 2 | Protic | <4 | 0.82b | AS, Sl |
| Propionitrile | PRN | — | Aprotic | <4 | 0.17a | AS, Sl |
| Water | WA (Hyd) | — | Protic | >500 | 606a | SE, Slc |
| Acetone | 3 | Aprotic | <4 | — | AS, Sl | |
| 1-Butanol | nBuOH | 3 | Protic | 19 | — | SE |
| Cyclohexanol | — | Protic | 6 | — | SE | |
| Ethanol | EtOH | 3 | Protic | >30 | — | SE |
| Ethyl acetate | EtAc | 3 | Aprotic | <4 | — | AS, Sl |
| Isobutyl alcohol | iBuOH | 3 | Protic | 5 | — | SE |
| Methyl acetate | MeAc | 3 | Aprotic | <4 | — | AS, Sl |
| Methylethyl ketone | MEK | 3 | Aprotic | <4 | — | AS, Sl |
| 2-Methoxyethanol | 2 | Protic | 30 | — | SE | |
| 1-Octanol | — | Protic | <4 | — | AS, Sl | |
| 1-Pentanol | 3 | Protic | 10 | — | SE | |
| 1-Propanol | nPrOH | 3 | Protic | 20 | — | SE |
| Tetrahydrofuran | THF | 2 | Aprotic | <4 | — | AS, Sl |
Structural comparison
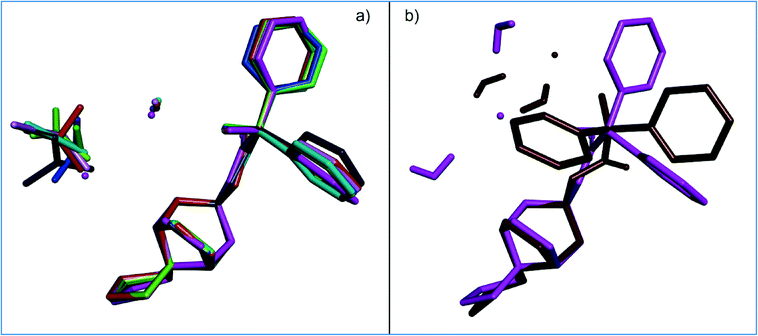
The crystal structures containing TCl were compared in several ways. For the newly solved TCl, the conformations of the trospium molecules as well as the positions of the chloride anions and solvent molecules were compared. The comparison of basic crystallographic parameters, molecular packing and crystal habitus were done for the novel structures together with the crystal structures of TCl described previously.In Fig. 2, the 8 newly solved TCl solvates are compared with regard to the trospium conformation as well as the positions of the chloride anion and solvent molecule. In all those aspects, seven structures are very similar to each other (Fig. 2a). The only conformationally different structure is TCl diHyd (8) (Fig. 2b). The torsion of the ester chain is different and results in a significant change in the position of the phenyl rings.
Also, TCl dihydrate (8) is the only structure where the (trospium OH)⋯(Cl−) H-bond is not present. For protic solvates, where the solvent has an H-bond donor (e.g., alcohols), the H-bonding extends to the solvent molecule: (trospium OH)⋯(Cl−)⋯(solvent OH). In diHyd (8), the order is reversed and the trospium hydroxyl is H-bonded to one of the water molecules, which then forms an H-bond to the chloride anion.
All solvates have the ratio of 1![[thin space (1/6-em)]](https://www.rsc.org/images/entities/char_2009.gif) :
:![[thin space (1/6-em)]](https://www.rsc.org/images/entities/char_2009.gif) 1, except for the hydrates (2
1, except for the hydrates (2![[thin space (1/6-em)]](https://www.rsc.org/images/entities/char_2009.gif) :
:![[thin space (1/6-em)]](https://www.rsc.org/images/entities/char_2009.gif) 3 and 1
3 and 1![[thin space (1/6-em)]](https://www.rsc.org/images/entities/char_2009.gif) :
:![[thin space (1/6-em)]](https://www.rsc.org/images/entities/char_2009.gif) 2).
2).
The following structural comparisons were done with 8 new solvates together with all of the previously published crystal structures of TCl. Those include two polymorphs of pure TCl (form I, TCl-I and form II, TCl-II), the EtOH solvate and five cocrystals with salicylic acid (Sal), adipic acid (Adip), glutaric acid (Glut), oxalic acid (Oxal) and urea. That makes 16 structures containing TCl in total.
The next comparison is a tree diagram (Fig. 3) based on the results from the Crystal Packing Similarity tool in the Materials module of Mercury. The diagram is used for a clear analysis of similarity in the crystal packing of structures of one compound. It can compare the crystal packing of only the largest molecule in the structure (in our case the trospium cation). Therefore, it can be easily used to analyse a family of polymorphs, hydrates, solvates, salts and cocrystals.
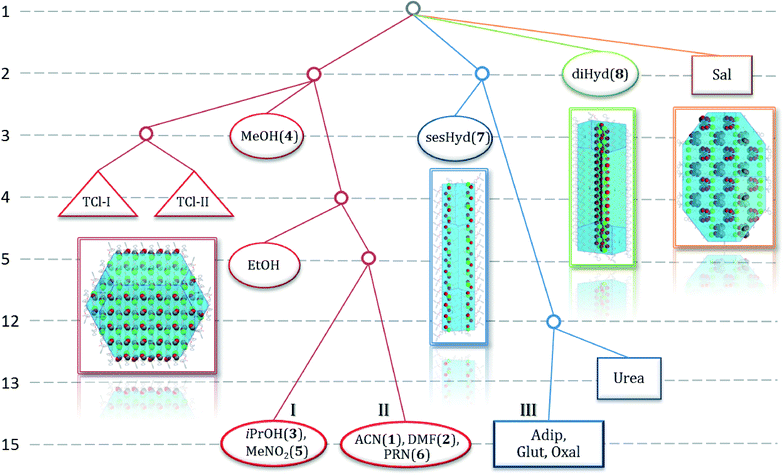 | ||
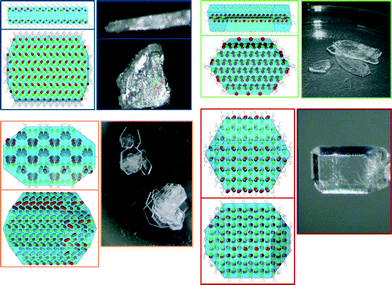
| Fig. 3 A tree diagram based on the results from the Crystal Packing Similarity tool in the Materials module of Mercury.19 All 16 known crystal structures containing TCl are compared. Pure polymorphs are marked as triangles, cocrystals as rectangles and solvates as ovals. Structures grouped on the bottom row (I, II and III) indicate that 15 out of 15 trospium molecules in a cluster are similar and these are considered to be isostructural. The calculated crystal shape and packing for each of the four branches is indicated. For the very left and very right branches, the crystal shape is a prism (TCl MeOH solvate (4), TCl salicylic acid cocrystal). For the two middle branches, it is a plate (side view; TCl sesquihydrate (7), TCl dihydrate (8)) | ||
A tree diagram is constructed in several steps. For detailed instructions for the diagram construction, see ref. 22. Every row represents a separate calculation. For every level, a cluster of molecules is calculated for all structures. The size of the cluster (number of molecules) corresponds to the row number, i.e., 1 to 15. Then, all clusters are overlaid over each other in pairs and it is considered whether all molecules fit within a pre-set error. We used a 20% margin for both position and the torsion angles. The larger the calculated cluster, the more the structures must be similar for all the molecules to fit. This results in branching and the formations of a tree diagram. Structures grouped (e.g., iPrOH (3), MeNO2 (5)) on the bottom row indicate that 15 out of 15 trospium molecules in a cluster are similar and these are considered to be isostructural (Fig. 7 in ESI†). We can see three such groups (I–III) in Fig. 3. In the tree diagram, the solid forms of TCl are divided into four main structural groups (red, blue, green and orange). It is very interesting that all solvates (except hydrates) belong to the same structural group (red). It also includes both pure polymorphs of TCl (TCl-I and TCl-II).
Both hydrates are structurally different from the other solvates. TCl sesquihydrate (sesHyd) is loosely similar in packing to cocrystals of TCl with adipic acid (Adip), glutaric acid (Glut), oxalic acid (Oxal) and urea, which are in the group marked in blue. TCl dihydrate (8), as well as the cocrystal of TCl with salicylic acid (Sal), are not similar to any other structure; they separate from the rest of the structures as early as on level two. Surprisingly, both forms (diHyd (8) and Sal cocrystal) are likely to be very convenient arrangements for TCl. The cocrystal with salicylic acid forms most readily from all the described cocrystals of TCl, even with simple mixing and heating of both components.12
For all of the four main branches in the tree diagram, theoretical crystal shape and packing were calculated in Mercury (Bravais, Friedel, Donnay and Harker (BFDH) theoretical crystal morphologies, Fig. 3 and 4).
This visual representation correlates nicely with the results from the tree diagram; the crystal packing is clearly very different in each of the forms. It varies from the regular alternation of trospium and solvent molecules and the prism crystal shape in TCl MeOH (4) (red) to two different layered structures forming plates (TCl sesquihydrate (7) (blue) and TCl dihydrate (8) (green)) and to the column structure in the TCl salicylic acid cocrystal (orange). The calculated crystal shapes were found to be in good correlation with the experimentally observed ones (Fig. 4).
The structures of solvates can be divided into three branches (red, blue and green branches in a tree diagram, Fig. 3) depending on structural similarity as was revealed by the crystal packing similarity calculations (the fourth branch (orange) contains only a cocrystal structure).
Both the blue and green branches contain only one solvate structure (blue: 7 and green: 8). The remaining red branch is populated by six new solvate structures (1–6) and is divided into three parts: (4), (3 and 5; i.e. isostructural group I) and (1, 2 and 6; i.e. isostructural group II).
The red branch is the most complex. Its groups are fairly similar, yet the differences can be observed in the crystal packing as well as the patterns of intermolecular non-covalent interactions. The common feature of this group is the formation of a dominant chain of hydrogen bonds, formed by hydrogen bond O3–H1o3⋯Cl1 and the weak hydrogen bonds resulting in the formation of columns. These columns are further connected via weak hydrogen bonds and π⋯π stacking.
TCl MeOH (4) and group II have a surprising amount of similarities. The dominant chain is in the same direction [1 0 1] and it is formed by alternating mirror images of trospium cations and chloride anions. The main difference among these groups is the presence of hydrogen bond O1s–H1o1s⋯Cl1 in TCl MeOH (4), resulting in a reversed orientation of the solvent and denying the participation of the solvent in C(ar)–H⋯X (X![[double bond, length as m-dash]](https://www.rsc.org/images/entities/char_e001.gif) N or O) hydrogen bonds observed in group II. The orientation of the solvent did not affect the packing similarity calculation used for the creation of the tree diagram and the arrangement of the trospium cations is really similar in both of these groups, yet the fragment of the three molecules of TCl MeOH (4) fails the similarity check and is excluded from the group of aprotic solvents extremely early. This can be ascribed to a significantly smaller unit cell of TCl MeOH (4).
N or O) hydrogen bonds observed in group II. The orientation of the solvent did not affect the packing similarity calculation used for the creation of the tree diagram and the arrangement of the trospium cations is really similar in both of these groups, yet the fragment of the three molecules of TCl MeOH (4) fails the similarity check and is excluded from the group of aprotic solvents extremely early. This can be ascribed to a significantly smaller unit cell of TCl MeOH (4).
Group I is apparently different from the other members of the red branch. The dominant chain of hydrogen bonds is in the direction of [1 0 0] and is formed by translation of the same molecule of TCl, resulting in an almost identical layer 1 with group II and TCl MeOH (4) and an inverted layer 2 (for figures on layer arrangement see ESI,† Fig. 10). This group of solvates is excluded from the rest when the calculated fragment reaches 5 molecules. This follows the layer similarities, since four molecules were selected from the same layer, but the fifth one is selected from the second layer populated by mirror images. The solvent is bound by a hydrogen bond to a chloride anion in this case (O1s–H1o1s⋯Cl1 or C1s–H3c1s⋯Cl1) and plays no other important role in the crystal packing.
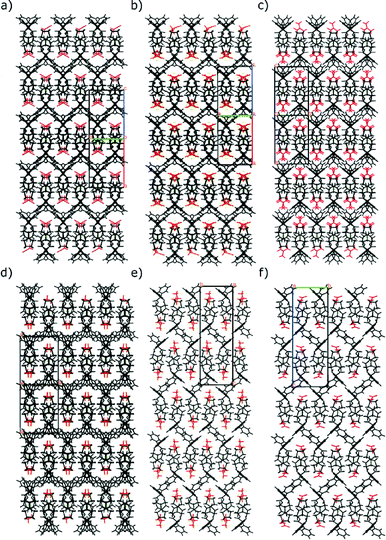
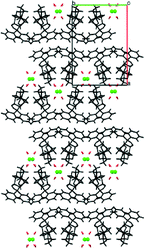
The differences in the structures can be easily demonstrated in the figures of crystal packing, where the mirror images of stacking results in a zigzag line formed by phenyl rings, absent in group I (see Fig. 5).
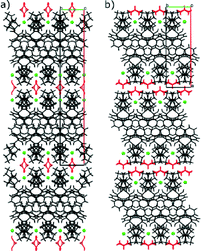
The blue branch is populated by TCl sesquihydrate (7) as well as the known cocrystals of TCl. But the similarities are not very pronounced between the sesquihydrate (7) and the rest of the group. Throughout the group, the main interactions are hydrogen bonds. The largest similar fragment is formed by two molecules and in this case there is no other distinctive similarity of the cocrystals and the sesquihydrate (7). The hydrogen bond patterns differ significantly and the only similarity of the structure packing is a tendency to form a bilayer with the polar part of the trospium cation chloride anion and solvent (or coformer) on the inside and aromatic part of the trospium cation on the outside (see Fig. 6). The TCl cocrystals keep the similarity to the threshold of 12 molecules, and then the structure of the urea cocrystal fails the similarity check. This is caused by the positioning of the formed bilayers (see Fig. 7).
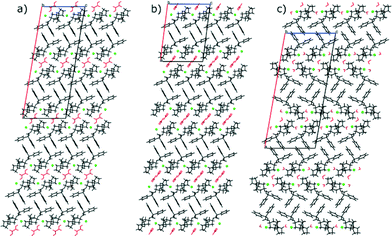 | ||
| Fig. 6 Crystal packing of selected members of the blue branch (see Fig. 3) viewed in direction [0 1 0] with the trospium cation depicted in black, the coformer/solvent in red and the chloride anion in green. a) TCl Oxal, b) TCl Urea, c) TCl sesquihydrate. | ||
In the case of TCl dihydrate (8), the usual hydrogen bond O3–H1o3⋯Cl1 is no longer observed, as mentioned previously. The chain of the alternating molecules of water and chloride anions is observed instead and the trospium cation is attached to it via hydrogen bond O3–H1o3⋯O2w, creating a firm pillar in the structure. The pillars are further connected with the weaker hydrogen bonds into a bilayer (see Fig. 8), which is further connected into a three-dimensional structure via C(ar)–H⋯π and π⋯π interactions.
Thermal behaviour of reproducible solvates
The solvate loses firstly its solvent molecules during desolvation, which can drive the parent compound molecules to arrange in a different order, providing a new polymorph. We decided to expel the molecules of the solvent from the solvate structure by heating, as anhydrous TCl is thermally stable. For thermal experiments, we were able to prepare larger sample quantities of sufficient purity only for six of the solvates (see Table 3; the line with water relates to TCl dihydrate).| Solvent | Boiling point of the solvent (°C) | Desolvation temperature (°C) | Stoichiometry from TGA/DSC | PXRD of resulting powder |
|---|---|---|---|---|
| a Traces of TCl were detected in the samples analysed by TGA/DSC, therefore, the stoichiometry does not match. For desolvation experiments pure solvates were prepared and weight loss corresponded to the calculated ratio of the solvent. | ||||
| ACN | 82 | 140 | 1![[thin space (1/6-em)]](https://www.rsc.org/images/entities/char_2009.gif) : :![[thin space (1/6-em)]](https://www.rsc.org/images/entities/char_2009.gif) 0.89 0.89 |
TCl form I |
| DMF | 152 | 115 | 1![[thin space (1/6-em)]](https://www.rsc.org/images/entities/char_2009.gif) : :![[thin space (1/6-em)]](https://www.rsc.org/images/entities/char_2009.gif) 0.90 0.90 |
TCl form I |
| MeNO2 | 100 | 152 | 1![[thin space (1/6-em)]](https://www.rsc.org/images/entities/char_2009.gif) : :![[thin space (1/6-em)]](https://www.rsc.org/images/entities/char_2009.gif) 0.69a 0.69a |
TCl form I |
| MeOH | 65 | 98 | 1![[thin space (1/6-em)]](https://www.rsc.org/images/entities/char_2009.gif) : :![[thin space (1/6-em)]](https://www.rsc.org/images/entities/char_2009.gif) 0.94 0.94 |
TCl form I |
| PRN | 96 | 125 | 1![[thin space (1/6-em)]](https://www.rsc.org/images/entities/char_2009.gif) : :![[thin space (1/6-em)]](https://www.rsc.org/images/entities/char_2009.gif) 0.76a 0.76a |
TCl form I |
| WA | 100 | 93 | 1![[thin space (1/6-em)]](https://www.rsc.org/images/entities/char_2009.gif) : :![[thin space (1/6-em)]](https://www.rsc.org/images/entities/char_2009.gif) 1.88 1.88 |
TCl form I |
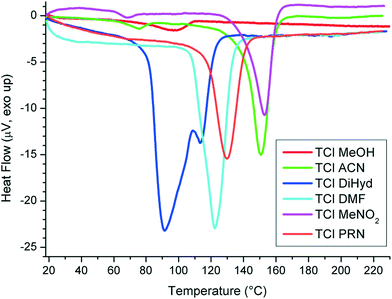
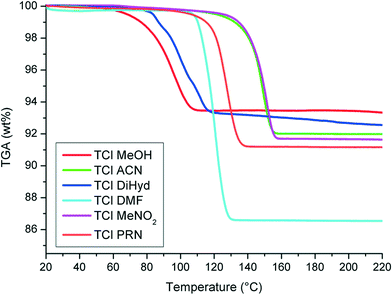
The temperature of solvent evaporation from the structure was determined from TGA/DSC measurements and is shown in Table 3. The calculation of weight loss during heating confirmed the 1![[thin space (1/6-em)]](https://www.rsc.org/images/entities/char_2009.gif) :
:![[thin space (1/6-em)]](https://www.rsc.org/images/entities/char_2009.gif) 1 stoichiometry of each solvate and the 1
1 stoichiometry of each solvate and the 1![[thin space (1/6-em)]](https://www.rsc.org/images/entities/char_2009.gif) :
:![[thin space (1/6-em)]](https://www.rsc.org/images/entities/char_2009.gif) 2 stoichiometry of the dihydrate. Upon desolvation at an increased temperature, the resulting powder diffraction patterns corresponded to pure TCl in its most common polymorph (form I). This was not surprising, as the solvates were shown to be structurally similar to the polymorph form I. However, for the dihydrate (8), whose packing is fundamentally different, there was hope that its desolvation could lead to a new polymorph. Unfortunately, this was not the case.
2 stoichiometry of the dihydrate. Upon desolvation at an increased temperature, the resulting powder diffraction patterns corresponded to pure TCl in its most common polymorph (form I). This was not surprising, as the solvates were shown to be structurally similar to the polymorph form I. However, for the dihydrate (8), whose packing is fundamentally different, there was hope that its desolvation could lead to a new polymorph. Unfortunately, this was not the case.
The DSC experiment of TCl MeOH (4) was erratic at a heating rate of 10 °C min−1. We found that gentle grinding improved the curve; however, reproducible data were collected only at 1 °C min−1 (see Fig. 9 and 10).
While it is a common phenomenon for the solvent to leave the structure of its solvate above the boiling point of the present solvent, for two of the presented structures we observed an opposite behaviour. In the DMF solvate (2) and TCl dihydrate (8), the solvents left the structures before their respective boiling points. While we see a reason for this for diHyd (8), we can only speculate about the quality and frequency of the weak interactions for the DMF solvate (2).
In diHyd (8), two molecules of water are bound with weak hydrogen bonds (d(D⋯A) > 3.1 Å) to Cl−. O1w is connected exclusively to Cl−, while O2w forms a bridge to trospium O3 (d(D⋯A) = 2.668(2) Å, see Table 4. A list of hydrogen bonds is in the ESI†). Upon heating, we expect the O1w molecule to leave rapidly, thus destabilizing the structure packing and forcing O2w to leave as a consequence. As O2w is not prone to leave the structure so easily, we observe subtle curves in TGA during the dehydration phase in the range of 80–100 °C. The structure rapidly recrystallizes as TCl form I, which is indicated by the weak endotherm at 110 °C in DSC.
The notion of the lower stability of the DMF solvate (2) was also drawn from the observations during the screening experiments, where the DMF solvate (2) was the only solvate that was not obtained from the anti-solvent experiments. The other solvates were successful in the stability competition with TCl form I during the anti-solvent experiment. Hence, the DMF solvate (2) appears to be the least stable form.
Conclusions
We performed systematic solvate screening for a pharmaceutical compound, trospium chloride. Eight solvates were discovered and their crystal structures solved.We identified three distinct groups of TCl solvates varying in the direction of hydrogen bond chains and solvent orientation.
The packing similarity calculation proved to be a strong tool for the evaluation of a large amount of crystal structures. However, the results can be misleading in the case of large discrepancies in the unit cell volume.
We tried to find a relation between the solubility and the solvate formation, but to no avail. TCl provides solvates both with polar protic and polar aprotic solvents; its solubility in the solvents varies from as low as below 1 mg per mL to as high as above 600 mg per mL.
The serendipitous preparation of 2 out of the 8 novel forms demonstrates that no solid state screening is ever perfect and is able to find all possible crystal forms. The conventional screening revealed forms that were easily reproduced, but did not provide the EtOH solvate previously described in literature nor did it provide the iPrOH solvate and sesquihydrate presented in this work that were prepared outside the systematic screening experiments.
On the other hand, the screening revealed the possibility of TCl hydrate formation, which had been, until now, unknown. Especially for the pharmaceutical hydrates, it is crucial to be aware of their existence, since they can often pose a threat to robust and stable drug formulation.
Acknowledgements
This work was supported by the Grant Agency of Czech Republic, grant no. 106/14/03636S and grant no. 14-03276s, and received financial support from specific university research (MSMT no. 20/2015).We would like to thank the Interpharma Praha a.s. company for the provided trospium chloride; we have found many peculiarities within this intriguing molecule. We would also like to thank Míša Chrastná, Honza Rohlíček and Ondra Dammer; their contribution to ‘the trospium case’ is much appreciated.
Notes and references
- S. Desikan, R. L. Parsons, W. P. Davis, J. E. Ward, W. J. Marshall and P. H. Toma, Org. Process Res. Dev., 2005, 9, 933–942 CrossRef CAS.
- S. R. Chemburkar, J. Bauer, K. Deming, H. Spiwek, K. Patel, J. Morris, R. Henry, S. Spanton, W. Dziki, W. Porter, J. Quick, P. Bauer, J. Donaubauer, B. A. Narayanan, M. Soldani, D. Riley and K. McFarland, Org. Process Res. Dev., 2000, 4, 413–417 CrossRef CAS.
- A. Newman, Org. Process Res. Dev., 2013, 17, 457–471 CrossRef CAS.
- P. P. Bag, R. R. Kothur and C. Malla Reddy, CrystEngComm, 2014, 16, 4706–4714 RSC.
- R. Mani, K. Varadharajan and M. Louhi-Kultanen, CrystEngComm, 2014, 16, 4183–4193 RSC.
- Polymorphism In Pharmaceutical Solids, ed. H. G. Brittain, Informa Healthcare, New York, USA, 2nd edn, 2009 Search PubMed.
- C. H. Gu, V. Young and D. J. W. Grant, J. Pharm. Sci., 2001, 90, 1878–1890 CrossRef CAS PubMed.
- V. S. Minkov, A. A. Beloborodova, V. A. Drebushchak and E. V. Boldyreva, Cryst. Growth Des., 2013, 14, 513–522 Search PubMed.
- S. Aitipamula, P. S. Chow and R. B. H. Tan, CrystEngComm, 2012, 14, 691–699 RSC.
- G. A. Neville, H. D. Beckstead and J. D. Cooney, Fresenius' J. Anal. Chem., 1994, 349, 746–750 CrossRef CAS.
- E. Skořepová, J. Čejka, M. Hušák, V. Eigner, J. Rohlíček, A. Šturc and B. Kratochvíl, Cryst. Growth Des., 2013, 13, 5193–5203 Search PubMed.
- V. Sládková, J. Cibulková, V. Eigner, A. Šturc, B. Kratochvíl and J. Rohlíček, Cryst. Growth Des., 2014, 14, 2931–2936 Search PubMed.
- K. Grodowska and A. Parczewski, Acta Pol. Pharm., 2010, 67, 3–12 CAS.
- X'PERT HighScore Plus, 2009, PANanalytical BV Search PubMed.
- CrysAlisPro, 2002, Oxford Diffraction Search PubMed.
- L. Palatinus and G. Chapuis, J. Appl. Crystallogr., 2007, 40, 786–790 CrossRef CAS.
- V. Petříček, M. Dušek and L. Palatinus, in Zeitschrift für Kristallographie - Crystalline Materials, 2014, vol. 229, p. 345 Search PubMed.
- J. Rohlicek and M. Husak, J. Appl. Crystallogr., 2007, 40, 600–601 CrossRef CAS.
- C. F. Macrae, I. J. Bruno, J. A. Chisholm, P. R. Edgington, P. McCabe, E. Pidcock, L. Rodriguez-Monge, R. Taylor, J. van de Streek and P. A. Wood, J. Appl. Crystallogr., 2008, 41, 466–470 CrossRef CAS.
- Discovery Studio, Accelrys, Inc.
- E. Skorepova, M. Husak, J. Cejka, P. Zamostny and B. Kratochvil, J. Cryst. Growth, 2014, 399, 19–26 CrossRef CAS PubMed.
- S. L. Childs, P. A. Wood, N. Rodríguez-Hornedo, L. S. Reddy and K. I. Hardcastle, Cryst. Growth Des., 2009, 9, 1869–1888 CAS.
Footnote |
| † Electronic supplementary information (ESI) available: X-ray crystallographic information files (CIF) for all solvates, PXRD patterns of the bulk samples compared with the calculated ones, detailed solubility measurement data, further structural comparisons and tables of hydrogen bonds. See DOI: 10.1039/c5ce00744e |
| This journal is © The Royal Society of Chemistry 2015 |

