 Open Access Article
Creative Commons Attribution 3.0 Unported Licence
Structural and chemical changes of Zn-doped CeO2 nanocrystals upon annealing at ultra-high temperatures
Fangjian
Lin
a,
Ivo
Alxneit
*a and
Alexander
Wokaun
b
aSolar Technology Laboratory, Paul Scherrer Institute, CH-5232 Villigen PSI, Switzerland. E-mail: ivo.alxneit@psi.ch; Fax: +41 56 310 2688; Tel: +41 56 310 4092
bGeneral Energy Research Department, Paul Scherrer Institute, CH-5232 Villigen PSI, Switzerland
First published on 12th January 2015
Abstract
The structure of doped ceria plays an important role in its chemical reactivity and catalytic performance. However, for the majority of the dopants studied, whether a monophasic solid solution is formed or not is typically determined only by standard X-ray diffraction (XRD). In-depth structural characterization is lacking. In this paper we have prepared Zn-doped ceria nanocrystals exhibiting twice the oxygen storage capacity (OSC) of pure ceria. X-ray photoelectron spectroscopy (XPS) shows that the material is chemically inhomogeneous with zinc enrichment in the surface layer. X-ray fluorescence (XRF) reveals significant compositional inhomogeneity of the material after annealing in air at 1300 °C for 24 h. The standard structural characterization of this material using room temperature XRD and transmission electron microscopy (TEM) fails to reveal its correct phase composition. Based on clear evidence from in situ high temperature XRD we show that, after calcination at 500 °C, the material is not monophasic: X-ray amorphous ZnO is present within the material. The amorphous ZnO crystallizes at 800 °C and undergoes second-stage incorporation at even higher temperatures. This second-stage incorporation is not complete after annealing and trace amounts of ZnO remain according to synchrotron-based XRD. Our work provides valuable insight into the incorporation mechanism of zinc into the ceria lattice, and in particular, raises some doubts on the phase compositions reported in many previous studies on doped ceria.
Introduction
Ceria (CeO2) is one of the most important functional rare earth oxides and widely used in a number of technological applications, particularly in catalysis.1 A key feature of ceria is its oxygen storage capacity (OSC),2 resulting from its reversible and relatively easy reduction to the non-stoichiometric CeO2−δ. Ceria and related oxides are applied as catalysts or as support oxides, notably in three-way catalytic converters that catalyse CO oxidation,3–5 soot oxidation,6–8 and NOx reduction.9,10 Ceria has also been exploited as an electrolyte for solid oxide fuel cells (SOFCs)11,12 and recently as a redox material for two-step thermochemical cycles to split H2O and CO2 to H2 and CO.13–15A lot of effort has been devoted to improving the physico-chemical properties of ceria by introducing heterocations into its lattice. Doping ceria with aliovalent cations such as Ca2+, Sr2+, Y3+, Sm3+, and Gd3+ was shown to significantly increase its ionic conductivity,16 which is required for the electrolytes of SOFCs. Enhanced OSC and lattice oxygen mobility of ceria by doping Pr3+ and La3+ promote their catalytic activities for soot6,7,17 and CO oxidation.18,19 Thermochemical fuel production is enhanced by doping ceria with Zr4+,20–22 or a combination of Zr4+ and Gd3+/La3+.22 Density functional theory (DFT) calculations have shown that the incorporation of heterocations can introduce structural distortions in the lattice and thus enhance the OSC of ceria,23,24 revealing a close link between the structure of doped ceria and its chemical properties.
Despite the important role of the structure of doped ceria, the focus in the literature is mostly on its chemical properties and catalytic activities. For the majority of the dopants studied, the formation of single-phased solid solution (or not) is typically determined only by X-ray powder diffraction (XRD). In-depth structural characterization is lacking. For instance, among the few available reports on Zn-doped ceria, the focus has been on its UV shielding property,25 and its activity for CO oxidation.26–28 A doping level of 56.1% has been reported based only on standard XRD.25 This number seems very high in the view of very different charge and radius of Zn2+ with respect to Ce4+. Recently, Schmale et al. estimated a solubility limit of 3 ± 0.7% of Zn2+ in ceria based also on XRD.29 Thus, a clear picture of the incorporation of Zn2+ into the ceria lattice is still missing. It also seems that the standard characterization of doped ceria by room temperature XRD (often coupled with TEM) is not sufficient to determine its true phase composition.
In this study, we have prepared Zn-doped ceria nanocrystals that exhibit twice the oxygen storage capacity of pure ceria. The standard characterization of the materials by room temperature XRD and TEM fails to reveal their correct phase composition. Based on clear evidence from in situ high temperature XRD we show that, after calcination at 500 °C, the materials are not single-phased: X-ray amorphous ZnO is present within the materials. The amorphous ZnO crystallizes at 800 °C and undergoes second-stage incorporation at even higher temperatures. Our work also raises some doubts on the phase compositions reported in many previous studies on doped ceria.
Experimental
Materials and synthesis
Analytical grade cerium nitrate Ce(NO3)3·6H2O (99.99%) and zinc nitrate Zn(NO3)2·6H2O (99.99%) were purchased from Sigma Aldrich. They were directly used as precursors without further purification. Zn-doped ceria samples (Ce1−xZnxO2−δ, nominal values of x = 0.05, 0.1 and 0.2) were synthesized via a modified co-precipitation method. For simplicity they are designated as 05Zn, 10Zn and 20Zn in this paper. Desired quantities of the precursors were dissolved in an excess amount of de-ionized water and stirred continuously for about 10 min to achieve complete dissolution. Diluted aqueous ammonia solution (28 vol%) was then added drop-wise to the precursor solution under vigorous stirring until pH = 10 was reached and stabilized. The precipitates were aged for one day under stirring and then allowed to settle for another day. After the clear supernatant was decanted, the precipitates were filtered and rinsed several times until a pH below 7 was reached. The filter cake was then dried at 80 °C in static air for about 12 hours. The dry cake was crushed in an agate mortar, and the powder sample was calcined in air for 5 hours at 500 °C. Pure ceria was also synthesized following the same procedure, except that the precipitation pH was 9. The materials after calcination are designated as “as-prepared” in this paper. The actual chemical compositions of the as-prepared samples were determined by ICP-OES (inductively coupled plasma-optical emission spectrometry), and the results are summarized in Table 1.| Sample name | Target composition | Actual composition (mol%) |
|---|---|---|
| Ceria | CeO2 | — |
| 05Zn | Ce0.95Zn0.05O2−δ | Zn![[thin space (1/6-em)]](https://www.rsc.org/images/entities/char_2009.gif) : :![[thin space (1/6-em)]](https://www.rsc.org/images/entities/char_2009.gif) Ce = 4.97 Ce = 4.97![[thin space (1/6-em)]](https://www.rsc.org/images/entities/char_2009.gif) : :![[thin space (1/6-em)]](https://www.rsc.org/images/entities/char_2009.gif) 95.03 95.03 |
| 10Zn | Ce0.90Zn0.10O2−δ | Zn![[thin space (1/6-em)]](https://www.rsc.org/images/entities/char_2009.gif) : :![[thin space (1/6-em)]](https://www.rsc.org/images/entities/char_2009.gif) Ce = 9.53 Ce = 9.53![[thin space (1/6-em)]](https://www.rsc.org/images/entities/char_2009.gif) : :![[thin space (1/6-em)]](https://www.rsc.org/images/entities/char_2009.gif) 90.47 90.47 |
| 20Zn | Ce0.80Zn0.20O2−δ | — |
Standard characterization
Crystalline phases of all the materials were identified by X-ray powder diffraction using an X'Pert diffractometer from PANalytical. The diffraction patterns were collected with Cu Kα radiation (λ = 1.5405 Å) at 45 kV and 20 mA. An integration time of 5 s and a step size of 0.05° were set for all measurements unless indicated otherwise. TEM images of selected samples were recorded with JEOL JEM 2010 transmission electron microscope equipped with a LaB6 filament and a slow scan CCD camera (Gatan Inc.) at an acceleration voltage of 200 kV. Each sample was prepared by depositing a droplet of sample and isopropanol suspension on a copper grid coated with lacey carbon. The OSCs of selected samples as-prepared were determined using a Netzsch thermogravimetric analyser (TGA) (TA409). The samples were exposed alternatively to reducing (10% H2/Ar) and oxidizing conditions (10% O2/Ar) at 500 °C for 4 cycles. XPS spectra were measured using a KRATOS ESCA model AXIS 165 spectrometer with Mg Kα (1253.6 eV) radiation as the excitation source. Chemical shifts caused by the charging of the samples were corrected by using the binding energy of the adventitious carbon (C 1s) at 284.6 eV as internal reference. XRF measurements were carried out using an EDAX ORBIS micro X-ray fluorescence analyser equipped with a Rhodium anode and a solid-state multi-channel photon detector. The instrument was operated at 35 kV and 400 μA with a beam diameter of 2 mm for spectra collection and 30 μm for elemental mapping.High temperature XRD and synchrotron-based μ-XRD
High temperature XRD patterns were collected in ambient air with the same aforementioned diffractometer equipped with an HDK2.4 chamber. Samples were deposited on resistively heated platinum strips, which were under mechanical tension to minimize buckling caused by thermal expansion. Synchrotron-based XRF and μ-XRD characterization of selected samples (in forms of pressed pellets) was carried out at the MicroXAS beamline of Swiss Light Source (SLS). The beam size was approximately 5 × 5 μm2. The photon energy was set to 10 keV for both fluorescence mapping and micro X-ray diffraction experiments.Results and discussion
Standard characterization
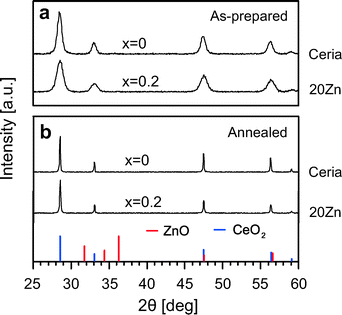
In Fig. 1a room temperature XRD patterns for two samples as-prepared are reported. For simplicity, results for 5Zn and 10Zn are not included. Diffraction patterns for all samples exhibit only reflections characteristic of cubic ceria. It thus appears that Zn2+ is completely incorporated into the host lattice even at a doping level of 20 mol%. Zn-doped samples also exhibit lower reflection intensities and increased peak widths relative to pure ceria, indicating reduced crystallinity. Estimation of the crystallite size using the Scherrer equation reveals a decrease from approximately 11.9 nm (ceria) to 7.7 nm (20Zn) (see Table 2). To evaluate the thermal stability of Zn-doped ceria, the as-prepared samples were annealed at 1300 °C in air for 24 h. The corresponding XRD patterns are presented in Fig. 1b. Again, ZnO cannot be detected. Thus, it seems that Zn-doped ceria is structurally stable in air at least up to 1300 °C. As is evident from the narrower peaks, the crystallinity of the samples after annealing is increased.| Sample | As-prepared | Annealed | ||||
|---|---|---|---|---|---|---|
| Sample name | Bulk zinca(%) | d (nm) | Surface zincc(%) | OSC (μmol O g−1) | d (nm) | Surface zinc (%) |
| a Zinc concentration in the bulk is the actual composition determined by ICP-OES as shown in Table 1. b Crystallite sizes are calculated from 3 or 4 peaks in the diffraction patterns using the Scherrer equation, where the shape factor K = 0.94 for cubic crystals. c Zinc concentration in the surface layer is quantified from XPS spectra. | ||||||
| CeO2 | — | 11.9 ± 0.7 | — | 135.5 ± 3.5 | 49.6 ± 2.2 | — |
| 05Zn | 4.97 | 8.8 ± 1.0 | 17.44 | — | 50.1 ± 2.4 | 25.19 |
| 10Zn | 9.53 | 8.4 ± 1.1 | 25.56 | — | 50.1 ± 2.4 | 26.18 |
| 20Zn | — | 7.7 ± 0.7 | 29.05 | 267.7 ± 9.0 | 53.0 ± 5.4 | 38.11 |
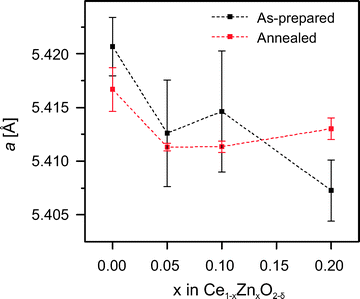
Lattice parameters were calculated based on the positions of the first four peaks. The results are presented in Fig. 2. In general, doped samples exhibit lattice contraction compared to pure ceria. After the annealing, a small increase of the lattice constant with increasing doping level is suggested. This is consistent with the results reported previously.25,29 It was proposed that Zn2+ (90 pm) can be incorporated via two mechanisms: 1) substitution of Ce4+ (97 pm) leading to lattice contraction and the formation of charge compensating oxygen vacancies, and 2) Zn2+ occupying interstitial lattice sites, which causes the lattice to expand.25 However, further evidence is needed to verify this proposal. The incorporation of Zn2+ into the ceria lattice not only modifies its structural properties such as the lattice dimensions, but also affects its chemical properties. For instance, the reducibility of ceria is enhanced by doping with ZnO. TGA studies reveal that the OSC of 20Zn is nearly double the value of pure ceria. The experimental protocol used here to determine the OSC of ceria is similar to the one by Wang et al.2 The mass decrease when the sample is exposed to reducing conditions (10 vol% H2 in Ar in present study) corresponds to the oxygen release due to the reduction of Ce4+ to Ce3+. Accordingly, the mass increase when the sample is exposed to oxidizing conditions (10 vol% O2 in Ar) corresponds to the oxygen uptake by cerium oxidation. The OSC values are calculated based on the mass changes averaged over four redox cycles. The exact values are listed in Table 2.
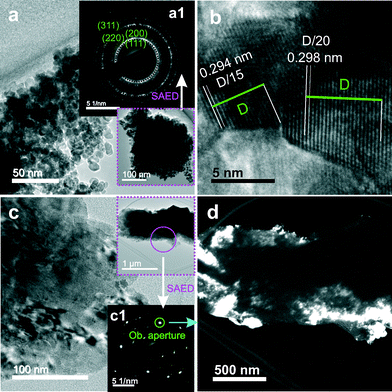
The nanocrystalline nature of the as-prepared samples is confirmed by TEM. Fig. 3a shows a representative image of 20Zn at lower magnification. Crystallites of a relatively uniform size around 10 nm are easily recognized, in agreement with the value calculated using the Scherrer equation. All the calculated sizes of crystal domains are included in Table 2. The selected area electron diffraction (SAED) pattern shown as inset a1 confirms the presence of polycrystalline cubic ceria. However, it shows no evidence of ZnO, consistent with the observation from the X-ray diffraction measurements shown in Fig. 1a. Fig. 3b shows a typical high resolution TEM image for 20Zn. Lattice fringes with a spacing of about 0.30 nm, indexed as the ceria (111) planes, are clearly visible in the image. The increased crystallinity of 20Zn after annealing, evident from the narrower diffraction peaks seen in Fig. 1b, is also observed by TEM. Fig. 3c shows a much larger grain with a diameter of a few hundreds of nanometers. Here in the image, individual single crystals cannot be distinguished anymore. The two images (Fig. 3a and c) are roughly at the same magnification. The growth of crystals is further evidenced by the electron diffraction pattern (inset c1) exhibiting only bright discrete spots instead of rings, and by the dark field image showing clusters of crystals as seen in Fig. 3d. Note that the two electron diffraction patterns in Fig. 3 were obtained from sample areas of similar sizes.
Chemical inhomogeneity
To check for possible changes in the chemical composition of Zn-doped ceria caused by annealing, we collected cerium 3d and zinc 2p XPS spectra for 05Zn, 10Zn and 20Zn. The results of the quantification of surface zinc are presented in Table 2. The concentration of zinc in the surface layer of the as-prepared samples probed by XPS is about 2 to 3 times as high as the bulk concentration measured by ICP-OES. This suggests enrichment of zinc at the surface. This chemical inhomogeneity is further enhanced by annealing at 1300 °C, after which the concentration of zinc in the surface layer is up to 5 times as high as the bulk concentration. This increase in chemical inhomogeneity suggests bulk-to-surface migration and thus high mobility of zinc in ceria.The high mobility of zinc in ceria is observed not only in the nanometer range but also on the scale of microns. Fig. 4 shows the cerium and zinc XRF maps of 20Zn for an area of approximately 2.3 × 1.8 mm2. For 20Zn as-prepared, the distribution of zinc inside the material is very homogeneous, as seen in Fig. 4b. However, once the sample is annealed at 1300 °C for 24 hours, zinc-rich patches on the order of 10 μm in diameter become clearly visible (see Fig. 4d, plotted in the same scale as Fig. 4b). XRF spectroscopic studies also show that ZnO sublimation in air at temperatures between 1200 °C and 1300 °C for extended period (48 h) is negligible. Thus it is reasonable to assume that Fig. 4b and d show the same average zinc concentration (nominally 20 mol%). Then the zinc-rich regions clearly seen in Fig. 4d must correspond to an even higher zinc concentration. However, surprisingly no ZnO is detected by the standard XRD (Fig. 1b) with an illuminated area of about 10 × 10 mm2. In contrast, the distribution of cerium is very homogeneous and is not influenced by annealing (Fig. 4a and c).
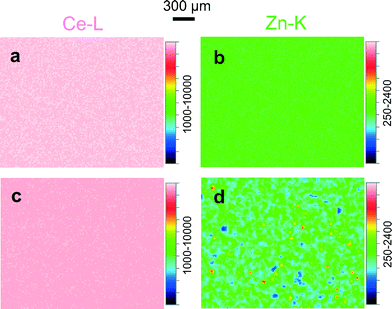 | ||
| Fig. 4 Cerium XRF maps of 20Zn (a) as-prepared and (c) annealed, plotted in same color scale. Zinc XRF maps of 20Zn (b) as-prepared and (d) annealed, plotted in the same scale. | ||
High temperature X-ray diffraction
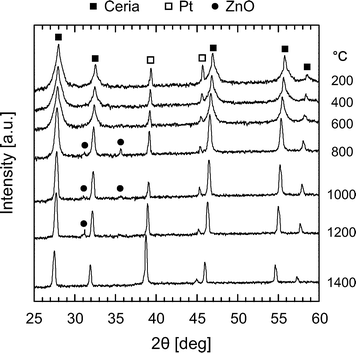
To verify the structural stability of Zn-doped ceria and to shed light on the lattice expansion of 20Zn observed after annealing (see Fig. 2), we performed in situ high temperature XRD studies in air. At first, diffraction patterns were recorded at every 200 °C at temperatures in the range 200–1400 °C for 20Zn. The results are presented in Fig. 5. At temperatures below 800 °C, only peaks attributed to ceria and the substrate platinum are observed. However, at temperatures between 800 °C and 1200 °C new features close to the ceria (200) peak are observed. Careful examination on the positions of these new features relative to ceria (200) reveals that they originate from wurzite ZnO. ZnO then disappears and is no longer observed at 1400 °C, suggesting its incorporation into the ceria lattice. This is likely to be the cause of the observed lattice expansion of 20Zn after annealing. The origin of the intermediately formed ZnO is from either phase segregation above 800 °C or crystallization of X-ray amorphous, un-incorporated ZnO present after calcination at 500 °C.In order to confirm the formation of ZnO at 800 °C to 1200 °C, and to determine its origin, we conducted a more detailed high temperature diffraction study for 20Zn. The sample was subjected to two consecutive heating cycles, each with isothermal segments at 800 °C, 1000 °C, and 1200 °C (heating rate 60 °C min−1). To increase the signal-to-noise ratio and to obtain a better angular resolution, the integration time was increased to 7 s and the step size was decreased to 0.01°. The 2θ range was limited to 30–42° covering CeO2 (200), ZnO (100), (002), (101) and Pt (111). Four consecutive patterns were collected at each temperature. The results are presented in Fig. 6 for 20Zn (x = 0.2). In the first heating cycle, ZnO is present at 800 °C and 1000 °C. Once the sample is further heated to 1200 °C, ZnO disappears during the collection of the first pattern (red pattern in a-1200) within about 60 min. The disappearance of ZnO can only be due to its incorporation into the ceria host lattice since ZnO sublimation in air at 1200 °C is negligible. In fact, the XRF spectrum of 20Zn after annealing for 48 h at 1250 °C shows almost no decrease of the zinc concentration. Once the sample is cooled to 800 °C the second heating cycle starts. During this cycle no ZnO was detected. Similar results were obtained for 10Zn and 05Zn, but only traces of ZnO could be observed for 05Zn at 800 °C and 1000 °C. The irreversible disappearance of the ZnO intermediate at about 1200 °C strongly suggests that the origin of the intermediate is not due to phase segregation, but due to the crystallization of the un-incorporated X-ray amorphous ZnO present after synthesis. More than 40% of Zn2+ seems to be initially present as un-incorporated X-ray amorphous ZnO based on the ratio of ZnO (101) and ceria (200) areas (pattern at 1000 °C) in comparison to a calibration performed with known mixtures of pure ceria and ZnO.
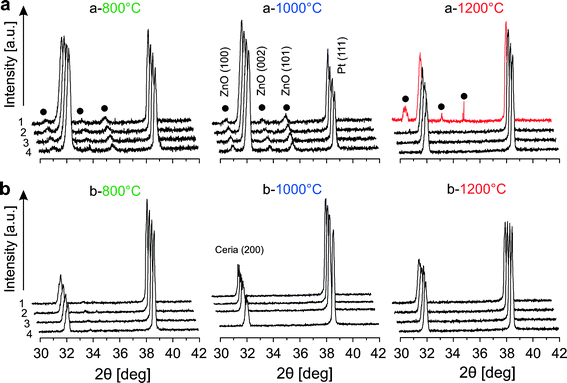 | ||
| Fig. 6 In situ high temperature XRD patterns of 20Zn (x = 0.2) in air for 2 cycles of heating from 800 °C to 1200 °C: (a) 1st cycle and (b) 2nd cycle. | ||
Further evidence is obtained by comparing the positions of the ceria (200) peak in 10Zn (x = 0.1) diffraction patterns recorded at the same temperature but in different heating cycles, as presented in Fig. 7. At each temperature the positions of the ceria (200) peak recorded during the second cycle are shifted to lower angles compared to the first cycle, indicating an expansion of the lattice. The shift becomes smaller with increasing temperatures. At 1200 °C the positions roughly coincide. From Fig. 2, we know that the lattice constant of doped ceria after annealing increases with increasing doping level. Based on the findings presented in Fig. 7, a clear picture can be obtained: during the first heating cycle, the un-incorporated X-ray amorphous ZnO that is present after synthesis crystallizes around 800 °C and becomes visible in the diffraction patterns. This ZnO is partly incorporated into the ceria lattice by a solid–solid reaction between 800 °C and 1000 °C, thus increasing the doping level of the sample. The incorporation of ZnO is nearly completed at 1200 °C. Thus, the doping level of 10Zn increases during the first cycle while the temperature is increased as incorporation proceeds, but remains constant during the second cycle. At 800 °C samples with slightly different doping level and thus different peak positions are compared in Fig. 7. Since complete incorporation of ZnO is achieved by the end of the first cycle, samples with nearly identical doping levels are compared at 1200 °C. Thus nearly identical positions of the ceria (200) peak are expected in this case. Thus far, we have presented clear evidence showing that only a fraction of the Zn2+ is incorporated into the ceria lattice after calcination at 500 °C. The remaining is present as X-ray amorphous ZnO in substantial quantities. Temperatures of 800–1200 °C or higher is required for its seemingly complete incorporation.
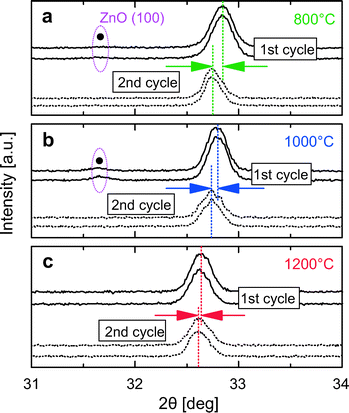 | ||
| Fig. 7 Comparison of ceria (200) peak positions of 10Zn between two cycles at (a) 800 °C, (b) 1000 °C and (c) 1200 °C. | ||
Synchrotron based μ-XRF and μ-XRD
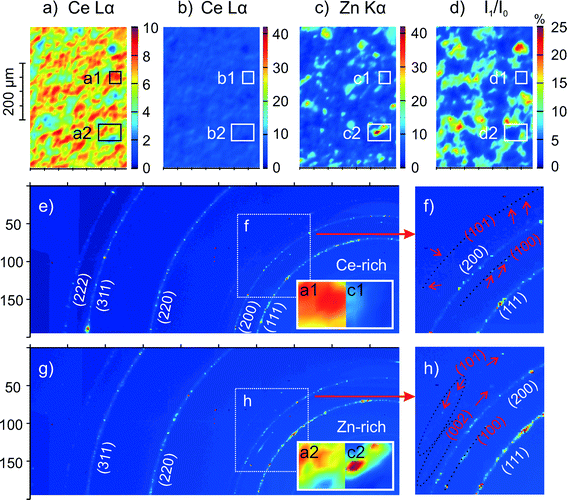
In order to verify the findings of the standard characterization, samples of 20Zn as-prepared and after annealing were characterized by spatially resolved μ-XRF and μ-XRD. This offers a few advantages over the standard XRD and XRF. For instance, the photon flux and brightness from a synchrotron source is orders of magnitude higher, increasing its capability of detecting trace phases. Due to the micron-sized beam of 5 × 5 μm2, an almost 30 times better spatial resolution is achieved. The μ-XRD capability allows the detection of structural inhomogeneity or changes in the phase composition at the same spatial resolution. In addition, it is possible to estimate the local thickness of the sample by measuring and mapping the beam attenuation. This is important because XRF maps can be also influenced by sample thickness due to different escape depths of Ce Lα and Zn Kα photons. Results for 20Zn as-prepared show that the spatial distribution of cerium and zinc is homogeneous, consistent with XRF measurements using traditional X-ray sources (Fig. 4a and b). Synchrotron XRD also agrees with standard XRD (Fig. 1a), showing no crystalline ZnO. Results for 20Zn after annealing are presented in Fig. 8. Fig. 8a and b show the spatial distribution of cerium for an area of approximately 340 × 500 μm2, while Fig. 8c shows the zinc distribution in the same area. Fig. 8d shows the beam transmission map as an indicator of local sample thickness. These maps generally confirm the findings of XRF using traditional X-ray sources, but with much better resolution. Zn-rich patches have sizes ranging from a few μm to 50 μm in diameter. Two areas (“1” and “2”) exhibiting similar beam transmission (Fig. 8d), indicating a similar sample thickness, were analysed in detail. It is easy to recognize from Fig. 8a and c that area “1” is cerium-rich and area “2” is zinc-rich. Fig. 8e shows a typical μ-XRD pattern recorded within the cerium-rich area. The prominent phase is found to be fluorite CeO2 (denoted by white lattice plane index). Upon a closer inspection (see zoom-in as Fig. 8f), very faint but discernible diffraction spots (marked by arrows) are visible close to the CeO2 (200) diffraction ring. They are due to single crystals of wurzite ZnO with orientations of (101) and (100). These traces of ZnO were not detected by the standard XRD (Fig. 1b). The presence of ZnO in the Zn-rich area is more pronounced, although still minute compared to the CeO2 phase, as seen in a typical μ-XRD pattern shown as Fig. 8g and h. ZnO single crystals with orientation (002) are also detected, with the orientation (100) being most pronounced.Characterization by synchrotron-based μ-XRF and μ-XRD confirmed that the spatial distribution of zinc in the sample becomes very inhomogeneous (on a scale of a few tens of micrometers) after annealing at ultra-high temperatures (1300–1400 °C). Moreover, these results clearly show that the second-stage incorporation of substantial amounts of initially X-ray amorphous ZnO into the ceria lattice at high temperatures is not complete as suggested by standard XRD. Trace amounts of crystalline ZnO are still present within the material.
Conclusions
In summary, we have synthesized Zn-doped ceria nanocrystals that exhibit twice the OSC of pure ceria. It is shown by XPS that these materials are chemically inhomogeneous on the nanometer scale, with zinc enrichment at the surface. After annealing at 1300 °C the spatial distribution of zinc on the micrometer scale becomes also inhomogeneous. Our work also shows that a combination of commonly applied characterization techniques (such as room temperature XRD and TEM) is not sufficient to determine the correct phase composition of Zn-doped ceria after calcination at 500 °C. With in situ high temperature XRD, we are able to reveal the presence of substantial amounts of un-incorporated X-ray amorphous ZnO in the as-prepared samples. This amorphous ZnO crystallizes at 800 °C and is then incorporated in the ceria lattice at higher temperatures. However, this second-stage incorporation is not complete according to spatially resolved μ-XRD measurements using a combination of synchrotron radiation and micro-beam configuration. It is not clear whether the presence of X-ray amorphous dopant oxide after lower-temperature synthesis is specific to the Zn–O–Ce system. However, preliminary studies reveal similar observations for Cu-doped ceria: CuO forms at 800 °C and disappears irreversibly at higher temperatures. We thus suggest that caution be applied when one interprets XRD data to determine true phase composition of similar doped ceria materials. Interestingly, we have indications from TGA studies that the soot combustion activity of 20Zn is markedly enhanced after additional treatment with ~5 M hydrochloric acid, suggesting a detrimental effect of the un-incorporated X-ray amorphous ZnO in this specific case. Based on our findings, the catalytic activity of doped ceria can be influenced by an amorphous dopant phase possibly present after low-temperature calcination.Acknowledgements
This work was funded by the Indo Swiss Joint Research Program (grant #138852). The authors are grateful for the help of Dr. Elisabeth Müller, Ms. Irena Papachella and Mr. Andrea Wismer with TEM, synthesis and TGA studies, respectively. The authors acknowledge the Paul Scherrer Institute, Villigen, Switzerland for provision of synchrotron radiation beamtime at the MicroXAS beamline of SLS and would like to thank Dr. Camelia N. Borca, Dr. Daniel Grolimund and Dr. Vallerie Ann Samson for assistance. Fangjian Lin would also like to thank Ms. Christine Müller for support and interesting discussions.Notes and references
- Catalysis by Ceria and Related Materials, ed. A. Trovarelli, Imperia College Press, London, UK, 2002 Search PubMed.
- D. Wang, Y. Kang, V. Doan-Nguyen, J. Chen, R. Küngas, N. L. Wieder, K. Bakhmutsky, R. J. Gorte and C. B. Murray, Angew. Chem., Int. Ed., 2011, 50, 4378 CrossRef CAS PubMed.
- Q. Yuan, H.-H. Duan, L.-L. Li, Z.-X. Li, W.-T. Duan, L.-S. Zhang, W.-G. Song and C.-H. Yan, Adv. Mater., 2010, 22, 1475 CrossRef CAS PubMed.
- S. Carrettin, P. Concepcion, A. Corma, J. M. L. Nieto and V. F. Puntes, Angew. Chem., Int. Ed., 2004, 43, 2538 CrossRef CAS PubMed.
- D. A. J. M. Ligthart, R. A. van Santen and E. J. M. Hensen, Angew. Chem., Int. Ed., 2011, 50, 5306 CrossRef CAS PubMed.
- A. Bueno-Lopez, K. Krishna, M. Makkee and J. Moulijn, J. Catal., 2005, 230, 237 CrossRef CAS PubMed.
- L. Katta, P. Sudarsanam, G. Thrimurthulu and B. M. Reddy, Appl. Catal., B, 2010, 101, 101 CrossRef CAS PubMed.
- P. A. Kumar, M. D. Tanwar, N. Russo, R. Pirone and D. Fino, Catal. Today, 2012, 184, 279 CrossRef CAS PubMed.
- G. Qi and R. T. Yang, J. Catal., 2003, 217, 434 CrossRef CAS.
- M. Casapu, O. Kröcher and M. Elsener, Appl. Catal., B, 2009, 88, 413 CrossRef CAS PubMed.
- V. V. Kharton, F. M. Figueiredo, L. Navarro, E. N. Naumovich, A. V. Kovalevsky, A. A. Yaremchenko, A. P. Viskup, A. Carneiro, F. M. B. Marques and J. R. Frade, J. Mater. Sci., 2001, 36, 1105 CrossRef CAS.
- Y. Ma, X. Wang, S. Li, M. S. Toprak, B. Zhu and M. Muhammed, Adv. Mater., 2010, 22, 1640 CrossRef CAS PubMed.
- S. Abanades and G. Flamant, Sol. Energy, 2006, 80, 1611 CrossRef CAS PubMed.
- W. C. Chueh, C. Falter, M. Abbott, D. Scipio, P. Furler, S. M. Haile and A. Steinfeld, Science, 2010, 330, 1797 CrossRef CAS PubMed.
- P. Furler, J. R. Scheffe and A. Steinfeld, Energy Environ. Sci., 2012, 5, 6098 CAS.
- H. Inaba and G. Tagawa, Solid State Ionics, 1996, 83, 1 CrossRef CAS.
- K. Harada, T. Oishi, S. Hamamoto and T. Ishihara, J. Phys. Chem. C, 2014, 118, 559 CAS.
- B. M. Reddy, G. Thrimurthulu, L. Katta, Y. Yamada and S.-E. Park, J. Phys. Chem. C, 2009, 113, 15882 CAS.
- B. M. Reddy, L. Katta and G. Thrimurthulu, Chem. Mater., 2010, 22, 467 CrossRef CAS.
- S. Abanades, A. Legal, A. Cordier, G. Peraudeau, G. Flamant and A. Julbe, J. Mater. Sci., 2010, 45, 4163 CrossRef CAS.
- N. D. Petkovich, S. G. Rudisill, L. J. Venstrom, D. B. Boman, J. H. Davidson and A. Stein, J. Phys. Chem. C, 2011, 115, 21022 CAS.
- A. Le Gal and S. Abanades, J. Phys. Chem. C, 2012, 116, 13516 CAS.
- A. Gupta, U. V. Waghmare and M. S. Hegde, Chem. Mater., 2010, 22, 5184 CrossRef.
- A. N. Kehoe, D. O. Scanlon and G. W. Watson, Chem. Mater., 2011, 23, 4464 CrossRef CAS.
- R. Li, S. Yabe, M. Yamashita, S. Momose, S. Yoshida, S. Yin and T. Sato, Mater. Chem. Phys., 2002, 75, 39 CrossRef CAS.
- G. Avgouropoulos, M. Manzoli, F. Boccuzzi, T. Tabakova, J. Papavasiliou, T. Ioannides and V. Idakiev, J. Catal., 2008, 256, 237 CrossRef CAS PubMed.
- O. H. Laguna, M. A. Centeno, F. Romero-Sarria and J. A. Odriozola, Catal. Today, 2011, 172, 118 CrossRef CAS PubMed.
- S.-L. Zhong, L.-F. Zhang, L. Wang, W.-X. Huang, C.-M. Fan and A.-W. Xu, J. Phys. Chem. C, 2012, 116, 13127 CAS.
- K. Schmale, M. Daniels, A. Buchheit, M. Grünebaum, L. Haase, S. Koops and H.-D. Wiemhöfer, J. Electrochem. Soc., 2013, 160, F1081 CrossRef CAS PubMed.
| This journal is © The Royal Society of Chemistry 2015 |

