
Self-assembled hierarchical nanostructures of Bi2WO6 for hydrogen production and dye degradation under solar light†
Rajendra P.
Panmand
a,
Yogesh A.
Sethi
a,
Sunil R.
Kadam
a,
Mohaseen S.
Tamboli
a,
Latesh K.
Nikam
a,
Jalinder D.
Ambekar
a,
Chan-Jin
Park
*b and
Bharat B.
Kale
*a
aCentre for Materials for Electronics Technology (C-MET), Panchwati off Pashan Road, Pune-411 008, India. E-mail: bbkale@cmet.gov.in
bDepartment of Materials Science and Engineering, Chonnam National University, 77, Yongbongro, Bukgu, Gwangju 500-757, Korea. E-mail: parkcj@jnu.ac.kr
First published on 10th November 2014
Abstract
Three dimensional (3D) hierarchical nanostructures of orthorhombic Bi2WO6 with unique morphologies were successfully synthesized by a solvothermal method. The precursor concentration plays a key role in the architecture of the hierarchical nanostructures. A peony flower-like morphology was obtained at higher precursor concentrations, and a red blood cell (RBC)-like morphology with average diameter of 1.5 μm was obtained at lower concentrations. These hierarchical nanostructures were assembled by self-alignment of 20 nm nanoplates. As their band gap is in the visible region, the photocatalytic activity of the Bi2WO6 hierarchical nanostructures for the production of hydrogen from glycerol, and the degradation of rhodamine B (RhB) and methylene blue (MB) under ambient conditions in the presence of solar light was investigated. The Bi2WO6 with peony flower morphology was observed to be the most efficient photocatalyst (H2: 7.40 mmol h−1 g−1, kRhB: 0.240 and kMB: 0.100) of the reported nanostructures. The higher activity of the peony flowers was due to their porous nature, high surface area and lower band gap. Such unique 3D nanostructures of Bi2WO6 have been fabricated for the first time, and their use as photocatalysts in the production of hydrogen from glycerol has hitherto not been attempted. These nanostructures may have potential in ferroelectric, piezoelectric, pyroelectric and nonlinear dielectric applications.
1. Introduction
The large scale 2D and 3D self-assembly of nanostructured building blocks with interesting morphologies and tunable properties is of great interest to researchers. Materials scientists are not only investigating the properties of these assembled nanostructures, but are also studying their great potential for technological applications.1,2 Good progress has been made in the highly organized self-assembly of metals, semiconductors, and hybrid materials based on various driving mechanisms. However, it is still a great challenge to fabricate such nanostructured assemblies using reliable synthesis methods. Recently, many researchers have investigated such 2D and 3D hierarchical structures for a variety of applications.3–7 Such assemblies have tremendous scope in photocatalysis because of their high surface areas, and their optical and electronic properties. Currently, many researchers are investigating dye degradation and hydrogen production using such 2D and 3D hierarchical nanostructures. Such novel structures can be fabricated by a bottom-up technique, which requires highly tunable building blocks.Oxide semiconductors with Aurivillius structures are of immense importance due to their layered structures and unique properties.8 Among these semiconductors, Bi2WO6 is an n-type semiconductor, and is significant because of its excellent intrinsic physico-chemical properties. Bi2WO6 has been used as a photocatalyst for rhodamine B dye degradation by a few researchers.9,10,11a–c However, very limited studies on shape controlled Bi2WO6 and its associated photocatalytic activity have been performed, and 2D and 3D assemblies of Bi2WO6 have not been used in hydrogen production.
In the last few years, there has been exhaustive research toward the development of novel hydrogen production technologies based on renewable and natural assets, such as water and biomass.12–14 Our group has demonstrated hydrogen production from waste H2S.15–19 Among the various biomass resources for hydrogen production, glycerol (C3H8O3) is significant because huge amounts are produced as waste in the processing of vegetable oil.20 The world demand for glycerol is limited, and in response to the rapid increase in global biodiesel production, crude glycerol is rapidly becoming a uneconomical waste product because it is expensive to dispose of. Thus, current research is focused on developing new technologies for the utilization of glycerol. One promising possibility is to use glycerol as a renewable source of hydrogen. This is possible with the use of several methods, including photoinduced reforming of glycerol in the liquid phase.21,22 There are limited reports on hydrogen generation from the decomposition of glycerol. Photocatalytic reforming of aqueous solutions of glycerol under ambient conditions has been investigated, using Pt/TiO2, CuO/TiO2 and other photocatalysts under a simulated solar light source.23–26
In this context, we have fabricated hierarchical peony flower/bowl/red blood cell (RBC)-like Bi2WO6 nanostructures via a simple template-free solvothermal method for the first time. These nanostructures have been thoroughly characterized by XRD, FESEM, HRTEM, and UV-Vis spectroscopy. The formation mechanism and the effects of reaction time and precursor concentrations were also investigated. The nanostructures of Bi2WO6 were used as photocatalysts for the production of hydrogen from glycerol, which has hitherto not been attempted. Additionally, their performance in rhodamine B dye degradation under visible light irradiation was studied.
2. Experimental
All chemicals were analytical grade and used as received without further purification. In a typical case, a 90 mL aqueous solution, which was marked as solution A, was first prepared by dissolving 60 mmol Na2WO4 and 0.5 g polyvinylpyrrolidone (PVP) in distilled water, and then sonicating in an ultrasonic water bath for 30 min. At the same time, 100 mmol Bi(NO3)3·5H2O was dissolved in 90 mL acetic acid (CH3COOH) with vigorous stirring, and the resulting solution was marked as solution B. The mixture of solutions A and B was stirred until it become homogeneous. Then, the mixture was sealed in a Teflon-lined stainless steel autoclave. The autoclave was maintained at 150 °C for 18 h, and then cooled to room temperature naturally. A precipitate was obtained by centrifuging and sequentially washing with ethanol and distilled water several times, followed by drying at 65 °C for 6 h. Finally, nanostructured flowers/bowls/discs of Bi2WO6 were obtained by adjusting the experimental parameters (see Table 1). The phase purity of the products was characterized by XRD using a Bruker (D8). FESEM observations were performed using a Hitachi S-4800 microscope. Transmission electron microscopy (TEM) images and the corresponding selected area electron diffraction (SAED) patterns were obtained on a JEOL JEM-2010 instrument. The surface areas were measured using a Micromeritics (NOVA 4200e) analyzer. The nitrogen adsorption and desorption isotherms were obtained at 77 K. The Brunauer–Emmett–Teller (BET) surface areas were calculated from the linear parts of the BET plots. The room temperature UV-Vis absorption spectra were recorded on a Perkin Elmer λ-950 spectrophotometer in the wavelength range of 200–800 nm.| Sample | Reaction parameters of the solvothermal system | Concentration of Bi3+ and (WO4)2− |
|---|---|---|
| BWO-1 | Temp: 150 °C | 0.150 and 0.075 M |
| Time: 5 h | ||
| BWO-2 | Temp: 150 °C | 0.0375 and 0.019 M |
| Time: 18 h | ||
| BWO-3 | Temp: 150 °C | 0.075 and 0.038 M |
| Time: 18 h | ||
| BWO-4 | Temp: 150 °C | 0.150 and 0.075 M |
| Time: 18 h |
The apparatus used for the photocatalytic experiments consists of a simulated solar light source, a quartz photoreactor and an online analysis system. The lamp housing (Oriel) is furnished with a Xe arc lamp (Osram XBO 300 W), a set of lenses for light collection and focusing, and a water filter, which serves to eliminate infrared radiation. The photoreactor has a cylindrical shape, and its top cover has provisions for measuring solution pH and temperature, as well as connections for the carrier gas (argon) inlet/outlet. The gas outlet is equipped with a water-cooled condenser, which does not allow vapors to escape from the reactor. The outlet of the reactor is connected to a measuring cylinder in order to collect the gas, which is further used for analysis (gas chromatography).
The photocatalytic activities of the samples were evaluated for the degradation of rhodamine B (RhB) and methylene blue (MB) under visible light irradiation using the same lamp as mentioned above. In each experiment, 0.1 g of the photocatalyst was added to 600 mL of RhB and MB solution (1 × 10⁻⁵ and 1.6 × 10⁻⁵ M, respectively). Before illumination, the suspension was vigorously stirred in the dark for 1 h to ensure the establishment of an adsorption–desorption equilibrium between the photocatalyst and the dye. Then, the solution was exposed to visible light irradiation. At certain intervals, a 10 mL solution was sampled and centrifuged to remove the remnants of photocatalyst. Finally, the absorption UV-Vis spectrum of the filtrate was recorded using a λ-950 (Perkin Elmer) spectrophotometer.
3. Results and discussion
2D and 3D nanostructures of Bi2WO6 were successfully designed and synthesized by a facile solvothermal process. The effects of precursor concentration and reaction time on the morphology of the Bi2WO6 nanostructures were studied. The phase purity and optical properties of the nanostructures were also investigated thoroughly.3.1. Structural study
The structural properties of all synthesized samples were characterized by XRD. Fig. 1 shows the XRD patterns of the Bi2WO6 samples, i.e. BWO-1, BWO-2, BWO-3 and BWO-4, along with the standard JCPDS pattern. All bismuth tungstate samples show a unique well-crystalline phase (Fig. 1) with an orthorhombic structure with lattice parameters a = 0.5457 nm, b = 1.6436 nm, and c = 0.5438 nm (JCPDS 39-0256). The relative intensities of the various diffraction peaks are altered by the reaction conditions. The crystallinity of the Bi2WO6 increases with increasing precursor concentration and time. Moreover, most of the peaks observed in the diffraction patterns are in fact composed of several diffraction lines, and hence the Scherrer equation for the determination of crystallite size is hardly applicable. For better understanding and simplicity, the XRD pattern of a single sample (BWO-3) is provided in the ESI† (Fig. SI).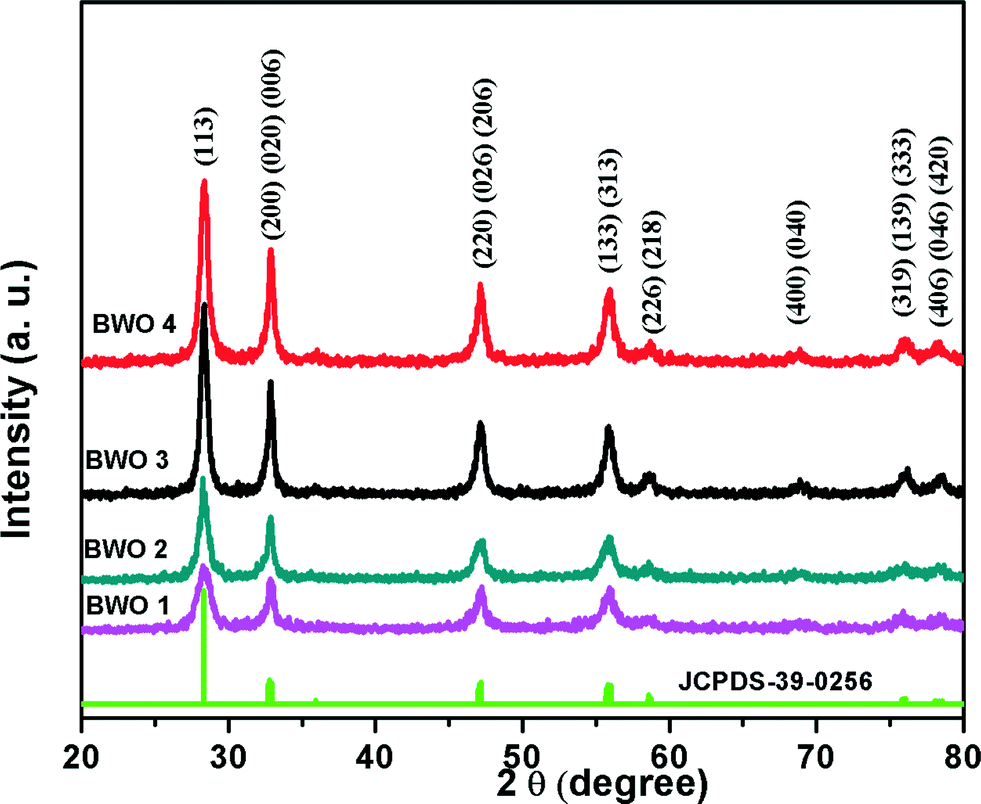 | ||
| Fig. 1 XRD patterns of Bi2WO6 nanostructures. | ||
3.2. Morphological study
In order to investigate the effect of reaction time on the morphology, controlled experiments were conducted using 0.15 M Bi(NO3)3·5H2O and 0.075 M Na2WO4·2H2O (in water and acetic acid (1![[thin space (1/6-em)]](https://www.rsc.org/images/entities/char_2009.gif) :1)) at 150 °C with reaction times of 5 h (BWO-1) and 18 h (BWO-4). Fig. 2 shows the FESEM images of the Bi2WO6 nanostructures obtained after different reaction times. After a 5 h reaction time, randomly distributed nanoplates were observed (Fig. 2a). The magnified image (Fig. 2b) clearly shows rectangular nanoplates of size 200 × 300 nm and with a thickness of a few nanometers. It also shows that the nanoplates self-assemble to form nanosheets (Fig. 2a). This is quite obvious because further growth along with organization of the nanoplates is observed under solvothermal conditions. On increasing the reaction time to 18 h, uniform peony flower-like hierarchical nanostructures were obtained (Fig. 2c & d). Under prolonged solvothermal conditions, strain develops in the long nanosheets, which creates curvature. These curved nanosheets self-organize further to confer peony flower-like Bi2WO6. As discussed above, each nanosheet is made up of tiny rectangular nanoplates of average size 200 × 300 nm (Fig. 2b) and thickness 20 nm. Peony flowers with uniform size (2 μm) were observed.
:1)) at 150 °C with reaction times of 5 h (BWO-1) and 18 h (BWO-4). Fig. 2 shows the FESEM images of the Bi2WO6 nanostructures obtained after different reaction times. After a 5 h reaction time, randomly distributed nanoplates were observed (Fig. 2a). The magnified image (Fig. 2b) clearly shows rectangular nanoplates of size 200 × 300 nm and with a thickness of a few nanometers. It also shows that the nanoplates self-assemble to form nanosheets (Fig. 2a). This is quite obvious because further growth along with organization of the nanoplates is observed under solvothermal conditions. On increasing the reaction time to 18 h, uniform peony flower-like hierarchical nanostructures were obtained (Fig. 2c & d). Under prolonged solvothermal conditions, strain develops in the long nanosheets, which creates curvature. These curved nanosheets self-organize further to confer peony flower-like Bi2WO6. As discussed above, each nanosheet is made up of tiny rectangular nanoplates of average size 200 × 300 nm (Fig. 2b) and thickness 20 nm. Peony flowers with uniform size (2 μm) were observed.
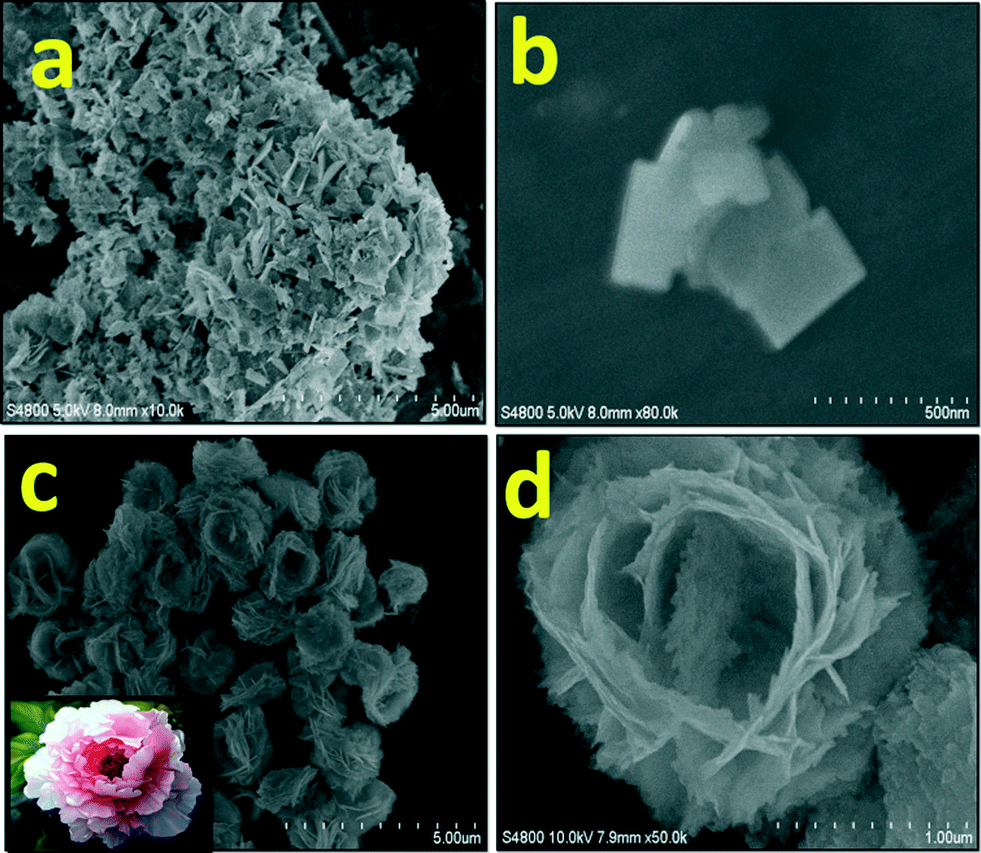 | ||
| Fig. 2 FESEM images of the Bi2WO6 nanostructures obtained at 150 °C using Bi3+ and (WO4)2− precursor concentrations of 0.15 and 0.075 M respectively, with reaction times of 5 h (a and b) and 18 h (c and d). | ||
Considering the formation of a unique flower-like morphology after 18 h at 150 °C, further experiments were performed at various precursor concentrations under the same solvothermal conditions. Surprisingly, different morphologies were obtained on varying the precursor concentrations.
Fig. 3 shows the FESEM images of Bi2WO4 obtained using different Bi3+ and (WO4)2− precursor concentrations in a water–acetic acid (1:1) solution system autoclaved at 150 °C for 18 h. Fig. 3a and b show FESEM images of uniform bowl-shaped Bi2WO6 nanostructures of size 1.5 μm obtained with Bi(NO3)3·5H2O and Na2WO4·2H2O precursor concentrations of 0.075 and 0.038 M, respectively. Here, nanoplates (width × length of 60 × 80 nm and thickness of 25 nm) form nanosheets by oriented attachment. These nanosheets are much smaller compared to the previously discussed peony flower-like structures. In this case, the nanosheets are not curved, due to their smaller size. Hence, there may be seeding at the centre and peripheral growth due to oriented attachment of the building blocks. The growth is slower at the centre than at the periphery, which ultimately creates a cavity at the centre. So, uniform size bowls (1.5 μm) are seen in the FESEM image (Fig. 3a), and the magnified image shows a single bowl with a cavity (Fig. 3b). Fig. 3c and d show FESEM images of uniform RBC-shaped Bi2WO6 nanostructures of size 1–1.5 μm obtained with Bi(NO3)3·5H2O and Na2WO4·2H2O precursor concentrations of 0.038 and 0.019 M, respectively. Surprisingly, at these concentrations, the FESEM image shows RBC-like nanostructures of Bi2WO6. As discussed above, the cells of 1.5 μm diameter are composed of a large quantity of two dimensional nanosheets created from rectangular nanoplates of 40 × 50 nm size. Again, the growth of these nanosheets originates at the centre and further growth occurs at the periphery. Hence, the growth is slightly slower at the centre, resulting in a dimple in the middle which looks like a red blood cell, as shown in the magnified FESEM image (Fig. 3d). Again, the nanosheets are stacked by oriented attachment, which is clearly revealed in the FESEM image (Fig. 3d).
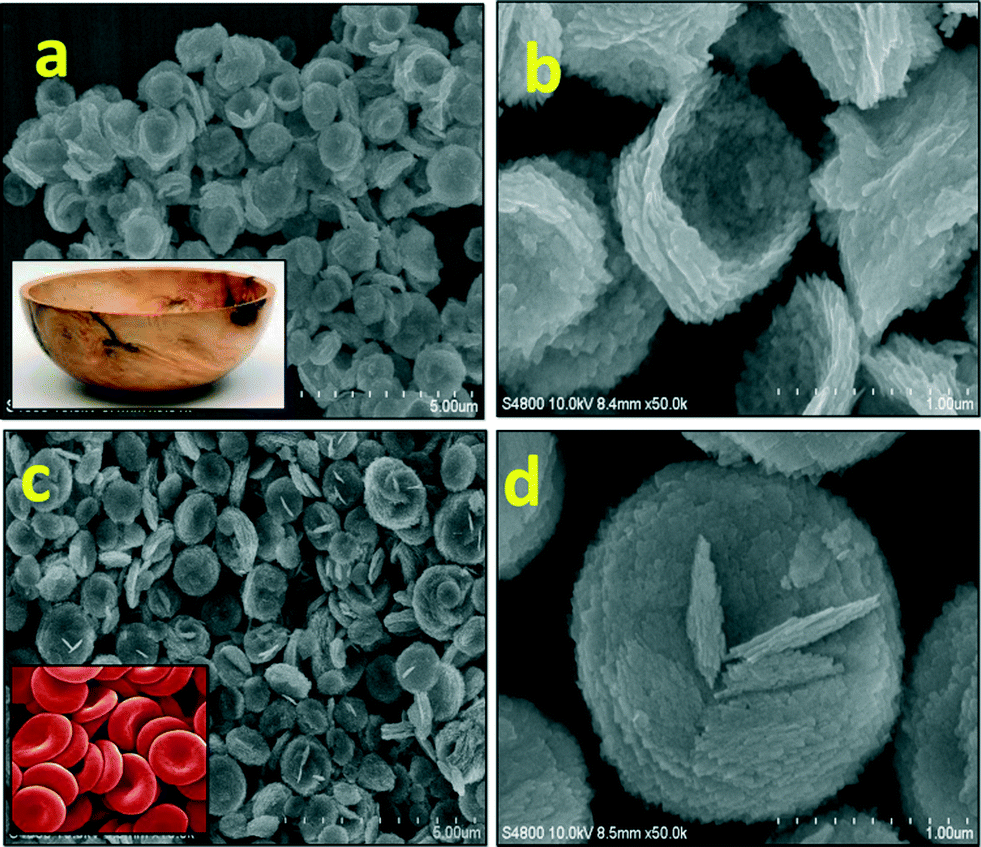 | ||
| Fig. 3 FESEM images of the Bi2WO6 nanostructures obtained at different Bi3+ and (WO4)2− precursor concentrations: (a, b) 0.075 and 0.0375 M respectively; (c, d) 0.0375 and 0.01875 M respectively. | ||
The red blood cell-like structure of Bi2WO6 was further investigated by TEM. Fig. 4 shows low and high magnification high resolution transmission electron microscopy (HRTEM) images. Fig. 4a presents the HRTEM image of an individual red blood cell. The light colour at the centre indicates that the Bi2WO6 disc has a pit in the middle, which is in accordance with the FESEM images (Fig. 3d). Fig. 4b shows the corresponding selected area electron diffraction (SAED) pattern of the red blood cell-like structure of Bi2WO6, which reveals that its structure is polycrystalline rather than a well-defined single crystal.
 | ||
| Fig. 4 HRTEM images of the Bi2WO6 nanostructures obtained at Bi3+ and (WO4)2− precursor concentrations of 0.0375 and 0.01875 M, respectively. (a) Low magnification image, (b) SAED pattern, (c) HRTEM image, and (d) enlarged image of the area marked by a red rectangle in Fig. 4c. | ||
Fig. 4c shows a typical HRTEM image of the edge of an individual RBC-like structure of Bi2WO6. Fig. 4d is a magnified image of the area marked by a red rectangle in Fig. 4c. Fig. 4d clearly reveals resolved lattice spacings of 0.272 and 0.194 nm, which correspond to the (020) and (220) planes of orthorhombic Bi2WO6, respectively. The observed SAED pattern is in good agreement with the XRD analysis.
3.3. Growth mechanism
In previous reports,27,28 two main crystal growth mechanisms for the formation of flower-like nanostructures were predicted. The first mechanism is based on a hierarchical assembly process. In this mechanism, tiny nanoplates form in the early stages, and then 2D nanosheets are formed by the oriented attachment of these nanoplates. The 2D sheets self-assemble into 3D hierarchical nanostructures.29,30 The second possible mechanism involves the cooperative effects of assembly and localized ripening. Initially, tiny nuclei are generated in the supersaturated solution, and further growth of the nanoparticles takes place over time. These newly formed nanoparticles spontaneously aggregate to minimize their surface energy. The nanoparticles further grow anisotropically along the 2D directions, resulting in the formation of nanoflakes. Finally, these flakes self-assemble to confer flower-like superstructures.9From the morphological studies using SEM and TEM analysis, it can be concluded that the formation of such intricate nanostructures is achieved via the first mechanism, i.e. a hierarchical assembly process, as illustrated in Fig. 5. Tiny Bi2WO6 nanoplates are formed in the early stages (Fig. 5B), followed by the oriented attachment of these building blocks into 2D nanosheets (Fig. 5C). Finally, self-assembly of the sheets gives rise to 3D hierarchical nanostructures (Fig. 5D). In our study, the formation of the primary Bi2WO6 nanoplates is a typical Ostwald ripening process. Initially, tiny nuclei are formed in a supersaturated solution, and then nanoparticles are formed by a well known crystal growth phenomenon. The larger particles grow at the cost of the smaller ones, as per the Gibbs–Thomson law.31 Further crystal growth resulting in the formation of 2D nanostructures is strongly related to the intrinsic crystal structure of Bi2WO6. It has been reported that orthorhombic Bi2WO6 is constructed from corner-sharing octahedral WO6 layers and [Bi2O2]2+ layers sandwiched between the octahedral WO6 layers.32 The layers are parallel to the (001) facets. On the basis of this structure, there should be equal numbers of octahedral W chains along the a- and b-axes, which indicates that the (200) and (020) facets have much higher chemical potentials in comparison with the other facets.33 As discussed previously,28 this feature leads to faster growth rates of the (200) and (020) facets, which exhibit preferential growth along the layers. As discussed above, rectangular Bi2WO6 nanoplates are formed after 5 h of reaction, and 3D nanostructures are formed after prolonged reaction times, i.e. 18 h (see Fig. 2).
 | ||
| Fig. 5 Schematic illustration of the growth process of Bi2WO6 hierarchical microspheres. | ||
During the formation of the hierarchical nanostructures via the assembly process, PVP plays an important role in the formation of integrated nanosheets and multilayered structures. It is generally believed that the building blocks for oriented aggregation/attachment are usually nanoparticles with surfaces stabilized by an organic coating, and weakly protected nanoparticles often undergo entropy-driven random aggregation.34,35 In the present work, it is believed that the selective adsorption of PVP onto various crystallographic planes of the Bi2WO6 nanoplates is significant in the initial growth stage. As evidenced by the TEM and SAED results, the assembled nanosheets/layers were constructed from tiny nanoplates, with their top and lateral surfaces enclosed by the (001), (020) and (220) planes, respectively. Thus, PVP should have stronger interactions with the (001) planes. In contrast, there is comparatively less adsorption on the (220) planes, and the PVP can be easily removed from these crystal planes. This results in preferential growth along the layers (a × b layer plane) rather than along the c-axis. In other words, the gradual enlargement of the 2D surface areas originates from the edge-to-edge assembly of the primary plates. Well-defined nanosheets are conferred on further organization of adjacent nanoplates to share the same 2D crystallographic orientation and subsequent coalescence of these building blocks. For the formation of 3D nanostructures, layer-by-layer growth may be favoured (Fig. 5). FESEM clearly shows the formation of flat multi-layered nanosheets by the stacking of in situ formed nanosheets along the [001] direction (Fig. 2a & b). This process could further reduce the surface energy of the nanosheets, and hence further stacking is facilitated by the special 2D geometrical shape. With a prolonged reaction time, instead of further growth of the nanosheets, organization of the existing nanosheets, originating from the centre, was observed. The centre develops a wrinkle, which may act as a template for further fabrication of hierarchical nanostructures. This specific growth may be due to lattice tension or surface interactions at the edges of the nanosheets.36 This type of growth, in which concaveness is observed along with stacking of the nanosheets, occurs in the case of the RBC structures. More new tilted nanosheets are added to the uneven nanosheets (acting as a template), which further enhances peripheral growth and restricts growth at the centre. Considering the above mechanism, the same phenomenon is applicable in the case of the growth of Bi2WO6 nanostructures (2D flat rectangular plates, RBC-like, 3D bowl-like, and hierarchical peony flower-like).
The concentration gradient (at a particular precursor concentration) under solvothermal conditions also plays an important role in the growth of hierarchical nano-microstructures.36,37a–c As discussed above, at low precursor concentration, RBC-like structures of Bi2WO6 were observed. At low concentration, the mobility of Bi3+ and (WO4)2− is low, which restricts the growth of nuclei. Hence, very thin nanosheets are formed during the reaction, even after prolonged reaction time. These nanosheets are self-organized and exhibit peripheral growth to create RBC-like structures. The oriented attachment of nanoplates is initiated by nanosheet seeds, which are situated at the centre, and hence restrict growth at the centre and favour growth at the periphery. Therefore, we observed a dimple at the centre of the RBC-like structure. At slightly higher precursor concentration, a bowl-like morphology is observed. Due to the higher concentration of precursors, the mobility of the ions increases, which favours the growth of the nanoplates. As discussed for the RBC-like structure, the peripheral growth increases further, leaving slow growth at the centre. Hence, bowl-like structures are observed. At even higher concentration, central as well as peripheral growth is observed. In this case, long nanosheets are formed due to the faster growth rate. However, after prolonged reaction time, curved nanosheets are formed due to the development of strain in the long nanosheets, which self-organize further to form peony flower-like structures.
3.4. Optical properties and photocatalytic performance
The optical properties of the peony flower, bowl and red blood cell-like Bi2WO6 nanostructures were investigated by UV-Vis absorption spectroscopy (Fig. 6). Tauc plots of the absorption spectra are shown in the inset of Fig. 6. It can be seen that all Bi2WO6 nanostructures have a steep absorption edge in the visible range, indicating that the absorption related to the band gap is due to the intrinsic transitions of the nanostructures.38 From the onset of the absorption edge, the band gap (Eg) of the red blood cell-like morphology of Bi2WO6 is estimated to be about 3.06 eV. This band gap value is slightly greater than the values for the peony flower-like (2.81 eV) and bowl-like (2.91 eV) morphologies of Bi2WO6. The wider band gap in the case of the RBC-like structure might be due to the smaller particle size as compared to the other nanostructures.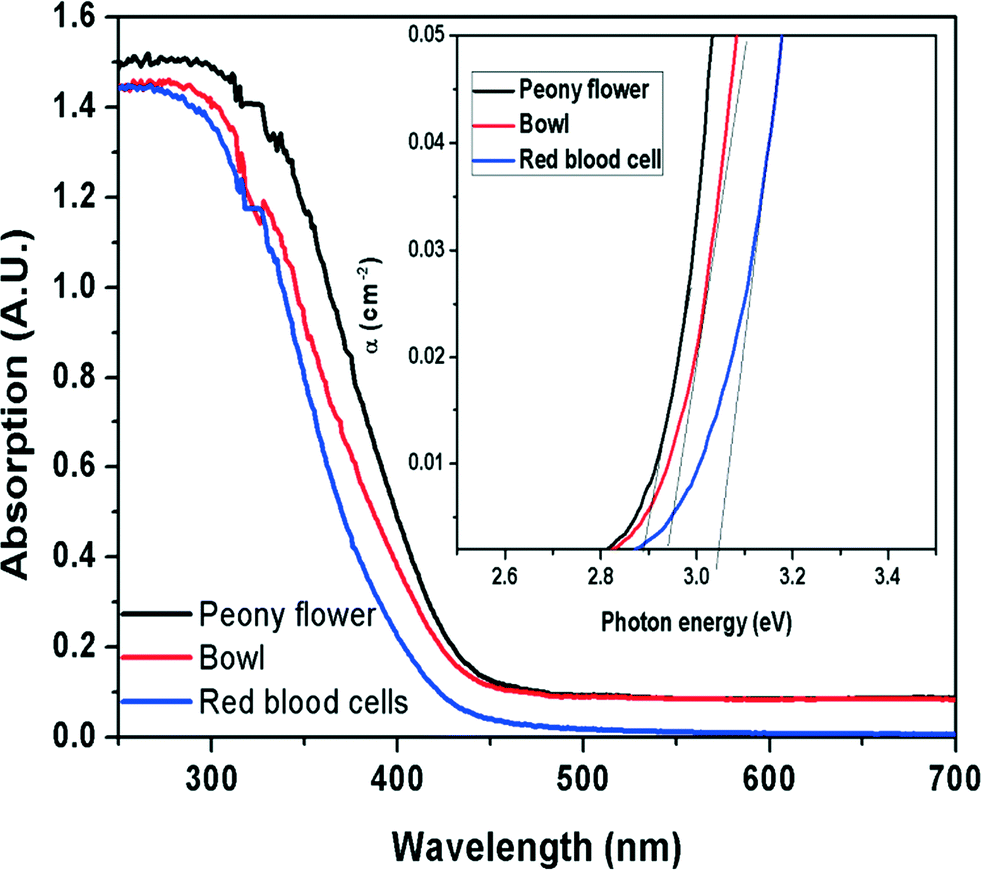 | ||
| Fig. 6 UV-Vis absorption spectra of peony flower, bowl and red blood cell-like nanostructures of Bi2WO6. Inset shows the Tauc plots of the corresponding absorption spectra. | ||
Photoluminescence studies are useful for investigation of the migration, transfer and recombination processes of photoinduced electron–hole pairs in a semiconductor because photoluminescence (PL) emission is mainly due to the recombination of these electron–hole pairs. The probability of charge carrier recombination increases with increasing PL intensity.39,40 A comparison of the PL spectra (excited at 350 nm) of peony flower, bowl and RBC-like Bi2WO6 at room temperature is shown in Fig. 7. The Bi2WO6 hierarchical nanostructures show a broad blue-green emission peak. The intense blue emission peak appearing at 450–470 nm is associated with the intrinsic luminescence of Bi2WO6. This is due to charge-transfer transitions between the Bi 6s and O 2p hybrid orbital (VB) to the empty W 5d orbital (CB) in WO62−.41a It is well known that doping, surface area, crystallite size and morphology affect the PL characteristics.41b,cFig. 7 reveals that the photoluminescence intensity of the peony flower-like nanostructures was quenched as compared with that of bowl and RBC-like Bi2WO6, which clearly indicates that the recombination of photogenerated charge carriers between the Bi 6s and O 2p hybrid orbital (VB) and the empty W 5d orbital is greatly affected by the different nanostructures. From the photoluminescence study, it is confirmed that the PL intensity decreases with increasing precursor concentration, which ultimately shows the suppression of charge carrier recombination. This could be due to the formation of a morphology with high surface area, which increases the number of surface defects. Hence, the quenching of the PL intensity observed in the case of the peony flower-like hierarchical structure is quite justified.
 | ||
| Fig. 7 Room temperature photoluminescence (PL) spectra of the as-prepared samples (λEx = 300 nm). | ||
3.5. Brunauer–Emmett–Teller (BET) analysis
Fig. 8 shows the nitrogen adsorption/desorption isotherms and pore size distribution curves (insets) of the peony flower (Fig. 8a), bowl (Fig. 8b) and red blood cell-like (Fig. 8c) Bi2WO6 nanostructures. The BET specific surface areas of the peony flower, bowl and red blood cell-like morphologies were observed to be 37.7, 33.4 and 32.1 m2 g−1, respectively. The insets of Fig. 8 show the Barrett–Joyner–Halenda (BJH) pore size distribution plots for the N2 sorption isotherms of the Bi2WO6 nanostructures. The BJH analysis showed that the resulting morphologies possessed mesopores with mean diameters of approximately 13.6, 14.3 and 16.3 nm for the peony flower, bowl and red blood cell-like morphologies, respectively (Fig. 8d and Table 2). Table 2 also lists the densities of the pores, which were approximately 2.92 × 10⁹, 2.30 × 10⁹ and 1.96 × 10⁹ g−1 for the peony flower, bowl and red blood cell-like morphologies, respectively.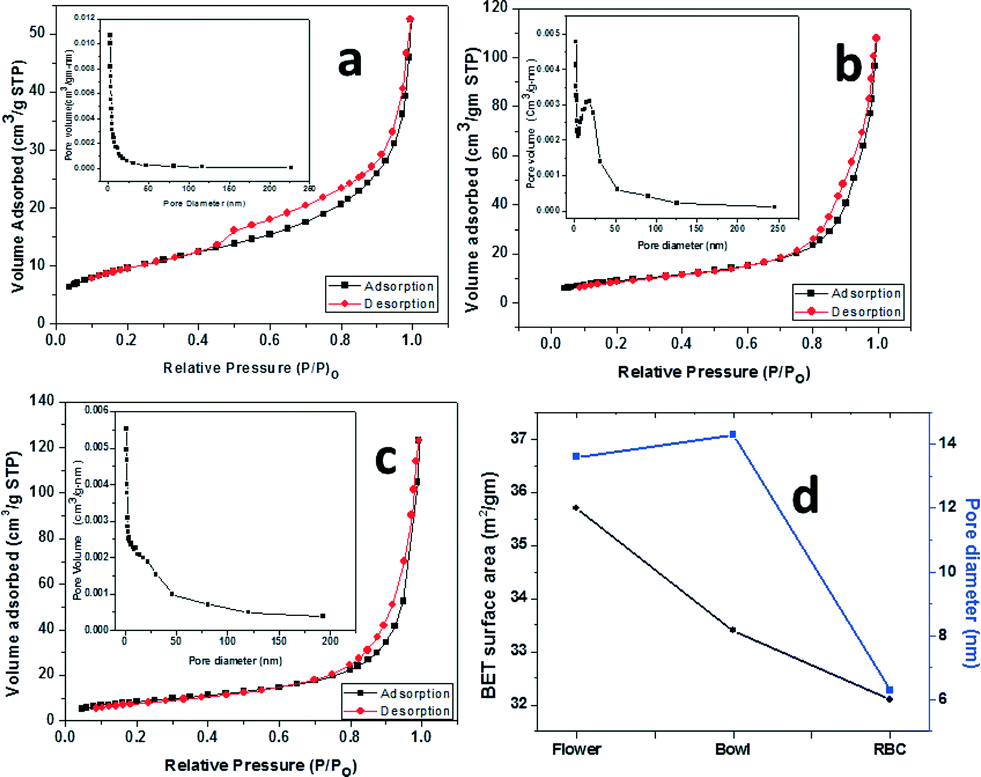 | ||
| Fig. 8 Nitrogen adsorption–desorption curves and pore size distribution isotherms of peony flower (a), bowl (b) and red blood cell-like (c) morphologies. (d) Morphology dependant surface are and pore size. | ||
| Morphology | Surface area (m2 g−1) by BET | Pore size (nm) by BJH | Pore density (g−1) × 109 |
|---|---|---|---|
| Peony flower | 37.7 | 13.6 | 2.92 |
| Bowl | 33.4 | 14.3 | 2.30 |
| Red blood cell | 32.1 | 16.3 | 1.96 |
3.6. Photocatalytic performance
 | ||
| Fig. 9 The effect of different catalysts on the photocatalytic degradation of MB (A) and RhB (B). | ||
| Bi2WO6 Catalyst | Rate constant (k) | |
|---|---|---|
| MB (kMB) | RhB (kRhB) | |
| RBC structure | 0.030 | 0.113 |
| Bowl structure | 0.036 | 0.135 |
| Peony flower structure | 0.100 | 0.240 |
The rate constants obtained for the different Bi2WO6 nanostructures indicate that their photocatalytic performances are strongly dependent on shape, size, and structure. Peony flower-like Bi2WO6 showed higher photocatalytic activity for the degradation of MB and RhB than bowl-like and red blood cell-like Bi2WO6, as shown in Fig. 9 and Table 3. The enhanced photocatalytic activity of hierarchical peony flower-like Bi2WO6 can be attributed to the combined effects of several factors: (1) the moderately high surface area of flower-like Bi2WO6 structures, which ultimately enhances light absorption and dye adsorption; (2) the presence of a larger number of pores, which can be considered as transport paths for the dye molecules on the framework walls;44 and (3) the porous peony flowers allow multiple reflections of visible light within the interior cavity, which facilitates more efficient use of the light.45
Fig. SII (ESI†) reveals the temporal evolution of the absorption spectra of aqueous solutions of MB and RhB in the presence of hierarchical Bi2WO6 under visible light irradiation (λ > 400 nm). Bi2WO6 is a strongly acidic oxide, which has great significance in photocatalytic dye degradation.46 The lowering of the valance band maxima indicates that Bi2WO6 has strong oxidizing power. The surface holes, hvb+, generated in the valence band will also have strong oxidizing power. Thus, thermodynamically, OH− ions (or H2O) in the solution can easily accept surface hvb+ and form OH˙ radicals (reaction 1), which ultimately aids the direct oxidation of MB in the bulk solution. Hence, the higher photocatalytic oxidation rate in the presence of Bi2WO6 has been ascribed to the generation of OH˙ radicals.
| OH− + hvb+ → OH˙ + H+ | (1) |
The strong RhB absorption band located at 554 nm is due to the presence of four ethylated groups (–C2H5) attached to the heterocyclic ring structure.47 A regular decrease in the RhB absorption at 554 nm under visible light irradiation is observed, accompanied by a shift of the absorption peak to lower wavelength. This shift may be attributed to the dye's de-ethylation, i.e. conversion of N,N,N′,N′-tetraethylated rhodamine to rhodamine. The intermediates formed successively presented different maximum absorption bands, i.e. N,N,N-triethylated rhodamine: 539 nm; N,N-diethylated rhodamine: 522 nm; N-ethylated rhodamine: 510 nm; and rhodamine: 498 nm.48 Also, the colour of the dye solution changed from red to a light greenish yellow and then to colourless, which can be visualised easily, indicating the complete photocatalytic degradation of the aqueous RhB solution during the reaction. It has been reported that the mechanism of degradation of RhB involves a photocatalytic process, as well as a photosensitized process. During the degradation process, Bi2WO6 acts as an active photocatalyst, and RhB is degraded by direct interaction with a strong oxidizing hole originating from the hybridization of the Bi 6s and O 2p orbitals.49,50 The RhB molecules are attacked and then degraded via the destruction of the conjugated structure. At the same time, during the photosensitized process, the RhB dye can absorb visible light, which is attributed to the ground state and excited state of the dye. The dye mineralization originates from the active oxygen species, O2−, and the radical cations, dye+. The photosensitized degradation of RhB is commonly accomplished via the N-demethylation process.50,51
:1) mixtures under visible light irradiation. Fig. 10 shows the effect of morphology on photocatalytic hydrogen evolution from the glycerol and water mixture. Maximum hydrogen generation, i.e. 7.4 mmol h−1 g−1, was observed for peony flower-like Bi2WO6, and hydrogen generations of 7.2 mmol h−1 g−1 and 4.8 mmol h−1 g−1 were observed for bowl-like and red blood cell-like Bi2WO6, respectively. Peony flower-like Bi2WO6 has a higher hydrogen evolution rate than bowl and red blood cell-like Bi2WO6, which may be due to the high surface area. The reason for the enhanced photocatalytic activity has already been described in the previous section.
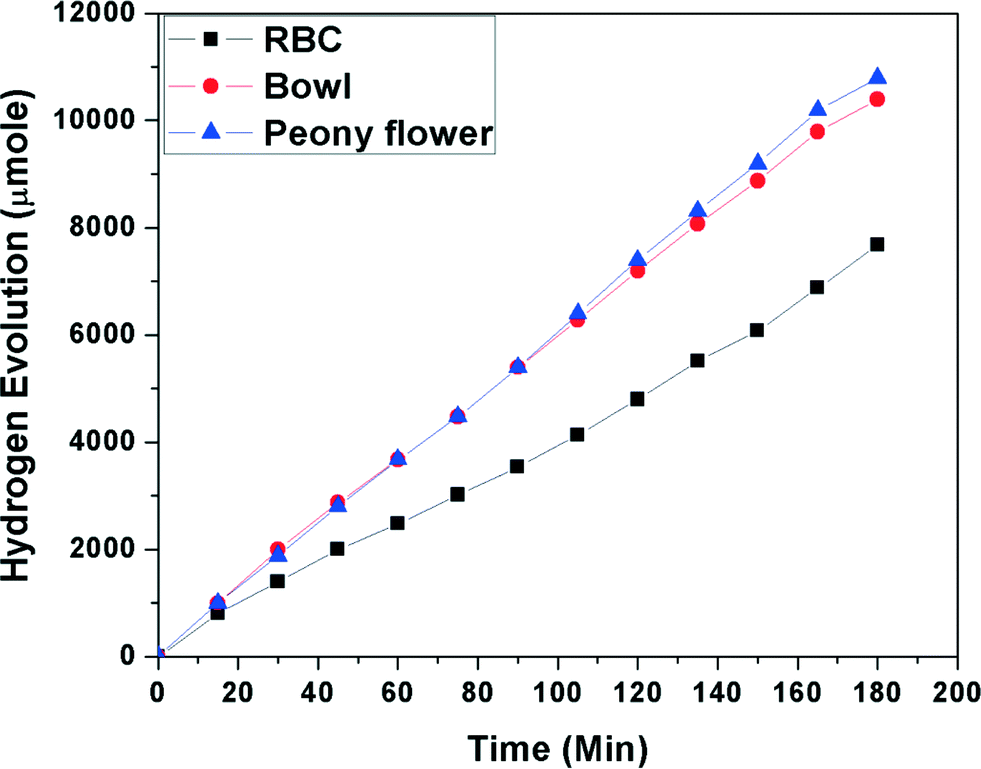 | ||
| Fig. 10 Hydrogen production as a function of irradiation time in the presence of Bi2WO6. | ||
The photocatalytic production of hydrogen from a glycerol–water mixture involves two distinct mechanisms, that is, photo-splitting of water and photo-reforming of glycerol.52 First, glycerol is oxidized, and then several intermediate compounds are produced, followed by the generation of hydrogen as the product. Second, glycerol acts as a sacrificial agent in photocatalytic water splitting.53 Glycerol, which acts as a sacrificial electron donor, is able to rapidly remove the photo-generated holes (hydroxyl radicals) and/or photo-generated oxygen in an irreversible fashion, thereby suppressing electron–hole recombination and/or the reverse reaction of H2 and O2. By doing so, glycerol is progressively oxidized to CO2, with the intermediate formation of partially oxidized products. When complete oxidation of glycerol (and the reaction intermediates) is achieved, oxygen can no longer be removed from the photocatalyst surface, and the rate of hydrogen production drops to a steady-state value comparable to that observed in solution in the absence of glycerol.
The overall process, which may be described as photo-induced reforming of glycerol at room temperature, can be expressed by the following equation:
| C3H8O3 + 3H2O → 3CO2 + 7H2 | (2) |
As per this reaction, H2 and CO2 are formed in the degradation of glycerol, which shows that efficient production of hydrogen is possible. Overall, the peony flower-like nanostructure of Bi2WO6 showed excellent photocatalytic activity.
4. Conclusions
In summary, we have successfully prepared peony flower, bowl, and red blood cell-like nanostructured Bi2WO6via a simple, rapid, economical, and efficient solvothermal process. The study showed that PVP and precursor concentration played important roles in the formation of these nanostructures. FESEM and HRTEM showed the formation of Bi2WO6 architectures, which was due to the well-known Ostwald ripening process. The energy band structures and high BET surface areas are responsible for the excellent photocatalytic activities for the degradation of MB and RhB under visible light irradiation of the peony flower, bowl, and red blood cell-like Bi2WO6. Peony flower-like Bi2WO6 showed higher photocatalytic activity in glycerol degradation for hydrogen production, and MB and RhB dye degradation than bowl and red blood cell-like Bi2WO6. The controlled experiments showed that the morphology significantly affects the photocatalytic efficiency, due to surface defects.Acknowledgements
The authors would like to thank the Executive Director, C-MET, Pune (DeitY, New Delhi) for technical support and also support of MSIP (Ministry of Science, ICT & future planning), Korea through Brain Pool program.Notes and references
- W. F. Shangguan and A. Yoshida, J. Phys. Chem. B, 2002, 106, 12227 CrossRef CAS.
- R. P. Panmand, R. H. Patil, B. B. Kale, L. K. Nikam, M. V. Kulkarni, D. K. Thombre, W. N. Gade and S. W. Gosavi, RSC Adv., 2014, 4, 4586–4595 RSC.
- Q. Zhang, D. Xu, X. Zhou, X. Wu and K. Zhang, Small, 2014, 10, 935 CrossRef CAS PubMed.
- S. Lopez-Orozco, A. Inayat, A. Schwab, T. Selvam and W. Schwieger, Adv. Mater., 2011, 23, 2602 CrossRef CAS PubMed.
- J. Liu and X. W. Liu, Adv. Mater., 2012, 24, 4097 CrossRef CAS PubMed.
- M. Ye, H. Y. Liu, C. Lin and Z. Lin, Small, 2013, 9, 312 CrossRef CAS PubMed.
- Y. Li, Z. Y. Fu and B. L. Su, Adv. Funct. Mater., 2012, 22, 4634 CrossRef CAS.
- Y. Tsunoda, W. Sugimoto and Y. Sugahara, Chem. Mater., 2003, 15, 632 CrossRef CAS.
- L. Zhang, W. Wang, L. Zhou and H. Xu, Small, 2007, 3, 1618 CrossRef CAS PubMed.
- D. N. Ke, T. Y. Peng, L. Ma, P. Cai and K. Dai, Inorg. Chem., 2009, 48, 4685 CrossRef CAS PubMed.
- (a) J. Wu, F. Duan, Y. Zheng and Y. J. Xie, J. Phys. Chem. C, 2007, 111, 12866 CrossRef CAS; (b) J. Huang, G. Tan, A. Xiao, H. Ren and L. Zang, Res. Chem. Intermed., 2014, 40, 903 CrossRef CAS PubMed; (c) J. A. Turner, Science, 2004, 305, 972 CrossRef CAS PubMed; (d) J. Zhu, J.-G. Wang, Z.-F. Bian, F.-G. Cao and G.-X. Li, Res. Chem. Intermed., 2009, 35, 799 CrossRef CAS PubMed.
- J. A. Turner, Science, 2004, 305, 972 CrossRef CAS PubMed.
- X. Chen, C. Li, M. I. Gratzel, R. Kostecki and S. S. Mao, Chem. Soc. Rev., 2012, 41, 7909 RSC.
- H. Tong, S. Ouyang, Y. Bi, N. Umezawa, M. Oshikiri and J. Ye, Adv. Mater., 2012, 24, 229 CrossRef CAS PubMed.
- B. B. Kale, J. O. Baeg, S. M. Lee, H. Chang, S. J. Moon and C. W. Lee, Adv. Funct. Mater., 2006, 16, 1349 CrossRef CAS.
- S. K. Apte, S. N. Garaje, G. P. Mane, A. Vinu, S. D. Naik, D. P. Amalnerkar and B. B. Kale, Small, 2011, 7, 957 CrossRef CAS PubMed.
- N. S. Chaudhari, A. P. Bhirud, R. S. Sonawane, L. K. Nikam, S. S. Warule, V. H. Rane and B. B. Kale, Green Chem., 2011, 13, 2500 RSC.
- N. S. Chaudhari, S. S. Warule, S. A. Dhanmane, M. V. Kulkarni, M. Valant and B. B. Kale, Nanoscale, 2013, 5, 9383 RSC.
- S. A. Mahapure, P. K. Palei, L. K. Nikam, R. P. Panmand, J. D. Ambekar, S. K. Apte and B. B. Kale, J. Mater. Chem. A, 2013, 1, 12835 CAS.
- F. Ma and M. A. Hanna, Bioresour. Technol., 1999, 70, 1 CrossRef CAS.
- R. R. Davda, J. W. Shabaker, G. W. Huber, R. D. Cortright and J. A. Dumesic, Appl. Catal., B, 2005, 56, 171 CrossRef CAS PubMed.
- N. Luo, X. Fu, F. Cao, T. Xiao and P. P. Edwards, Fuel, 2008, 87, 3483 CrossRef CAS PubMed.
- V. M. Daskalaki and D. I. Kondarides, Catal. Today, 2009, 144, 75 CrossRef CAS PubMed.
- D. I. Kondarides, V. M. Daskalaki, A. Patsoura and X. E. Verykios, Catal. Lett., 2008, 122, 26 CrossRef CAS.
- M. Bowker, P. R. Davies and L. S. Al-Mazroai, Catal. Lett., 2009, 128, 253 CrossRef CAS.
- N. Luo, Z. Jiang, H. Shi, F. Cao, T. Xiao and P. P. Edwards, Int. J. Hydrogen Energy, 2009, 34, 125 CrossRef CAS PubMed.
- D. K. Ma, S. M. Huang, W. X. Chen, S. W. Hu, F. F. Shi and K. L. Fan, J. Phys. Chem. C, 2009, 113, 4369 CAS.
- C. Zhang and Y. F. Zhu, Chem. Mater., 2005, 17, 3537 CrossRef CAS.
- S. B. Betzler, A. Wisnet, B. Breitbach, C. Mitterbauer, J. Weickert, L. Schmidt-Mende and C. Scheu, J. Mater. Chem. A, 2014, 2, 12005 CAS.
- F. Amano, K. Nogami, R. Abe and B. Ohtan, J. Phys. Chem. C, 2008, 112, 9320–9326 CAS.
- M. Perez, Scr. Mater., 2005, 52, 709 CrossRef CAS PubMed.
- N. Kim, R.-N. Vannier and C. P. Grey, Chem. Mater., 2005, 17, 1952–1958 CrossRef CAS.
- S. H. Yu, B. Liu, M. S. Mo, J. H. Huang, X. M. Liu and Y. T. Qian, Adv. Funct. Mater., 2003, 13, 639 CrossRef CAS.
- Z. Zhang, H. Sun, X. Shao, D. Li, H. Yu and M. Han, Adv. Mater., 2005, 17, 42 CrossRef CAS.
- M. Rycenga, C. M. Cobley, J. Zeng, W. Li, C. H. Moran, Q. Zhang, D. Qin and Y. Xia, Chem. Rev., 2011, 111, 3669 CrossRef CAS PubMed.
- Y. Li, J. Liu, X. Huang and G. Li, Cryst. Growth Des., 2007, 7, 1350 CAS.
- (a) S. Bharathi, D. Nataraj, M. Seetha, D. Mangalaraj, N. Ponpandian, Y. Masuda, K. Senthil and K. Yong, CrystEngComm, 2010, 12, 373 RSC; (b) L. Zhang, L. Chou and X. Li, CrystEngComm, 2013, 15, 10579 RSC; (c) T. Zhang, W. Dong, M. Keeter-Brewer, S. Konar, R. N. Njabon and Z. Ryantian, J. Am. Chem. Soc., 2006, 128, 10960 CrossRef CAS PubMed.
- J. W. Tang, Z. G. Zou and J. H. Ye, J. Phys. Chem. B, 2003, 107, 14265 CrossRef CAS.
- K. Fujihara, S. Izumi, T. Ohno and M. J. Matsumura, J. Photochem. Photobiol., A, 2000, 132, 99–104 CrossRef CAS.
- J. W. Tang, Z. G. Zou and J. H. J. Ye, J. Phys. Chem. B, 2003, 107, 14265 CrossRef CAS.
- (a) Q. Xiao, J. Zhang, C. Xiao and X. K. Tan, Catal. Commun., 2008, 9, 1247 CrossRef CAS PubMed; (b) J. Liqiang, Q. Yichun, W. Baiqi, L. Shudan, J. Baojiang, Y. Libin, F. Wei, F. Honggang and S. Jiazhong, Sol. Energy Mater. Sol. Cells, 2006, 90, 1773 CrossRef PubMed; (c) J. Wan, Z. Wang, X. Chen, L. Mu and Y. Qian, J. Cryst. Growth, 2005, 284, 538 CrossRef CAS PubMed.
- Z. Liu, F. Chen, Y. Gao, Y. Liu, P. Fang and S. Wang, J. Mater. Chem. A, 2013, 1, 7027 CAS.
- G. Zhao, S. Liu, Q. Lu and L. Song, Ind. Eng. Chem. Res., 2012, 51, 10307 CrossRef CAS.
- C. Mao, M. Li, Z. Fang, F. Meng, X. Qu, Y. Liu, M. Wang, J. Zhang, Z. Shib and X. Guo, RSC Adv., 2013, 3, 6631 RSC.
- X. X. Yu, J. G. Yu, B. Cheng and M. Jaroniec, J. Phys. Chem. C, 2009, 113, 17527 CAS.
- T. Saison, N. Chemin, C. Chanéac, O. Durupthy, V. Ruaux, L. Mariey, F. Maugé, P. Beaunier and J. P. Jolivet, J. Phys. Chem. C, 2011, 115, 5657 CAS.
- S. Obregón Alfaro and A. Martínez-de la Cruz, Appl. Catal., A, 2010, 383, 128 CrossRef PubMed.
- T. Wu, G. Liu, J. Zhao, H. Hidaka and N. Serpone, J. Phys. Chem. B, 1998, 102, 5845 CrossRef CAS.
- Y. Zhang, N. Zhang, Z. R. Tang and Y. J. Xu, Chem. Sci., 2013, 4, 1820 RSC.
- H. Fu, C. Pan, W. Yao and Y. Zhu, J. Phys. Chem. B, 2005, 109, 22432 CrossRef CAS PubMed.
- X. Zhao, T. Xu, W. Yao, C. Zhang and Y. Zhu, Appl. Catal., B, 2007, 72, 92 CrossRef CAS PubMed.
- J. Jitputti, Y. Suzuki and S. Yoshikawa, Catal. Commun., 2008, 9, 1265 CrossRef CAS PubMed.
- V. Gombac, L. Sordelli, T. Montini, J. J. Delgado, A. Adamski, G. Adami, M. Cargnello, S. Bernal and P. Fornasiero, J. Phys. Chem. A, 2010, 114, 3916 CrossRef CAS PubMed.
Footnote |
| † Electronic supplementary information (ESI) available. See DOI: 10.1039/c4ce01968g |
| This journal is © The Royal Society of Chemistry 2015 |