
 Open Access Article
 This Open Access Article is licensed under a
 Creative Commons Attribution 3.0 Unported Licence
Wavelength-dependent optoacoustic imaging probes for NMDA receptor visualisation†
Neil
Sim
a,
Sven
Gottschalk
b,
Robert
Pal
a,
Martina
Delbianco
a,
Oleksiy
Degtyaruk
b,
Daniel
Razansky
bc,
Gil G.
Westmeyer
bde,
Vasilis
Ntziachristos
bf,
David
Parker
*a and
Anurag
Mishra
*b
aDepartment of Chemistry, Durham University, South Road, Durham DH1 3LE, UK. E-mail: david.parker@durham.ac.uk
bInstitute for Biological and Medical Imaging, Helmholtz Zentrum München, Neuherberg 85764, Germany. E-mail: anurag.mishra@helmholtz-muenchen.de
cSchool of Medicine, Technische Universität München (TUM), Munich 80333, Germany
dInstitute of Developmental Genetics, Helmholtz Zentrum, Neuherberg 85764, Germany
eDepartment of Nuclear Medicine, Technische Universität München, Munich 80333, Germany
fChair for Biological Imaging, Technische Universität München, Munich 80333, Germany
First published on 26th August 2015
Abstract
The cellular localisation and binding specificity of two NMDAR-targeted near-IR imaging probes has been examined by microscopy, followed by exemplification of MSOT to monitor simulated glutamate bursts in cellulo and a preliminary study in mice observing the signal in the brain.
Glutamate (Glu) is an important excitatory chemical messenger in the central nervous system (CNS), involved in many signalling functions between neurons. Its release from synaptic vesicles to the synaptic cleft is stimulated by electrically induced calcium influx into the presynaptic terminal and its effects are induced following binding to postsynaptic receptors.1,2 Ionotropic N-methyl-D-aspartate receptors (NMDARs) are widely localised on the postsynaptic cell membrane and play a crucial role in impaired neural circuit operations that incite many devastating phenomena of the brain.1,2 Slight disturbances in the NMDAR signalling pathway may lead to neuropsychiatric pathologies such as schizophrenia, Alzheimer's disease, and certain mood disorders.3,4
Multi-spectral optoacoustic tomography (MSOT) is a non-invasive method that applies multi-wavelength illumination to identify the spectral signatures of any absorbers of interest.5,6 MSOT has a penetration of several cm into living tissue,5 high spatial resolution (100 μm independent of photon scattering), ultrasensitive detection of intrinsic tissue chromophores and probes (nM), as well as real-time imaging capability.6 However, MSOT will only develop beyond addressing haemodynamic changes,7 if tailored optoacoustic (OA) imaging probes can be devised. Here, we introduce OA imaging probes that bind selectively to NMDARs and non-invasively can track concentration changes of Glu in tissue with good sensitivity and spatio-temporal resolution.
This approach may not only be used to image receptor density but also may allow sensing of Glu concentration changes via MSOT. We have developed two NMDAR-targeted imaging probes, L1 and L2 (Scheme 1) for MSOT. These probes are based on a heptamethine cyanine dye, conjugated to both competitive and non-competitive antagonists for selective NMDAR-tagging. Receptor targeting via an antagonist-based approach is promising, as the receptors do not normally get internalised into cells via receptor mediated endocytosis.8 Recently, the non-competitive antagonist, Ifenprodil,9 has been conjugated to a red-fluorescent pentamethine cyanine dye10 and an NMDAR antagonist has been linked to a Gd complex to create an MRI probe11 for selective NMDAR imaging.
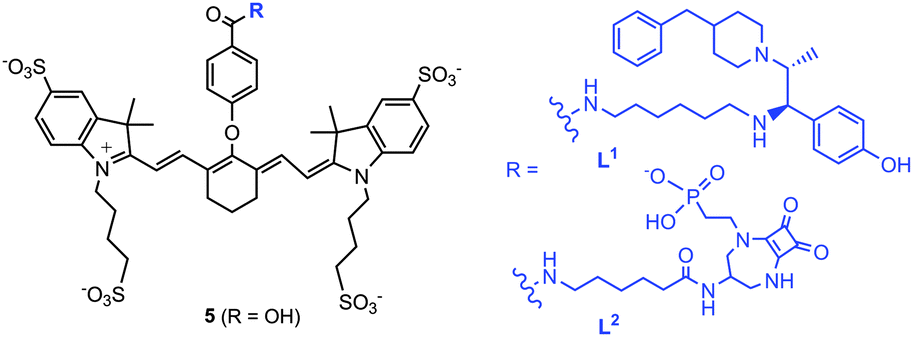 | ||
| Scheme 1 OA imaging probes for NMDAR-tagging. | ||
The core heptamethine cyanine dye precursor 5 (Scheme 1) is well suited as a strongly absorbing chromophore for use in MSOT. The synthesis began with construction of the heterocyclic indole ring, via quaternary ammonium salt formation and condensation (Scheme S1, ESI†). The amine precursors 10/12 were made using standard methodology, via alkylation, mesylation–amination, coupling, amide formation, and protection steps (Schemes S2 and S3, ESI†). L1 and L2 were obtained by coupling the amine 10/12 and the mono-acid, 5, [HATU/DIPEA] in anhydrous DMF (Scheme S4, ESI†).
The presence of the negatively charged sulfonate groups reduces non-specific binding to endogenous proteins.12 The absorption spectra of each probe showed broad absorption bands centred at 776 nm, with a secondary band at 712 nm (Scheme S4, ESI†). The optoacoustic signal of L1 and L2 replicate the absorption spectra in aqueous solution (Scheme S4, ESI†).
The extinction coefficient of each dye at 776 nm was 240![[thin space (1/6-em)]](https://www.rsc.org/images/entities/char_2009.gif) 000 M−1 cm−1, consistent with an intense π → π* (0 → 0 vibronic) transition. The shoulder at 712 nm is also π → π* mode, relating to the 0 → 1 or 0 → 2 vibronic transitions.13 These absorption properties makes them excellent candidates as NMDAR-targeted probes for MSOT, with the maximum wavelength of absorption falling in the near-infrared (NIR) window where the majority of endogenous chromophores do not strongly absorb. In this region, light scattering is relatively low resulting in greater light penetration, allowing images to be obtained from deeper within the body. The emission spectra of L1 and L2 were measured (λexc 776 nm) and were structurally the same, with one main emission band at 801 nm, giving a Stokes' shift of 25 nm (Scheme 1). The quantum yields (5–10%) fell in the range of similar dye structures.14
000 M−1 cm−1, consistent with an intense π → π* (0 → 0 vibronic) transition. The shoulder at 712 nm is also π → π* mode, relating to the 0 → 1 or 0 → 2 vibronic transitions.13 These absorption properties makes them excellent candidates as NMDAR-targeted probes for MSOT, with the maximum wavelength of absorption falling in the near-infrared (NIR) window where the majority of endogenous chromophores do not strongly absorb. In this region, light scattering is relatively low resulting in greater light penetration, allowing images to be obtained from deeper within the body. The emission spectra of L1 and L2 were measured (λexc 776 nm) and were structurally the same, with one main emission band at 801 nm, giving a Stokes' shift of 25 nm (Scheme 1). The quantum yields (5–10%) fell in the range of similar dye structures.14
The in cellulo studies were performed on differentiated NSC-34 cells expressing receptor subunits NMDAR-2B and NMDAR-1 at high densities, as shown earlier.11,15 None of these probes exhibited significant cytotoxicity after 24 h (MTT), at concentrations of up to 100 μM. To determine the live cell-surface co-localisation profile of L1 and L2, two optical microscopic techniques were explored to visualise NMDARs on live neuronal cells (NSC-34). The probes were first visualised upon cell surface NMDARs-tagging using epifluorescence microscopy following direct excitation (λexc > 750 nm). Differentiated NSC-34 cells expressing NMDARs were incubated with the probes [5 (as a control), L1 or L2 (10 μM, 30 min)] and then washed with Hank's balanced salt solution (HBSS) to remove unbound probe. L1 and L2 showed complete NMDAR-probe visualisation in fluorescence mode (Fig. S3, ESI†). Larger signal intensity was detected from cells treated with L1, suggesting a higher receptor affinity. No signal was obtained from cells upon incubation with the control dye 5, consistent with specific binding of L1 and L2 on the NMDARs (Fig. S3, ESI†).
A second microscopic technique was used to confirm that the probes were at the cell surface. Using a FRET-based assay, L1 and L2 were acceptors, excited by a non-internalised Eu(III) complex16 [Eu·L]3− (Fig. 1), as the donor. Excitation of [Eu·L]3− at 365 nm led to population of the dye excited state. Spectral overlap of the ΔJ = 4 emission band of the donor with the absorption spectrum of the acceptor led to excitation of L1 and L2, indicating donor and acceptor in close proximity (Fig. 1). Emission from the acceptor was also observed above 780 nm.
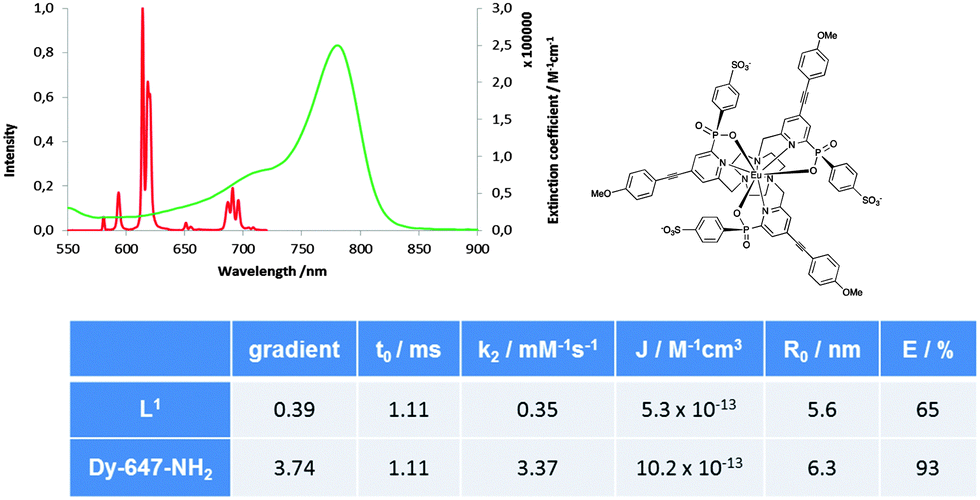 | ||
| Fig. 1 L1 dye absorption (green) and [Eu·L]3− emission (red) spectra, (H2O, pH 7.2, 295 K). Table: quenching studies for [Eu·L]3− with L1 or Dy-647-NH2 as acceptor. (data (±5%), 295 K, 50 mM HEPES, 50 mM NaCl, pH 7.4; λex 332 nm). Weak Eu transitions at 750 and 800 nm (ΔJ = 5 and ΔJ = 6 manifolds) are not shown. | ||
A study of the energy transfer process was first performed in vitro to confirm this possibility. As a reference NIR dye, the commercially available Dy-647-NH2 was chosen as the acceptor. Changes in the [Eu·L]3− emission lifetime were monitored as a function of the concentration of NIR dyes [L1 and Dy-647-NH2]. Stern–Volmer analysis showed 65% energy transfer efficiency between [Eu·L]3− and L1, less than that calculated for Dy-647-NH2 (93%), due to reduced spectral overlap (Fig. 1). The differentiated NSC-34 cells were incubated with a 10 μM solution of either L1 or L2 for 30 minutes and washed to remove unbound probe. The cells were treated with fresh buffer containing 20 μM of [Eu·L]3−, and imaged using a modified Zeiss Axiovert 200M inverted microscope.17 Excitation at 365 nm and observation of the time-gated emission (6 μs delay) above 780 nm demonstrated that both L1 and L2 gave rise to a localisation profile at the cell surface (Fig. 2B and D), with L1 appearing to label the cells more readily than L2. Using the same cell preparation, live cell imaging studies were also performed consistent with the hypothesis of selective probe-receptor tagging at the cell surface (Fig. 2D). Confirmation of cell-surface localisation was achieved by repeating the loading experiment with a co-incubation of the commercially available, plasma membrane stain, CellMask Orange (5 μg mL−1 for 5 min) (Fig. 2A and C).
 | ||
| Fig. 2 Live cell fluorescence microscopy images of differentiated NSC-34 cells following treatment with L1 and L2 (10 μM, 30 min, 37 °C and 5% CO2) followed by Cell Mask Orange (CMO) (5 μg mL–5 min) showing cell surface localisation. (A–D) (A) visualisation of plasma membrane by CMO (λex/λem = 525/590 nm); (B) L1 visualisation by FRET using [Eu·L]3− (λex/λem = 365/780 nm). (C and D) Analogous to images (A and B) but incubation with L2. (E and F): incubation with L1, followed by CMO, followed by glutamate wash (2×, 1 mM); (E) plasma membrane visualisation by CMO; (F) no detectable signal of L1 (λex/λem = 365/780 nm), showing the reversibility of binding in the presence of Glu. (G) Gaussian distribution plot of recorded intensity count of a unified stained cell standardising the average contrast transfer function (CTF) intensities to the maximum brightness of the original loading experiment. Original simultaneous loading experiment of L1 (10 μM), (green 13600 counts) compared to the post-glutamate wash (purple 160 counts, 1.2%). [Bars = 20 μm, ×63/1.40 NA oil, 1300 × 1030 pixels/frame, dx,y = 138 nm], [bars = 20 μm]. | ||
The cellular NMDAR-probe binding specificity was further proven by studies on NMDAR-negative cells (NIH 3T3 mouse skin fibroblast cells). These cells were incubated with a solution of either L1 or L2 (10 μM 30 min.), washed to remove unbound probe and treated with [Eu·L]3− (20 μM). No localisation profile was observed, strengthening the case for receptor-mediated localisation of L1 and L2 with differentiated NSC-34 cells.
One further characteristic for these probes is the ability to bind reversibly at the NMDAR, with an affinity competitive with endogenous Glu. Since L1 was visualised on the cell surface receptors, the binding of this probe after a simulated ‘Glu burst’ was assessed. The differentiated NSC-34 cells were consecutively incubated with L1 (10 μM, 30 min, 3× HBSS wash), Cell Mask Orange (5 μg mL−1, 5 min, 2× HBSS wash) and then treated with fresh buffer containing 20 μM of [Eu·L]3−. The cells were imaged and the average intensity was recorded in triplicate. These cells were washed with a Glu-rich (2×, 1 mM) medium and then treated with buffer containing 20 μM of [Eu·L]3. This sequence resulted in a ten-fold drop in fluorescence intensity (Fig. 2F and G), compared to the original cell staining experiment (Fig. 2B), whilst the non-specific membrane dye maintained the same intensity (Fig. 2E).
To demonstrate the suitability of the probes for OA detection, the probes were assessed by MSOT after interaction with cell surface NMDARs on differentiated NSC-34 cells. These experiments were conducted using a small animal MSOT scanner. In brief, about 106 differentiated NSC-34 cells were treated with 20 μM of either 5, L1 or L2 for 30 minutes, washed thoroughly to remove any unbound probe and were then re-suspended in a 1:1 mixture of fresh buffer and a 3% agar solution. The agar solution generated a scattering pattern mimicking tissue scattering. Images were obtained by scanning wavelengths between 700–900 nm in 5 nm steps, with 20 averages each (Fig. 3 and Fig. S4, ESI†).
 | ||
| Fig. 3 Live cell OA signal of differentiated NSC-34 cells following treatment with 5, L1 or L2 (each 20 μM, 30 min, 37 °C and 5% CO2). (Left) (A) Untreated cells; (B) cells treated with control dye, 5, no OA signal; (C) cells treated with L1 (D) cells treated with L2 (E) cells treated with the corresponding antagonist, Ifenprodil (40 μM, 10 min), followed by treatment with L1 (C and F) cells treated with L1 and washed with Glu (2×, 1 mM), strong reduction in OA signal. (Right) Absorbance spectrum of 5, L1 and L2 that are fed into the unmixing algorithm. Wavelength-dependent analysis of NSC-34 labelled with 5, L1 or L2. (1–2). Compared optoacoustic signal of L1/L2 (supernatant) vs. cell bound-L1/L2. | ||
L1 clearly labels NSC-34 cells, generating a strong optoacoustic signal (Fig. 3C).18 As a control, untreated cells (Fig. 3A) and cells treated with the non-targeted heptamethine cyanine dye, 5 (Fig. 3B) did not show any OA signal, suggesting that the receptor-binding moiety of L1 binds to the cell surface NMDARs and is responsible for the observed OA signal. However, cell labelling with L2 (20 μM, 30 min) gave rise to only a faint OA signal (Fig. 3D) replicating results obtained from fluorescence microscopy when comparing the labelling efficiencies of L1vs.L2. Fig. 3 (right panel) shows the wavelength dependence of the optoacoustic signals of cells treated with L1/L2. The cell bound OA spectrum of L1 was significantly different from the OA spectrum of supernatant L1 (Fig. 3.1). An enhanced intensity around 700 nm and a decreased intensity around 780 nm suggests that bound and unbound probe can be distinguished and will potentially be observable in an in vivo model, in the presence of endogenous photo-absorbers. This switchable intensity was confirmed upon treating cells with L1, washed twice with HBSS and recording the normalised absorption spectrum (Fig. S5, ESI†). The absorption maximum for cell-bound L1 clearly undergoes a hypsochromic shift to around 694 nm, compared to the absorbance maxima at 774 nm for L1 alone. The cell bound OA spectrum of L2 was the same as the OA spectrum of supernatant L2 (Fig. 3.2).
The absorption spectra involve π → π* transitions that are affected by the local solvent polarity. A hypsochromic shift in the cell-bound-L1 absorption maxima suggests that the probe is in a less polar environment, as compared to the probe alone. The similar behaviour of Indocyanine Green (ICG) has been explained by Landsman; ICG shows a hypsochromic shift when the plasma concentration increased.19 It is also known that the ifenprodil-binding site is buried deep within the interface between the GluN1 and GluN2B subunit ATD dimers, suggesting an induced-fit mechanism of binding, with dissociation likely to involve opening of the GluN2B ATD bi-lobed structure.20 As the binding site is deep within the NMDAR cleft, the cavity is more hydrophobic than in normal solution, leading to the shift in absorption wavelength. Furthermore, a competition experiment was performed to assess the cellular labelling of L1 in the presence of the antagonist Ifenprodil. Differentiated NSC-34 cells were treated with a 40 μM solution of Ifenprodil for 10 minutes (2× HBSS wash), then incubated with a 20 μM solution of L1 for 30 minutes (2× HBSS wash) and imaged using MSOT. Pre-treating cells with the NMDAR-binding moiety of L1 before loading the cells with L1 gave a diminished OA signal (Fig. 3E). Such behaviour suggests that the NMDAR binding efficiency of L1 is slightly less than with Ifendopril. Similar behaviour was reported for a cyanine dye conjugate.10 The ability of L1 to be displaced from the NMDAR by the natural ligand L-Glu was demonstrated using MSOT. Differentiated NSC-34 cells were treated with 20 μM solution of L1 for 30 minutes and washed with L-Glu-rich (1 mM, 2× wash) HBSS before being imaged. A greatly diminished OA signal was observed (Fig. 3F), showing that L1 is displaced by a simulated L-Glu burst, in accord with the fluorescence microscopy experiments.
To visualise the imaging probes under the skull via MSOT, preliminary in vivo studies were undertaken. The motor cortex of the mouse has a high expression of NMDARs.1,20 Therefore, L1 and 5 were injected intracranially into the motor cortex. MSOT successfully visualised L1 deep inside the brain tissue, while 5 was not visualised, presumably being flushed away by the blood flow. An ex vivo cryoslicer-imaging study (30 min post-injection) showed that fluorescent probe L1 was inside the brain (Fig. S6A and B, ESI†).
In summary, the results obtained concerning the localisation, cellular specificity and reversibility of binding suggest that L1 and L2 are binding to the cell surface via their NMDAR-binding moieties. The reversibility of L1 binding to the NMDAR was shown via MSOT studies, showing that Glu addition leads to probe release from the receptor site. The work paves the way for development of probes capable of visualising NMDAR densities in models of neuropsychiatric disease, suggesting that dynamic changes in Glu concentration in vivo may be measured via non-invasive MSOT imaging, serving as an alternative to lower resolution PET imaging.
We thank the European Research Council [ERC-ADvG: 266804 (NS, RP, DP) and 233161 (VN), ERC-StG: 260991 (SG, DR) and 311552 (GGW)], the Helmholtz Alliance ICEMED (AM, GGW).
Notes and references
- Neurotransmitters and Neuromodulators: Handbook of Receptors and Biological Effects, Wiley-VCH, 2006 Search PubMed.
- S. Brady, G. Siegel, R. W. Albers and D. Price, Basic Neurochemistry, Academic Press, 7th edn, 2005 Search PubMed.
- S. E. Lakhan, M. Caro and N. Hadzimichalis, Front. Mol. Psychiatry, 2013, 4, 1 Search PubMed.
- T. Abel and R. S. Zukin, Curr. Opin. Pharmacol., 2008, 8(1), 57 CrossRef CAS PubMed.
- M. L. James and S. S. Gambhir, Physiol. Rev., 2012, 92, 897 CrossRef CAS PubMed.
- A. Taruttis and V. Ntziachristos, Nat. Photonics, 2015, 9, 219 CrossRef CAS PubMed.
- S. Gottschalk, T. F. Fehm, X. L. Deán-Ben and D. Razansky, J. Cereb. Blood Flow Metab., 2015, 35, 531 CrossRef PubMed.
- N. Sim and D. Parker, Chem. Soc. Rev., 2015, 44, 2122 RSC.
- I. J. Reynolds and R. J. Miller, Mol. Pharmacol., 1989, 36, 758 CAS.
- P. Marchand, J. Becerril-Ortega, L. Mony, C. Bouteiller, P. Paoletti, O. Nicole, L. Barré, A. Buisson and C. Perrio, Bioconjugate Chem., 2011, 23, 21 CrossRef PubMed.
- N. Sim, R. Pal, D. Parker, J. Engelmann, A. Mishra and S. Gottschalk, Org. Biomol. Chem., 2014, 12(46), 9389 CAS.
- F. M. Hamann, J. B. R. Fau-Pauli, M. P. J. Fau-Grabolle, W. G. M. Fau-Frank, W. A. F. W. Fau-Kaiser, D. K. W. Fau-Fischer, U. F. D. Fau-Resch-Genger, I. R.-G. U. Fau-Hilger and I. Hilger, Mol. Imaging, 2011, 10, 258 Search PubMed.
- D. S. Pisoni, L. Todeschini, A. C. A. Borges, C. L. Petzhold, F. S. Rodembusch and L. F. J. Campo, J. Org. Chem., 2014, 79, 5511 CrossRef CAS PubMed.
- M. Y. Berezin, K. Guo, W. Akers, J. Livingston, M. Solomon, H. Lee, K. Liang, A. Agee and S. Achilefu, J. Biochem., 2011, 50, 2691 CrossRef CAS PubMed.
- N. Sim, S. Gottschalk, R. Pal, J. Engelmann, D. Parker and A. Mishra, Chem. Sci., 2013, 4(8), 3148 RSC.
- M. Delbianco, L. Lamarque and D. Parker, Org. Biomol. Chem., 2014, 12, 8061 CAS.
- R. Pal and A. Beeby, Methods Appl. Fluoresc., 2014, 2, 037001 CrossRef.
- A. Rosenthal, IEEE Trans. Med. Imaging, 2010, 29, 1275 CrossRef PubMed.
- M. L. J. Landsman, G. Kwant, G. A. Mook and W. G. Zijlstra, J. Appl. Physiol., 1976, 40, 575 CAS.
- E. Karakas, N. Simorowski and H. Furukawa, Nature, 2011, 475, 24 CrossRef PubMed.
Footnote |
| † Electronic supplementary information (ESI) available. See DOI: 10.1039/c5cc06277b |
| This journal is © The Royal Society of Chemistry 2015 |