
 Open Access Article
 This Open Access Article is licensed under a
 Creative Commons Attribution 3.0 Unported Licence
A Ni(I)Fe(II) analogue of the Ni-L state of the active site of the [NiFe] hydrogenases†
Carlo U.
Perotto
a,
George
Marshall
a,
Graham J.
Jones
a,
E.
Stephen Davies
a,
William
Lewis
a,
Jonathan
McMaster
*a and
Martin
Schröder
*ab
aThe University of Nottingham, University Park, Nottingham, NG7 2RD, UK. E-mail: j.mcmaster@nottingham.ac.uk
bThe University of Manchester, Oxford Road, Manchester, M13 9PL, UK. E-mail: m.schroder@manchester.ac.uk
First published on 30th September 2015
Abstract
[Ni(L1)Fe(tBuNC)4](PF6)2 is a robust NiIIFeII complex that undergoes a reversible one-electron reduction. Spectroscopic and theoretical studies show that [Ni(L1)Fe(tBuNC)4]+ is an unprecedented NiIFeII species that reproduces the electronic configuration of the Ni-L state of the [NiFe] hydrogenases.
The [NiFe]-hydrogenases catalyse the two-electron inter-conversion of two protons and molecular hydrogen.1 The nature of the Ni–Fe heterobimetallic active site in these enzymes is now established; the Ni centre is co-ordinated by two terminal and two bridging cysteinate donors, which co-ordinate to a Fe centre that is also bound by one carbonyl and two cyanide ligands (Scheme 1). Catalytic H2 cleavage is associated with changes in the formal oxidation state of the Ni centre while the Fe centre remains in the FeII state during turnover.1c Three key states have been identified in a catalytic cycle (Scheme 1): Ni-SI, Ni-R and Ni-C. Thus, H2 reacts with Ni-SI and undergoes heterolytic cleavage to form Ni-R which contains a bridging H− ligand. A co-ordinated Cys ligand may act as an initial proton acceptor for the accompanying proton before its transfer to other bases (B) about the active site.3 The removal of an electron generates the EPR active S = 1/2 Ni-C state, which can be converted to an EPR-active S = 1/2 NiIFeII state (Ni-L) following the photolysis at low temperatures.4 Previously, Ni-L had not been viewed as being catalytically relevant given the conditions required for its formation. However, recent in situ IR spectroelectrochemical studies have demonstrated that Ni-L may be generated reversibly in the dark under turnover conditions.2 Therefore, the regeneration of the Ni-SI state could occur either directly from the Ni-C state, via the concerted transfer of an electron and a proton, or by oxidation of the Ni-L state. These studies, together with previous DFT calculations,5 open up the possibility that separate proton and electron transfer events may be associated with the regeneration of the Ni-SI state from Ni-C, and that these steps may involve the Ni-L state (Scheme 1).
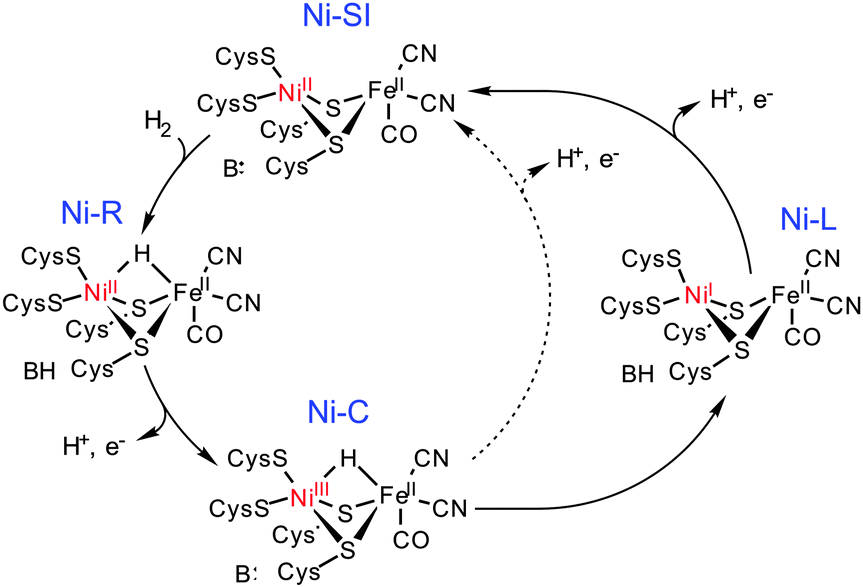 | ||
| Scheme 1 A proposed catalytic cycle for H2 oxidation by the [NiFe] hydrogenases showing regeneration of Ni-SI directly from Ni-C (dotted line) or via a recently proposed route involving Ni-L (solid line).2 | ||
Despite the large number of diamagnetic NiIIFeII complexes that have been prepared as analogues of the [NiFe] hydrogenases,6 the syntheses of paramagnetic analogues have proven to be more challenging.7 Several NiIIIFeIII, NiIIFeIII, NiIIFeI and NiIFeI centres have been reported,6c,7,8 none of which have succeeded in reproducing the crucial NiIFeII and NiIIIFeII states found for the [NiFe] hydrogenases. For example, [(dppe)Ni(μ-pdt)Fe(CO)3](BF4)7 [dppe = 1,2-bis(diphenylphosphino)ethane, pdt = propane-1,2-dithiolate] possesses a NiIIFeI configuration with spin density localised principally on the Fe centre and [(dppe)Ni(μ-pdt)Ru(cymene)]9 possesses a NiIRuII centre rather than the biologically more relevant NiIFeII unit. Given the renewed focus on the role of Ni-L, we report the characterisation of a NiIFeII complex ([1]+) as an analogue of this state. [1]+ is prepared from the reversible, one-electron reduction of the parent complex [1]2+ (Fig. 1). Our assignment of [1]+ as a NiIFeII centre represents the first analogue of the Ni-L form of the [NiFe] hydrogenases to feature Ni and Fe centres with electronic configurations that mirror those proposed for Ni-L.
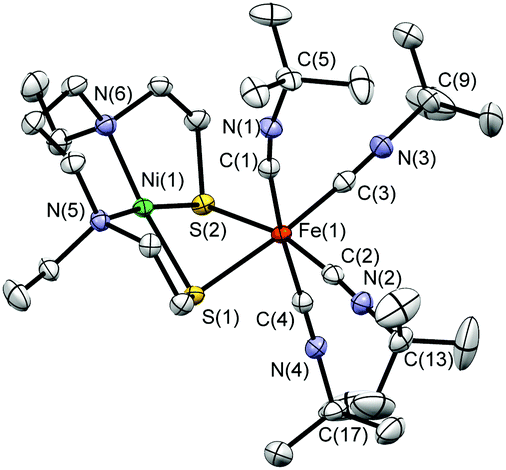 | ||
| Fig. 1 X-Ray structure of the cation [1]2+ in [1](PF6)2 with 50% probability thermal ellipsoids. | ||
Treatment of a solution of [Ni(L1)] (H2L1 = N,N′-diethyl-3,7-diazanonane-1,9-dithiol)10 in acetonitrile with FeCl2 followed by the addition of four equivalents of tBuNC and NH4PF6 affords [Ni(L1)Fe(tBuNC)4](PF6)2 ([1](PF6)2). [1](PF6)2 is stable at room temperature in air as a solid and in acetonitrile solution for at least 48 h, as monitored by IR spectroscopy. The crystallographic characterisation of [1](PF6)2·MeCN shows the Ni centre in an approximate square-planar N2S2 environment with Fe having a pseudo-octahedral co-ordination sphere comprised of four tBuNC ligands and two S donors derived from [Ni(L1)] (Fig. 1). The NiN2S2 fragment retains the structural features of the [Ni(L1)] precursor,11 the most significant difference being a smaller S(1)–Ni(1)–S(2) angle [81.76(2)°] in [Ni(L1)] relative to that in [1]2+ [84.20(2)°]. This difference may reflect the steric demands of the co-ordinated [Fe(tBuNC)4]2+ fragment in [1]2+. The equatorial tBuNC ligands defined by C(2) and C(3) bind to Fe(1) in an essentially linear mode with Fe(1)–C–N angles of 175.3(2)° and 175.1(2)°, respectively. In contrast the axial tBuNC ligands, defined by C(1) and C(4), co-ordinate in a bent geometry with Fe(1)–C–N angles of 170.0(2) and 172.9(2)°, respectively. The Ni(1)–C(1) and Ni(1)–C(4) distances [2.951(2) and 4.164(2) Å, respectively] are significantly greater than the Fe(1)–C(1) and Fe(1)–C(4) distances [1.890(2) and 1.888(2) Å, respectively]. Thus, the axial tBuNC ligands do not appear to adopt bridging modes between the Ni and Fe centres in [1]2+ and the non-linear binding mode of these ligands about Fe(1) may result from inter- and intra-molecular interactions due to crystal packing (Fig. S1, ESI†). The Ni(1)–Fe(1) distance [2.9898(7) Å] compares well with that in the inactive oxidised form of [NiFe] hydrogenase from Desulfovibrio gigas (2.9 Å)12 and is significantly longer than that found in the Ni-R form from Desulfovibrio vulgaris Miyazaki F (2.57 Å)3a that both contain Ni and Fe in formal MII oxidation states.
The cyclic voltammogram of [1](PF6)2, recorded at 298 K in MeCN containing 0.2 M [NnBu4][BF4] as supporting electrolyte, shows a reduction process at E1/2 = −1.39 V vs. Fc+/Fc that is reversible over the range of scan rates employed in the experiment (20–300 mV s−1, Fig. S2 and S3, ESI†). The cyclic voltammogram of [Ni(L1)] recorded under the same conditions reveals a reduction process at Ecp = −2.35 V vs. Fc+/Fc (Fig. S4, ESI†), assigned to the reduction of [Ni(L1)] to the formal NiI state on the basis of comparisons with previously reported NiN2S2 complexes possessing similar co-ordination spheres.13 The shift of ca. +1 V for the reduction of [1](PF6)2 relative to that of [Ni(L1)] is consistent with the formation of a Lewis base Lewis acid adduct between [Ni(L1)] and [Fe(tBuNC)4]2+; ca. +0.5 V shifts in potential have been observed previously for (NiN2S2)W(CO)4 relative to their parent NiN2S2 complexes.13 UV/vis spectroelectrochemistry indicates that [1]+ decomposes at temperatures above 273 K and that cooling to 243 K is required to ensure the quantitative regeneration of [1]2+ (Fig. S5 and Table S1, ESI†). On cooling to 243 K the cyclic voltammogram of [1](PF6)2 becomes electrochemically irreversible (Fig. S6, ESI†) and the controlled potential electrolysis of [1](PF6)2 at −1.6 V vs. Fc+/Fc at 243 K confirms that a one-electron reduction process accompanies the formation of [1]+. The cyclic voltammograms of [1](PF6)2 and [1]+ at 243 K exhibit similar profiles confirming the stability of [1]+ under the conditions and timescale of the experiment (Fig. S7, ESI†).
The IR spectra of [1](PF6)2 and [1]+ in MeCN solution are shown in Fig. 2. Each spectrum exhibits four bands assigned to the C–N stretches of the tBuNC ligands. In [1]2+ these bands occur at frequencies typical of isonitrile ligands bound in a terminal mode to transition metal centres.14 The overall shift of the bands to lower frequencies following the reduction of [1]2+ to [1]+ is consistent with an increase in the electron density about the Ni–Fe core and a corresponding increase in π-back-donation into the tBuNC units. A C–N stretching band at 1857 cm−1 in the IR spectrum of [1]+ in MeCN solution suggests that one terminal, apical tBuNC ligand moves to a bridging mode between the Ni and Fe centres (Fig. 2) following the reduction of [1]2+; a similar bridging mode is found in [Fe2(pdt)(MeNC)7](PF6)2 where one MeNC ligand bridges between the two Fe centres.15
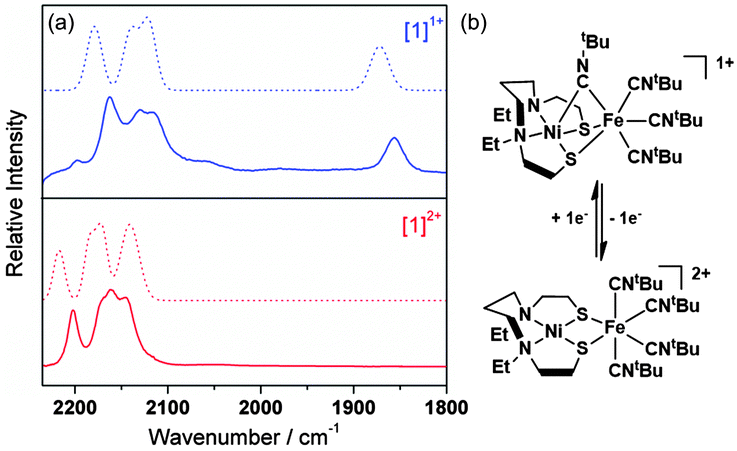 | ||
| Fig. 2 (a) Solution IR spectra of [1](PF6)2 (2200, 2170, 2161 and 2144 cm−1) and [1]+ (2162, 2129, 2116 and 1857 cm−1) recorded in MeCN (solid lines) and DFT calculated spectra (dotted lines; 2216, 2183, 2169, 2139 cm−1 for [1]2+ and 2179, 2140, 2121, 1872 for [1]+). (b) Proposed rearrangement supported by DFT calculations. | ||
The X-band EPR spectrum of electrochemically generated [1]+ recorded at 77 K in MeCN/0.2 M [NnBu4][BF4] (Fig. 3a) shows striking similarities to those of NiIN2S2 complexes (S = thiolato, thioether or sulfonato, N = amine donors; g∥ = 2.18–2.25; g⊥ = 2.057–2.071), generated by chemical reduction of their NiII counterparts,16 and, crucially, is substantially different to those of FeI centres including [Fe(CO)3(PPh3)2]+ (gxx = 2.053, gyy = 2.090, gzz = 2.001)17 and [(dppe)Ni(μ-pdt)Fe(CO)3]+ (gxx = 2.052, gyy = 2.050, gzz = 2.005 for one isomer).7 Thus, the EPR spectroscopic data are consistent with a formal NiIFeII unit in [1]+ where the NiI centre adopts a d9, S = 1/2 configuration in which the unpaired electron resides in d-orbital orientated in the equatorial plane of the NiIN2S2 unit with associated spin Hamiltonian parameters gzz > gxx ≈ gyy > ge.18 In contrast, the Ni-L form of the [NiFe] hydrogenases is characterised by a rhombic EPR spectrum (g11 = 2.30, g22 = 2.12 and g33 = 2.05)19 that may be viewed as resulting from the re-hybridisation of the Ni dx2−y2 and dz2 orbitals in Ni-C where one hybrid contributes to a Ni–Fe bond.20 The UV/vis spectrum of [1]+ (Table S1 and Fig. S5, ESI†) shows bands at 400 (3900), 490 (1760), 520 (1500), 598 (1100) and 720 nm (380 M−1 cm−1) that are consistent with those in the UV/vis spectra of other well-defined NiI complexes.21
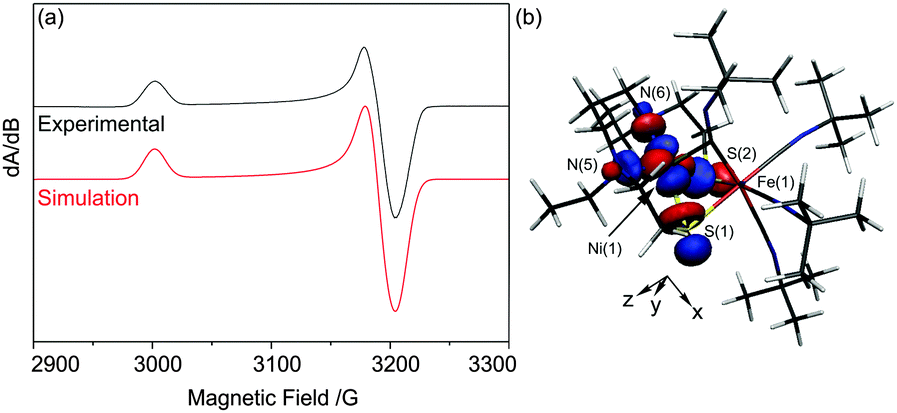 | ||
| Fig. 3 (a) X-band EPR spectrum of [1]+ as a solution in MeCN/0.2 M [NnBu4][BF4] at 77 K. Experimental (black) and simulated (red) spectrum, simulated using the spin Hamiltonian parameters g11 = 2.210, g22 = g33 = 2.074 (W11 = 18, W22 = 16, W33 = 17 G); (b) the Kohn–Sham SOMO of [1]+ plotted with an isosurface value of 0.05 e Å−3. | ||
In order to support the NiIFeII assignment proposed for [1]+, we conducted density functional theory (DFT) calculations on the full structures of [1]2+/+. The calculated structure of [1]2+ [Fig. S8(a), ESI†] reproduces the principal features of the experimentally determined structure (Fig. 1); the average Fe–C distances are ca. 0.02 Å shorter and the Ni–S and Fe–S distances are ca. 0.04 Å longer in the calculated structure of [1]2+ (Table S3, ESI†). The principal differences between the calculated and experimental structures are (i) a relaxation of the dihedral angle defined by the S(1)–Ni(1)–S(2) and S(1)–Fe(1)–S(2) planes [117.94(3)° and 128.3°, in the calculated and experimental structures, respectively], (ii) an increase in the Ni(1)–Fe(1) distance of ca. 0.2 Å in the calculated relative to the experimental structure of [1]2+ [Ni(1)–Fe(1) = 3.209 Å and 2.9896(4) Å for the calculated and experimental structures, respectively, Table S2, ESI†], and (iii) an increase in the C–Fe(1)–C and Fe(1)–C–N angles for the axial tBuNC ligands defined by C(1) and C(4) (Table S2, ESI†). The unscaled22 calculated IR spectrum of [1]2+ possesses four bands in the C–N stretching region at 2216, 2183, 2169 and 2139 cm−1 that compare well with the experimental stretching frequencies (Fig. 2). Thus, the close correspondence between the calculated and experimental structures, and IR spectra suggest that the DFT calculations provide a reasonable description of the geometric and electronic structure of [1]2+. The composition23 of the HOMO in [1]2+ shows that it is largely metal-centred [59.3% Ni dz2, 0.6% Ni dxz, 9.7% Fe dx2−y2, 1.2% Fe dxz, S 25.8%, N(5) + N(6) 1.2%, Fig. S9, ESI†]. The Mayer bond order24 between the Ni(1) and Fe(1) centres (0.04) derived from the DFT calculations suggests there is no formal metal–metal bond in [1]2+. Overall the description of the electronic structure of [1]2+ is consistent with an S = 0 NiIIFeII centre in [1]2+.
The calculated structure of [1]+ suggests that significant changes in geometry about the Ni(1) and Fe(1) centres accompany the reduction of [1]2+ [Fig. S8(b) and Table S3, ESI†]. These include a marked decrease in the dihedral angle between the S(1)–Ni(1)–S(2) and S(1)–Fe(1)–S(2) planes (94.1° and 128.3°, for [1]+ and [1]2+, respectively) and a shortening of the Ni(1)–Fe(1) distance [Ni(1)–Fe(1) = 2.616 Å and 3.209 Å for [1]1+ and [1]2+, respectively], which compares well with that calculated for models of the active site of the Ni-L form.20 On the reduction of [1]2+ one axial tBuNC ligand, defined by C(1), moves to a bridging mode between the Fe(1) and Ni(1) centres with Fe(1)–C(1) and Ni(1)–C(1) distances of 1.942 and 2.018 Å, respectively. The adoption of a bridging mode for this ligand is accompanied by a significant bend in the backbone of the ligand [C(1)–N(1)–C(5) = 140.9°], which is commonly observed for bridging isocyanides.25 The calculated IR spectrum for [1]+ shows three intense C–N stretches at 2179, 2140 and 2121 cm−1 for the terminal isocyanides and a single band at 1872 cm−1 for the C–N stretching mode of the bridging tBuNC ligand. This calculated spectrum shows close correspondence to the experimental IR spectrum of [1]+ (Fig. 2) and strongly supports a structural rearrangement in which a terminal tBuNC ligand moves to a bridging mode on the reduction of [1]2+. This structural rearrangement may also underpin the differences in profiles of the cyclic voltammograms of [1](PF6)2 recorded at 298 K (Fig. S2, ESI†) and 243 K (Fig. S6, ESI†). The rate of the suggested structural rearrangements for [1]2+/+ may be slowed at 243 K with the consequent loss of electrochemical reversibility for the [1]2+/+ process at 243 K. We are unable to determine the precise mechanism that gives rise to the voltammetric profile i.e. whether electron transfer precedes structural rearrangement or vice versa. However, the results of the UV/vis spectroelectrochemical experiments clearly show that the process is chemically reversible at 243 K over the timescale of this experiment.
The SOMO of [1]+ possesses 60.8% Ni dxy, 1.3% Ni dxz, 1.1% Ni dyz S 21.7%, N(5) + N(6) 10.2% character and is essentially localised on the NiN2S2 unit (Fig. 3b). The calculated EPR spin Hamiltonian parameters using the BP86 functional (gzz = 2.174, gyy = 2.079, gxx = 2.070, Table S2, ESI†) reproduce the approximately axial nature of the frozen solution EPR spectrum of [1]+ (Fig. 3a). We note that the DFT calculations underestimate the largest g-shift (gzz = 2.174 calc. vs. g11 = 2.210). Such underestimations (by up to 30%) have been observed previously for various metal centres including NiI, and these underestimations have been attributed partly to overestimations in spin delocalisation into ligand-based orbitals in the calculated electronic structures.20,26 Thus, these results, together with the excellent agreement between the calculated and experimental IR spectra, support a NiIFeII description for [1]+ where the unpaired electron is essentially localised in the dxy orbital of a d9 NiI centre. The calculated Ni–Fe Mayer bond order increases from 0.04 in [1]2+ to 0.20 in [1]+ indicating the development of a Ni–Fe interaction but not a direct bond. In contrast, DFT calculations on models of the Ni-L state possess Ni–Fe bond orders of ca. 0.40 supporting the formation of a metal–metal bond in these centres.20 The absence of a formal Ni–Fe bond in [1]+ is not surprising given the additional fourth tBuNC ligand in the co-ordination sphere of FeII which occupies a bridging position between the Ni and Fe centres; this site is vacant in structures proposed for Ni-L.
Ni-L reacts with CO and converts to the paramagnetic Ni–CO state which features a CO ligand bound to the NiI centre.27 Thus, we examined the reactivity of [1]2+ and [1]+ towards CO. Whereas [1]2+ does not react with CO, a solution of [1]1+ chemically generated from [1](PF6) with [Cp*2Co] readily reacts with CO at 243 K, as monitored by IR spectroscopy (Fig. S10, ESI†). Several new bands develop in the C–O and C–N stretching region and the frozen solution EPR spectrum exhibits multiple low field features (Fig. S10, ESI†) suggesting the formation of multiple products, which proved intractable.
In conclusion, [1]2+ has been prepared and structurally characterised as its [1](PF6)2 salt. The electrochemical one-electron reduction of [1]2+ generates paramagnetic [1]+ which has been characterized by IR, UV/vis and EPR spectroscopies. DFT calculations reproduce the principal features of the IR spectrum of [1]+ and, in contrast to Ni-L, [1]+ does not contain a formal Ni–Fe bond. Rather the formation of [1]+ may be associated with a structural rearrangement that incorporates a bridging tBuNC ligand between the Ni and Fe centres. The frozen solution X-band EPR spectrum of [1]+ and DFT calculated spin Hamiltonian parameters are consistent with a SOMO that is largely localized at the NiN2S2 core in a Ni dxy orbital. Thus, the experimental and theoretical data supports the assignment of [1]+ to a mixed-valence NiIFeII state. In this respect [1]+ represents the first example of an Ni–Fe analogue of the active site of the [NiFe] hydrogenases that reproduces the formal oxidation and spin states of the metal centres in the Ni-L form.
We thank EPSRC and the University of Nottingham for support. MS gratefully acknowledges receipt of an ERC advanced grant.
Notes and references
- (a) J. C. Fontecilla-Camps, A. Volbeda, C. Cavazza and Y. Nicolet, Chem. Rev., 2007, 107, 4273–4303 CrossRef CAS PubMed; (b) W. Lubitz, H. Ogata, O. Rüdiger and E. Reijerse, Chem. Rev., 2014, 114, 4081–4148 CrossRef CAS PubMed; (c) H. Ogata, W. Lubitz and Y. Higuchi, Dalton Trans., 2009, 7577–7587 RSC; (d) A. Volbeda and J. C. Fontecilla-Camps, Dalton Trans., 2003, 4030–4038 RSC.
- R. Hidalgo, P. A. Ash, A. J. Healy and K. A. Vincent, Angew. Chem., Int. Ed., 2015, 54, 7110–7113 CrossRef CAS PubMed.
- (a) H. Ogata, K. Nishikawa and W. Lubitz, Nature, 2015, 520, 571–574 CrossRef PubMed; (b) A. Abou-Hamdan, P. Ceccaldi, H. Lebrette, O. Gutierrez-Sanz, P. Richaud, L. Cournac, B. Guigliarelli, A. L. De Lacey, C. Leger, A. Volbeda, B. Burlat and S. Dementin, J. Biol. Chem., 2015, 290, 8550–8558 CrossRef CAS PubMed.
- (a) M. Brecht, M. van Gastel, T. Buhrke, B. Friedrich and W. Lubitz, J. Am. Chem. Soc., 2003, 125, 13075–13083 CrossRef CAS PubMed; (b) J. P. Whitehead, R. J. Gurbiel, C. Bagyinka, B. M. Hoffman and M. J. Maroney, J. Am. Chem. Soc., 1993, 115, 5629–5635 CrossRef CAS.
- (a) S. Q. Niu, L. M. Thomson and M. B. Hall, J. Am. Chem. Soc., 1999, 121, 4000–4007 CrossRef CAS; (b) A. Pardo, A. L. De Lacey, V. M. Fernandez, H. J. Fan, Y. B. Fan and M. B. Hall, J. Biol. Inorg. Chem., 2006, 11, 286–306 CrossRef CAS PubMed.
- (a) S. Canaguier, V. Artero and M. Fontecave, Dalton Trans., 2008, 315–325 RSC; (b) J. Dawson, C. Perotto, J. McMaster and M. Schröder, in Bioinspired Catalysis, ed. W. Weigand and P. Schollhammer, Wiley-VCH Verlag GmbH & Co., 2014, pp. 79–104 Search PubMed; (c) C. Tard and C. J. Pickett, Chem. Rev., 2009, 109, 2245–2274 CrossRef CAS PubMed; (d) P. A. Summers, J. Dawson, F. Ghiotto, M. W. D. Hanson-Heine, K. Q. Vuong, E. S. Davies, X.-Z. Sun, N. A. Besley, J. McMaster, M. W. George and M. Schröder, Inorg. Chem., 2014, 53, 4430–4439 CrossRef CAS PubMed; (e) M. L. Helm, M. P. Stewart, R. M. Bullock, M. R. DuBois and D. L. DuBois, Science, 2011, 333, 863–866 CrossRef CAS PubMed; (f) C. H. Lai, J. H. Reibenspies and M. Y. Darensbourg, Angew. Chem., Int. Ed., 1996, 35, 2390–2393 CrossRef CAS PubMed; (g) S. Ogo, K. Ichikawa, T. Kishima, T. Matsumoto, H. Nakai, K. Kusaka and T. Ohhara, Science, 2013, 339, 682–684 CrossRef CAS PubMed; (h) K. Weber, T. Kraemer, H. S. Shafaat, T. Weyhermueller, E. Bill, M. van Gastel, F. Neese and W. Lubitz, J. Am. Chem. Soc., 2012, 134, 20745–20755 CrossRef CAS PubMed; (i) C. Wombwell and E. Reisner, Chem. – Eur. J., 2015, 21, 8096–8104 CrossRef CAS PubMed.
- D. Schilter, M. J. Nilges, M. Chakrabarti, P. A. Lindahl, T. B. Rauchfuss and M. Stein, Inorg. Chem., 2012, 51, 2338–2348 CrossRef CAS PubMed.
- (a) D. Schilter, T. B. Rauchfuss and M. Stein, Inorg. Chem., 2012, 51, 8931–8941 CrossRef CAS PubMed; (b) G. Steinfeld and B. Kersting, Chem. Commun., 2000, 205–206 RSC; (c) W. F. Zhu, A. C. Marr, Q. Wang, F. Neese, D. J. E. Spencer, A. J. Blake, P. A. Cooke, C. Wilson, M. Schröder and M. Schröder, Proc. Natl. Acad. Sci. U. S. A., 2005, 102, 18280–18285 CrossRef CAS PubMed.
- G. M. Chambers, J. Mitra, T. B. Rauchfuss and M. Stein, Inorg. Chem., 2014, 53, 4243–4249 CrossRef CAS PubMed.
- (a) F. Osterloh, W. Saak and S. Pohl, J. Am. Chem. Soc., 1997, 119, 5648–5656 CrossRef CAS; (b) J. A. Denny and M. Y. Darensbourg, Chem. Rev., 2015, 115, 5248–5273 CrossRef CAS PubMed.
- J. Schneider, R. Hauptmann, F. Osterloh and G. Henkel, Acta Crystallogr., Sect. C: Cryst. Struct. Commun., 1999, 55, 328–330 Search PubMed.
- A. Volbeda, E. Garcin, C. Piras, A. L. De Lacey, V. M. Fernandez, E. C. Hatchikian, M. Frey and J. C. Fontecilla-Camps, J. Am. Chem. Soc., 1996, 118, 12989–12996 CrossRef CAS.
- M. V. Rampersad, S. P. Jeffery, M. L. Golden, J. Lee, J. H. Reibenspies, D. J. Darensbourg and M. Y. Darensbourg, J. Am. Chem. Soc., 2005, 127, 17323–17334 CrossRef CAS PubMed.
- R. Taylor and W. Horrocks, Inorg. Chem., 1964, 3, 584–589 CrossRef CAS.
- J. D. Lawrence, T. B. Rauchfuss and S. R. Wilson, Inorg. Chem., 2002, 41, 6193–6195 CrossRef CAS PubMed.
- P. J. Farmer, J. H. Reibenspies, P. A. Lindahl and M. Y. Darensbourg, J. Am. Chem. Soc., 1993, 115, 4665–4674 CrossRef CAS.
- J. H. Macneil, A. C. Chiverton, S. Fortier, M. C. Baird, R. C. Hynes, A. J. Williams, K. F. Preston and T. Ziegler, J. Am. Chem. Soc., 1991, 113, 9834–9842 CrossRef CAS.
- (a) A. Lappin and A. McAuley, Adv. Inorg. Chem., 1988, 32, 241–295 CrossRef CAS; (b) G. Musie, P. J. Farmer, T. Tuntulani, J. H. Reibenspies and M. Y. Darensbourg, Inorg. Chem., 1996, 35, 2176–2183 CrossRef CAS PubMed.
- S. Foerster, M. Stein, M. Brecht, H. Ogata, Y. Higuchi and W. Lubitz, J. Am. Chem. Soc., 2003, 125, 83–93 CrossRef CAS PubMed.
- M. Kampa, M.-E. Pandelia, W. Lubitz, M. van Gastel and F. Neese, J. Am. Chem. Soc., 2013, 135, 3915–3925 CrossRef CAS PubMed.
- (a) L. Gomes, E. Pereira and B. de Castro, J. Chem. Soc., Dalton Trans., 2000, 1373–1379 RSC; (b) E. Pereira, L. Gomes and B. de Castro, J. Chem. Soc., Dalton Trans., 1998, 629–636 RSC; (c) D. J. Szalda, E. Fujita, R. Sanzenbacher, H. Paulus and H. Elias, Inorg. Chem., 1994, 33, 5855–5863 CrossRef CAS.
- J. P. Merrick, D. Moran and L. Radom, J. Phys. Chem. A, 2007, 111, 11683–11700 CrossRef CAS PubMed.
- A. Reed, R. Weinstock and F. Weinhold, J. Chem. Phys., 1985, 83, 735–746 CrossRef CAS PubMed.
- I. Mayer, Chem. Phys. Lett., 1987, 97, 270–274 CrossRef.
- R. D. Adams and F. A. Cotton, Inorg. Chem., 1974, 13, 249–253 CrossRef CAS.
- F. Neese, J. Chem. Phys., 2003, 118, 3939–3948 CrossRef CAS PubMed.
- M.-E. Pandelia, H. Ogata, L. J. Currell, M. Flores and W. Lubitz, Biochim. Biophys. Acta, Bioenerg., 2010, 1797, 304–313 CrossRef CAS PubMed.
Footnote |
| † Electronic supplementary information (ESI) available: Experimental and theoretical procedures, additional crystallographic, spectroscopic and electrochemical data. CCDC 1410033. For ESI and crystallographic data in CIF or other electronic format see DOI: 10.1039/c5cc05881c |
| This journal is © The Royal Society of Chemistry 2015 |