 Open Access Article
Spectrally resolved confocal microscopy using lanthanide centred near-IR emission†
Zhiyu
Liao
a,
Manuel
Tropiano
b,
Konstantins
Mantulnikovs
a,
Stephen
Faulkner
b,
Tom
Vosch
*a and
Thomas
Just Sørensen
*ab
aNano-Science Center & Department of Chemistry, University of Copenhagen, Universitetsparken 5, 2100 København ø, Denmark. E-mail: tom@chem.ku.dk; TJS@chem.ku.dk
bChemistry Research Laboratory, Oxford University, 12 Mansfield Road, Oxford, OX1 3TA, UK
First published on 18th December 2014
Abstract
The narrow, near infrared (NIR) emission from lanthanide ions has attracted great interest, particularly with regard to developing tools for bioimaging, where the long lifetimes of lanthanide excited states can be exploited to address problems arising from autofluorescence and sample transparency. Despite the promise of lanthanide-based probes for near-IR imaging, few reports on their use are present in the literature. Here, we demonstrate that images can be recorded by monitoring NIR emission from lanthanide complexes using detectors, optical elements and a microscope that were primarily designed for the visible part of the spectrum.
In bioimaging, the unique properties of the lanthanide ions have been hailed for decades.1–4 The narrow emission bands allow for multiplexing, essentially generating a barcode using either nanocomposites or molecular complexes.5–11 Additionally, the long decay time—of the millisecond order for europium and terbium, and microseconds for samarium, holmium, neodymium, erbium and ytterbium, etc—of the lanthanide centred emission allow for time-gated microscopy.12–16 The essential interchangeability of the lanthanide ions allows for the synthesis of bimodal probes; for instance using europium for optical imaging and gadolinium for magnetic resonance imaging.17–19
A key feature of the lanthanide ions is the presence of emission bands of erbium, neodymium, holmium and ytterbium in the NIR region of the spectrum. Application of these emission bands in imaging has yet to see widespread use. The barrier has so far been that the microscopy systems available with most research groups are geared towards the UV/visible range and are not frequently fitted with NIR specific detector systems. Intensity-based NIR imaging performed by following lanthanide centred emission using dedicated home-built set-ups has been realised.20–23 Here, we show NIR spectral-based imaging which provides direct spectroscopic evidence that the specified lanthanide emission is detected. Furthermore, we show spectrally resolved images obtained by observing the luminescence from europium (at 820 nm) and neodymium centred emissions (at 880 nm), and demonstrate detection of ytterbium centred emission (at 1000 nm). The spectra obtained clearly demonstrate that the observed signals arise from lanthanide centered emission.
The set-up used (Fig. 1) exploits a piezo scanning confocal fluorescence microscope that is capable of detecting the fluorescence of single molecules.24 However, none of the elements are specifically designed for NIR imaging or spectroscopy. The coating on the optical elements, transmission through the side port window of Olympus IX71, the grating in the spectrometer and the CCD chip in the camera all have poorer performance in the NIR compared to the visible range (see the ESI† for details). The demonstration given here, using a silicon-based CCD detector, will increase the general applicability of (bio)imaging of lanthanide centred NIR emission.
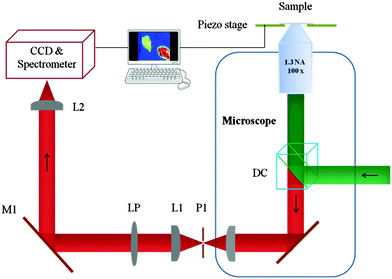 | ||
| Fig. 1 Microscope configuration. Abbreviations: DC, dichroic mirror; P1, pinhole; L1 and L2, lenses; LP, long-pass filter; M1, mirror; CCD charge coupled device. | ||
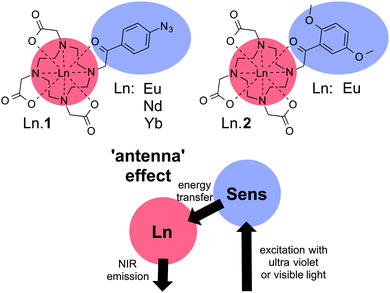
The dyes used in this study (Ln·1 and Ln·2) are shown in Chart 1. The synthesis and characterisation of Ln·1 have been reported elsewhere, where its capacity to sense hydrogen sulfide has also been reported.25 The reactive azide group was a cause for concern; consequently, we designed and synthesized Ln·2 (see ESI†) that has photophysical properties closely aligned with those of Ln·1, but adds better chemical stability than the hydrogen sulfide-responsive system Ln·1. Both compounds are kinetically stable lanthanide complexes of phenacyl-DO3A-derived ligands, in which the ligand acts as an octadentate N4O4 donor to the lanthanide, while the sensitising phenacyl chromophore is in direct contact with the metal centre.
In lanthanide complexes, direct excitation does not provide an effective pathway to the excited state due to the low molar absorptivity of f–f transitions (ε ∼ 1 M1 cm−1).12 Instead formation of the lanthanide excited state is commonly mediated through a sensitising chromophore, in a process commonly referred to as the antenna effect, where light is absorbed by the organic ligand and energy transfer occurs to the lanthanide centre (Chart 1),12 allowing efficient excitation of lanthanide excited states. In this case, the direct contact between the phenacyl-derived chromophore and the lanthanide was considered optimal for the formation of the excited state, allowing effective Dexter-type exchange mediated energy transfer. Furthermore, complexes were selected that could be addressed using a conventional microscopy set-up (405 nm excitation), while the lanthanide ions were selected to be emissive in the ‘biologically transparent window’, between 700 and 900 nm. To achieve this end, the phenacyl chromophores are ideal, in which a small singlet–triplet energy gap allows longer excitation wavelengths than might otherwise be compatible with sensitizing the emissive state of europium (5D0 energy 17![[thin space (1/6-em)]](https://www.rsc.org/images/entities/char_2009.gif) 250 cm−1).26,27 We also speculated that the addition of electron donating substituents in Ln·2 would confer additional stability to the complex, by enhancing the coordinating ability of the ketone carbonyl group.
250 cm−1).26,27 We also speculated that the addition of electron donating substituents in Ln·2 would confer additional stability to the complex, by enhancing the coordinating ability of the ketone carbonyl group.
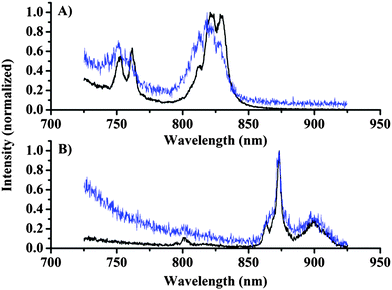
First, the emission of the lanthanide complexes Eu·2, Nd·1, and Yb·1 dissolved in D2O was investigated using the microscopy set-up shown in Fig. 1. The choice of solvent is dictated by the quenching of lanthanide centred emission by O–H oscillators; by using heavy water the lanthanide centred emission intensity is increased significantly, optimising the possibility of observing lanthanide centred signals.28 A drop of the complexes in D2O was placed on a cover slide and the cover slide was placed under the microscope, the concentration of the complexes was in the range of 0.1–1 mM determined by absorption spectroscopy. Emission spectra were recorded with the focal point in the bulk liquid and these measurements (Fig. 2, black line) clearly demonstrated the capability to measure spectra of europium (750 nm 5D0 → 4F5, 820 nm 5D0 → 4F6) and neodymium (880 nm 4F3/2 → 4I9/2) centred emissions, while the ytterbium centred emission (975 nm 2F5/2 → 2F7/2) was weak but could still be detected by increasing the dye concentration and the integration time significantly (see ESI†).
Fig. 2 shows the emission recorded from the solution along with emission spectra recorded from silica particles onto which the dyes were physisorbed (see the ESI† for details). The spectra of dyes on silica particles show a worse signal-to-noise ratio, but the spectral shape can be identified by cursory inspection of the data, and verified by comparison with the solution spectra. Thus, we are able to conclude that the photons originate from lanthanide-centred emission, and this fact allows spectrally resolved images to be recorded.
Next we performed spectral imaging of the silica particles covered by lanthanide complexes, in a nitrogen atmosphere to minimize photobleaching (see the ESI† for details). Fig. 3 shows an image recorded from two stained silica particles each stained with a different lanthanide dye. Fig. 3A shows the total intensity image (725–925 nm wavelength range), and an optical transmission image of the same two particles is given in Fig. 3D. By using a 700 nm longpass filter or a broad bandpass filter, it would not be possible to discriminate between the dyes on the particles. However, since the spectra are recorded in each pixel, it is possible to identify which dye is responsible for the emission detected at each pixel. Fig. 3B and C show the images where intensity has been spectrally selected to show background subtracted emission from europium (800–830 nm, Fig. 3B) and background subtracted neodymium centred emission (860–890 nm, Fig. 3C), thus demonstrating that the spectral signatures of the lanthanides can be used to resolve the nature of the particle labels.
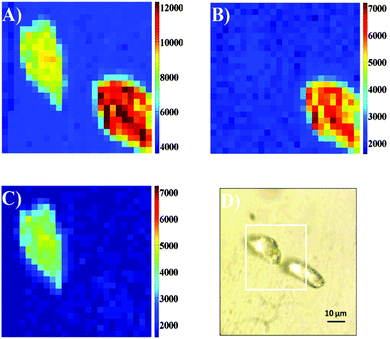 | ||
| Fig. 3 50 × 50 μm (25 × 25 pixels, 5 s integration time per pixel) confocal fluorescence images of silica beads dyed with Eu·2 and Nd·1. recorded following 375 nm excitation using a CCD-based spectrometer system with the beads in a N2-atmosphere; total imaging time 52 minutes. (A): Images were constructed by integrating the intensity in the spectral range 800–890 nm (background subtracted, see ESI†) (B): the image constructed by integrating the intensity in the spectral range 800–830 nm. (background subtracted, see ESI†) (C): the image constructed by integrating the intensity in the spectral range 860–890 nm. (background subtracted, see ESI†) (D): the optical transmission image showing the scan area (white square). | ||
Fig. 4 shows some examples of spectra recorded during the imaging. For presentation purposes, the spectra presented are the sum of the signals from 6 pixels. However, the emission spectra recorded from each pixel are of a high enough quality to produce images with a good signal, where the emission from the two different lanthanide centres are readily distinguished (see Fig. 3). The continuous decreasing slope in the spectrum is due to background emission from the dye and the silica particles (see ESI†). The spectral regions used for creating the images in Fig. 3 are indicated in green for the europium complex Eu·2 and in red for the neodymium complex Nd·1. The spectrally resolved images can also be background subtracted, where the narrow lanthanide-centred emission bands allow for a clear distinction between signals and background. By only counting photons in the appropriate region (Fig. 4) above a given background threshold, an improved contrast can be obtained. It should be noted that an intensity-based imaging method (a narrow bandpass filter before a point detector, e.g. PMT) cannot be used to conclude whether lanthanide centred emission or background emission gives rise to the observed signal (though these could obviously be separated using time-gated methods). To remove the background signal originating from chromophore fluorescence, we are working to optimise the energy transfer from the chromophores to minimise fluorescence and maximise the quantum yield for the formation of the triplet state (and hence minimise emission from the singlet state). Rapid energy transfer from the chromophore to the lanthanide centre will also help reduce chromophore bleaching; the probes used in this study undergo rapid photobleaching in the set-up used for imaging. The bleaching occurs at a similar rate disregarding the nature of the chromophore and the lanthanide centre. We assign this to the effect of the tightly focused UV light used. While the photostability of Ln·1 and Ln·2 is similar, the chemical stability of Ln·2 is much greater and this compound can be stored under ambient conditions, whereas rapid degradation of Ln·1 is seen if it is not kept cold and in the dark.
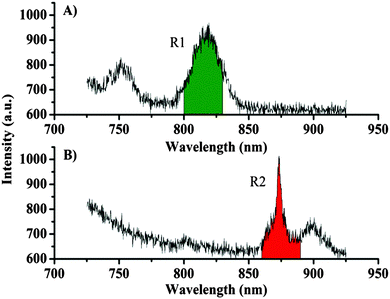 | ||
| Fig. 4 (A) Sum of spectra from 6 pixels from an image of a particle dyed with Eu·2. (B) Sum of spectra from 6 pixels from an image of a particle dyed with Nd·1. | ||
In summary, we have demonstrated spectral imaging of lanthanide emission bands in the NIR region of the spectrum, by using a sensitive confocal scanning microscope designed for use in the visible region of the spectrum. The spectral imaging technique can unambiguously detect the narrow lanthanide centred emission bands and we are currently working towards implementing a time-resolved version that will take advantage of the long lifetime of lanthanide centred emission in combination with NIR spectral imaging.
We thank the Universities of Oxford and Copenhagen for support and the Carlsberg Foundation (TJS), the Villum foundation (TV), the “Center for Synthetic Biology” at Copenhagen University funded by the UNIK research initiative of the Danish Ministry of Science, Technology and Innovation (Grant 09-065274, TV, ZL), bioSYNerg (University of Copenhagen's Excellence Programme for Interdisciplinary Research, TV), Christ Church (MT), and Keble College (TJS, SF) for financial support. We thank Claus Juul Løland for the use of a 375 nm pulsed laser.
Notes and references
- C. P. Montgomery, B. S. Murray, E. J. New, R. Pal and D. Parker, Acc. Chem. Res., 2009, 42, 925–937 CrossRef CAS PubMed.
- S. J. Butler and D. Parker, Chem. Soc. Rev., 2013, 42, 1652–1666 RSC.
- E. J. New, D. Parker, D. G. Smith and J. W. Walton, Curr. Opin. Chem. Biol., 2010, 14, 238–246 CrossRef CAS PubMed.
- J.-C. G. Bünzli, Chem. Rev., 2010, 110, 2729–2755 CrossRef PubMed.
- S. Faulkner, D. Parker and J. A. G. Williams, NATO ASI Series, 1999, 527, 53–66 CAS.
- E. G. Moore, A. P. Samuel and K. N. Raymond, Acc. Chem. Res., 2009, 42, 542–552 CrossRef CAS PubMed.
- L. D. Sun, Y. F. Wang and C. H. Yan, Acc. Chem. Res., 2014, 47, 1001–1009 CrossRef CAS PubMed.
- T. J. Sørensen, M. Tropiano, O. A. Blackburn, J. A. Tilney, A. M. Kenwright and S. Faulkner, Chem. Commun., 2013, 49, 783–785 RSC.
- Y. Zhang, L. Zhang, R. Deng, J. Tian, Y. Zong, D. Jin and X. Liu, J. Am. Chem. Soc., 2014, 136, 4893–4896 CrossRef CAS PubMed.
- L. J. Charbonniere, N. Hildebrandt, R. F. Ziessel and H. G. Lohmannsroben, J. Am. Chem. Soc., 2006, 128, 12800–12809 CrossRef CAS PubMed.
- D. Geißler, S. Stufler, H.-G. Löhmannsröben and N. Hildebrandt, J. Am. Chem. Soc., 2012, 135, 1102–1109 CrossRef PubMed.
- P. Hänninen and H. Härmä, Lanthanide Luminescence, Springer, Heidelberg, 2011 Search PubMed.
- A. Beeby, S. W. Botchway, I. M. Clarkson, S. Faulkner, A. W. Parker, D. Parker and J. A. G. Williams, J. Photochem. Photobiol., B, 2000, 57, 83–89 CrossRef CAS.
- M. Delbianco, V. Sadovnikova, E. Bourrier, G. Mathis, L. Lamarque, J. M. Zwier and D. Parker, Angew. Chem., Int. Ed., 2014, 53, 10718–10722 CrossRef CAS PubMed.
- L. Zhang, X. Zheng, W. Deng, Y. Lu, S. Lechevallier, Z. Ye, E. M. Goldys, J. M. Dawes, J. A. Piper, J. Yuan, M. Verelst and D. Jin, Sci. Rep., 2014, 4, 6597 CrossRef PubMed.
- B. Song, C. D. Vandevyver, A. S. Chauvin and J.-C. G. Bünzli, Org. Biomol. Chem., 2008, 6, 4125–4133 CAS.
- S. Faulkner, L. S. Natrajan, W. S. Perry and D. Sykes, Dalton Trans., 2009, 3890–3899 RSC.
- J.-C. G. Bünzli, J. Coord. Chem., 2014, 1–45 Search PubMed.
- D. Parker, R. S. Dickins, H. Puschmann, C. Crossland and J. A. K. Howard, Chem. Rev., 2002, 102, 1977–2010 CrossRef CAS PubMed.
- T. Zhang, X. Zhu, C. C. Cheng, W. M. Kwok, H. L. Tam, J. Hao, D. W. Kwong, W. K. Wong and K. L. Wong, J. Am. Chem. Soc., 2011, 133, 20120–20122 CrossRef CAS PubMed.
- A. Foucault-Collet, K. A. Gogick, K. A. White, S. Villette, A. Pallier, G. Collet, C. Kieda, T. Li, S. J. Geib, N. L. Rosi and S. Petoud, Proc. Natl. Acad. Sci. U. S. A., 2013, 110, 17199–17204 CrossRef CAS PubMed.
- A. Foucault-Collet, C. M. Shade, I. Nazarenko, S. Petoud and S. V. Eliseeva, Angew. Chem., Int. Ed., 2014, 53, 2927–2930 CrossRef CAS PubMed.
- A. D'Aleo, A. Bourdolle, S. Brustlein, T. Fauquier, A. Grichine, A. Duperray, P. L. Baldeck, C. Andraud, S. Brasselet and O. Maury, Angew. Chem., Int. Ed., 2012, 51, 6622–6625 CrossRef PubMed.
- Z. Liao, E. N. Hooley, L. Chen, S. Stappert, K. Müllen and T. Vosch, J. Am. Chem. Soc., 2013, 135, 19180–19185 CrossRef CAS PubMed.
- M. Tropiano and S. Faulkner, Chem. Commun., 2014, 50, 4696–4698 RSC.
- A. Dadabhoy, S. Faulkner and P. G. Sammes, J. Chem. Soc., Perkin Trans. 2, 2000, 2359–2360 RSC.
- A. Dadabhoy, S. Faulkner and P. G. Sammes, J. Chem. Soc., Perkin Trans. 2, 2002, 348–357 RSC.
- A. Beeby, I. M. Clarkson, R. S. Dickins, S. Faulkner, D. Parker, L. Royle, A. S. de Sousa, J. A. G. Williams and M. Woods, J. Chem. Soc., Perkin Trans. 2, 1999, 493–504 RSC.
Footnote |
| † Electronic supplementary information (ESI) available: Spectroscopic characterisation, methods and materials, additional imaging examples and details of data analysis. See DOI: 10.1039/c4cc09618e |
| This journal is © The Royal Society of Chemistry 2015 |

