Cancer-targeted near infrared imaging using rare earth ion-doped ceramic nanoparticles
Tamotsu
Zako
*a,
Miya
Yoshimoto
ab,
Hiroshi
Hyodo†
b,
Hidehiro
Kishimoto
cd,
Masaaki
Ito
e,
Kazuhiro
Kaneko
e,
Kohei
Soga
*b and
Mizuo
Maeda
ab
aBioengineering Laboratory, RIKEN, 2-1 Hirosawa, Wako, Saitama 351-0198, Japan. E-mail: zako@riken.jp
bDepartment of Materials Science and Technology, Tokyo University of Science, 6-3-1 Niijuku, Katsushika, Tokyo 125-8585, Japan. E-mail: mail@ksoga.com
cResearch Institute for Biomedical Sciences, Tokyo University of Science, 2669 Yamazaki, Noda, Chiba 278-0022, Japan
dGraduate School of Medicine, University of the Ryukyus, 207 Aza Uehara, Nishihara, Nakagami, Okinawa 903-0215, Japan
eNational Cancer Center Hospital East, 6-5-1 Kashiwanoha, Kashiwa, Chiba 277-8577, Japan
First published on 2nd September 2014
Abstract
The use of near-infrared (NIR) light over 1000 nm (OTN-NIR or second NIR) is advantageous for bioimaging because it enables deep tissue penetration due to low scattering and autofluorescence. In this report, we describe the application of rare earth ion-doped ceramic nanoparticles to cancer-targeted NIR imaging using erbium and ytterbium ion-doped yttrium oxide nanoparticles (YNP) functionalized with streptavidin via bi-functional PEG (SA-YNP). YNP has NIR emission at 1550 nm, with NIR excitation at 980 nm (NIR–NIR imaging). Cancer-specific NIR–NIR imaging was demonstrated using SA-YNP and biotinylated antibodies on cancer cells and human colon cancer tissues. NIR–NIR imaging through porcine meat of 1 cm thickness was also demonstrated, supporting the possible application of deep tissue NIR–NIR bioimaging using YNP as a probe. Our results suggest that non-invasive imaging using YNP has great potential for general application in cancer imaging in living subjects.
Introduction
Fluorescence bioimaging is a technique for the visualization of biological phenomena both in vivo and in vitro, and represents one of the key technologies in the field of biomedical research. However, due to the short wavelength of excitation and emission light used in fluorescence bioimaging, there are several drawbacks: (1) the light cannot penetrate tissues deeply due to absorption and scattering; (2) photo-toxicity damage to biological subjects by high-energy light excitation.1Fluorescence bioimaging using near-infrared (NIR) light is expected to have a major impact on biomedical imaging as the NIR region (700–1800 nm) is located within the so-called ‘biological window’, where the light penetrates deeper into tissues with less damage, given its lower energy and reduced propensity to scatter.1,2–4 NIR light with a wavelength longer than 1000 nm, called ‘OTN (over a thousand nm)-NIR’ or ‘second NIR’, has recently attracted attention as it can penetrate living tissue more deeply than the first NIR window (700–900 nm) due to lower endogenous autofluorescence.2–8 However, the lack of biocompatible fluorescent dyes active in the OTN-NIR region has prevented its use in biomedical applications. So far, there have been only a few reports concerning such fluorescent dyes. For example, single-walled carbon nanotubes (SWCNT) and Ag2S quantum dots have been reported to work in the OTN-NIR region.7 These dyes can be excited by the first NIR window light (800 nm) to emit OTN-NIR fluorescence.
Rare-earth doped ceramics could be good candidates for OTN-NIR fluorescent probes, since these are known to emit fluorescence efficiently in the OTN-NIR wavelength region by OTN-NIR excitation. The authors have reported that erbium (Er) and ytterbium (Yb) ion-doped yttrium oxide (Y2O3) nanoparticles (YNP) display NIR fluorescence at 1550 nm with NIR excitation at 980 nm.8–10 YNP is also capable of upconversion emission, wherein visible light is emitted upon NIR excitation.2,11–13 It was also reported that RGD peptide-modified YNP can be used for cancer cell upconversion imaging.13
We have developed an NIR imaging system consisting of a NIR excitation laser and an InGaAs CCD camera capable of imaging wavelengths between 800 and 2000 nm.2,8 The advantage of this NIR–NIR imaging is that both excitation and emission light can penetrate deep into/from tissues, which enables imaging of the target inside the tissues.8 Previously NIR–NIR imaging of mice tumours using SWCNT, Ag2S or rare earth ion-doped NaYF4 was demonstrated, where dyes were accumulated in tumours with an enhanced permeability and retention effect.14 In the present report, we describe for the first time cancer-specific NIR–NIR imaging using YNP modified with streptavidin (SA) via heterofunctional poly(ethylene glycol) (PEG). By combining SA-modified YNP and biotinylated cancer-specific antibodies, cancer specific NIR–NIR imaging is possible.
The advantage of SA-modified YNP is that any biotinylated antibody can be used, making this technique universally applicable. Here, the biotinylated antibody to epithelial cell adhesion molecule (EpCAM) was employed as an example. EpCAM is known to be overexpressed in many types of cancer and has been used in other studies as a metastatic carcinoma marker.15,16 We demonstrate cancer-specific NIR–NIR imaging using SA-modified YNP and biotinylated anti-EpCAM antibody on both cancer cells and human cancer tissues (colon cancer, stage III). We also demonstrate that OTN-NIR excitation and emission light can penetrate porcine (i.e. pig, swine) meat of 1 cm thickness, supporting the potential application in deep tissue NIR–NIR bioimaging using YNP. Thus, we expect that non-invasive imaging using YNP will have great potential for application in cancer imaging.
Experimental
Materials
Y(NO3)3·6H2O, Er(NO3)3·5H2O, Yb(NO3)3·5H2O and 3-aminopropyltrimethoxysilane (APTES) were purchased from Sigma-Aldrich (MO, USA). Urea and streptavidin (SA) were obtained from Wako (Osaka, Japan).Eagle's minimal essential cell culture medium with Earle's salts (E-MEM) was purchased from Wako. All other cell culture reagents, including fetal bovine serum (FBS), non-essential amino acids (NEAA), sodium pyruvate and penicillin–streptomycin were purchased from GIBCO-Invitrogen (CA, USA). Biotinylated mouse monoclonal anti-EpCAM antibody was purchased from Abcam (Cambridge, UK). Deionized Milli-Q water (Millipore, MA, USA) was used throughout.
YNP synthesis, surface modification and characterization
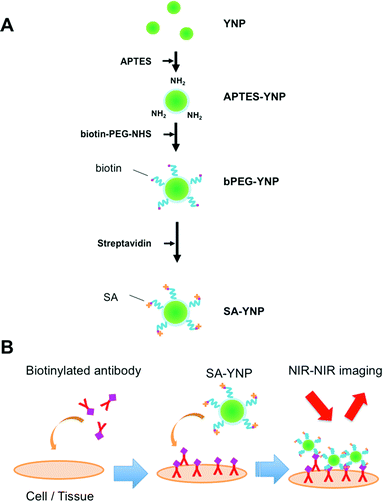
YNP was prepared by the homogeneous precipitation method as described with a slight modification.8,17 Twenty mM Y(NO3)3, 0.2 mM Yb(NO3)3, 0.15 mM Er(NO3)3 and 4 mM urea were dissolved in purified water, and stirred for 1 h at 90 °C. The obtained precipitates were separated by centrifugation, and dried at 80 °C overnight. The precursors were calcined at 1100 °C for 30 min. The size of the prepared YNP was estimated with FE-SEM (S-4200, Hitachi Ltd, Tokyo, Japan) and DLS (ZetasizerNano, Malvern, Worcestershire, UK). The cumulant method was used for the DLS analysis.The YNP surface was covalently modified with biotinylated PEG using the silane coupling method as previously described, with modifications8,9,13 (Fig. 1A). YNP (50 mg) was suspended in 5 mL water and subjected to ultrasonication for 10 min. After the addition of 45 mL of 2-propanol and 300 μL of APTES, the mixture was stirred for 24 h at 70 °C. Particles were then isolated, washed three times with ethanol by centrifugation, and finally dried in air at room temperature. The APTES-modified YNP (APTES-YNP, 8 mg) was suspended in 5 mL 2-propanol, to which 8 mg of heterofunctional PEG bearing N-hydroxysuccinimide (NHS) and biotin at the both ends (NHS-PEG-biotin) (Mw = 5000, Santa Cruz Biotechnology, TX, USA) was added and stirred for 6 h at 50 °C. The biotinylated PEG modified APTES-YNP (bPEG-YNP) was isolated, washed four times with water by centrifugation, and dried in air at room temperature. PEG modification was characterized with an FTIR spectrometer (FTIR-6200, Jasco, Tokyo, Japan) and thermogravimetric analyses (DTG-60, Shimadzu, Kyoto, Japan) as described.12 The dispersion stability of bPEG-YNP in 20 mM HEPES, pH 7.4, and 150 mM NaCl, which corresponds to a physiological condition, was examined by measuring solution turbidity with a UV spectrometer (V-670, Jasco) as described.12
For SA modification, bPEG-YNP in 10 mM HEPES buffer, pH 8.0 (1.0 mg mL−1) was mixed with 0.34 μM SA, and the mixture was stirred for 1 h at room temperature. The SA modified bPEG-YNP (SA-YNP) were isolated, washed three times with water by centrifugation, and resuspended in the same volume of 10 mM HEPES buffer. The amount of bound SA was estimated by determining the concentration of unbound SA in the supernatant after incubation with the micro BCA assay kit (Invitrogen) using SA as a standard. The function of bound SA was confirmed by observing binding of SA-YNP on a biotinylated plate. The biotinylated glass slide was prepared as follows: 15 μL of 3 mM NHS-biotin (Dojindo, Kumamoto, Japan) was spotted onto amino group coated-glass slides (High Density Amine Coated Slides, Matsunami Glass Ind., Osaka, Japan). After incubation for 3 h at room temperature in a moisture box and washing with water, 20 μL of SA-YNP (1 mg mL−1 in 10 mM HEPES buffer, pH 8.0) was spotted and further incubated for 1 h at room temperature. bPEG-YNP was used as a negative control. After washing with water, the glass slides were observed with the NIR microscopy system as described below.
Cancer cell imaging
Human MCF-7 (high EpCAM expression) breast carcinoma cells and U87MG (low EpCAM expression) glioblastoma cells were purchased from European Collection of Cell Cultures. MCF-7 cells were grown in the E-MEM medium with 10% FBS, 1% NEAA and 1% penicillin–streptomycin in 5% CO2 at 37 °C. U87MG cells were grown in the E-MEM medium with 10% FBS, 1% NEAA, 1 mM sodium pyruvate and 1% penicillin–streptomycin in 5% CO2 at 37 °C. Cells were detached from the cell culture dish with trypsin-EDTA for passage.Cells were suspended in 190 μL of the medium at a density of 20![[thin space (1/6-em)]](https://www.rsc.org/images/entities/char_2009.gif) 000 cells mL−1, and incubated with 8 μL of biotinylated anti-EpCAM in a sample tube for 30 min at room temperature with rotation. Cells were then washed three times with PBS, and then 190 μL of the medium was added. Then 10 μL of 1 mg mL−1 SA-YNP was added, and incubated for 1 h at room temperature with rotation. Afterward, cells were washed three times with PBS, and then 200 μL of the medium was added. Cells stained without an antibody were used as a negative control.
000 cells mL−1, and incubated with 8 μL of biotinylated anti-EpCAM in a sample tube for 30 min at room temperature with rotation. Cells were then washed three times with PBS, and then 190 μL of the medium was added. Then 10 μL of 1 mg mL−1 SA-YNP was added, and incubated for 1 h at room temperature with rotation. Afterward, cells were washed three times with PBS, and then 200 μL of the medium was added. Cells stained without an antibody were used as a negative control.
Cells were plated in an 8-well culture slide, and fixed with paraformaldehyde (4%) in PBS for 15 min at room temperature, washed three times with PBS and mounted with VECTASHIELD mounting medium (Vector Laboratories, Burlingame, CA, USA). Imaging of SA-YNP on cancer cells by detecting the NIR emission under NIR excitation was performed using an inverted microscopy system (IX71, Olympus, Tokyo, Japan). The YNP was illuminated with a continuous-wave laser diode (980 nm, 1000 mA, L9418-04, Hamamatsu Photonics (Shizuoka, Japan)). The NIR emission images were collected with ×20 objective through a longpath filter (1050 nm, Edmund Optics, NJ, USA). Images were taken using an InGaAs CCD camera (XEVA-1.7, Xenics, Leuven, Belgium).
Cancer tissue imaging
Human colon tumour tissue (stage III, paraffin embedded, US Biomax, MD, USA) was deparaffinised by incubating the slides with xylene and ethanol, activated by pepsin, and blocked with 10% goat serum. Tissue slides were washed three times with PBS including 0.1% Tween 20 (PBST), and incubated with anti-EpCAM (1![[thin space (1/6-em)]](https://www.rsc.org/images/entities/char_2009.gif) :
:![[thin space (1/6-em)]](https://www.rsc.org/images/entities/char_2009.gif) 100 dilution in 100 mM Tris-HCl, pH 7.5 and 150 mM NaCl, 5 mg mL−1 blocking reagent (Perkin Elmer, MA, USA)) for 30 min at room temperature in a moist chamber. Slides were then washed three times with PBST buffer and incubated with 1 mg mL−1 SA-YNP for 1 h at room temperature in a moist chamber. After washing with PBST three times, the slides were observed with the NIR-imaging microscopy system as described above. Tissues stained without an antibody were used as a negative control.
100 dilution in 100 mM Tris-HCl, pH 7.5 and 150 mM NaCl, 5 mg mL−1 blocking reagent (Perkin Elmer, MA, USA)) for 30 min at room temperature in a moist chamber. Slides were then washed three times with PBST buffer and incubated with 1 mg mL−1 SA-YNP for 1 h at room temperature in a moist chamber. After washing with PBST three times, the slides were observed with the NIR-imaging microscopy system as described above. Tissues stained without an antibody were used as a negative control.
NIR imaging through porcine meat
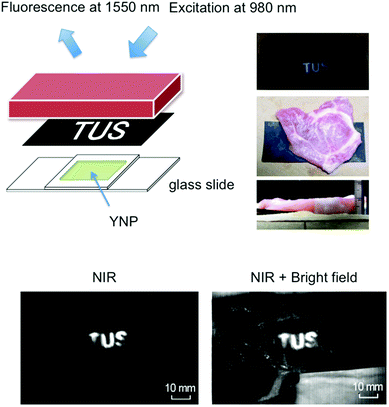
To demonstrate the efficacy of NIR imaging using YNP, the emission of YNP was observed through porcine meat of 1 cm thickness. YNP (0.6 g) was dissolved in 2.25 mL of acetone, mixed with nail polish solution (3 g), and solidified in 2 cm square area. Black carbon paper with the lettering (‘TUS’) cut out was placed between the solidified YNP and the porcine meat (Fig. 5). Imaging of NIR emission at 1550 nm upon excitation at 980 nm was carried out using a NIS-OPT system (Shimadzu), consisting of excitation laser, laser scanner for planer irradiation and an InGaAs CCD camera.2,5,18Results and discussion
YNP synthesis, surface modification and characterization
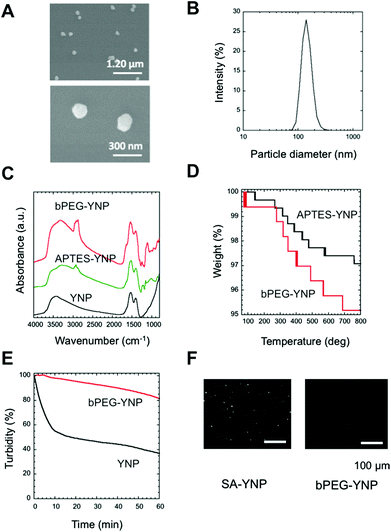
In order to develop an NIR probe for cancer targeted imaging, SA was attached on the surface of biotinylated PEG-modified YNP after the attachment of heterofunctional biotin-PEG-NHS on the APTES modified YNP (Fig. 1A). PEG was attached to YNP to increase the dispersion stability of YNP in aqueous milieu and to reduce the nonspecific binding of YNP to biological cells and tissues.4,12,19In order to obtain sufficient NIR emission, YNP larger than 150 nm was preferred for NIR–NIR imaging.2Fig. 2A displays an SEM image of YNP by homogeneous precipitation and calcination at 1100 °C for 30 min. As shown in the figure, non-agglomerated nanoparticles with a diameter of approximately 150 nm sizes were successfully obtained. This estimated diameter was also confirmed by DLS analysis; particles were found to be 147 ± 6 nm in diameter (Fig. 2B). The polydispersity index (PDI) value was approximately 0.3, supporting that the particles were mono-dispersed.
To confirm surface modification by APTES and PEG, FT-IR spectra of the samples were measured (Fig. 2C). The spectrum of APTES-YNP showed an absorption peak at around 2900 cm−1, due to disordered alkyl chains in APTES. The absorption at 1107 cm−1 suggests the presence of a Si–O–Si bond originating from polymerized APTES. The stronger absorption peaks at 1100 and 2900 cm−1 in the spectrum of the bPEG-YNP were assigned to those of C–O–C bonds and C–H stretches in PEG. We concluded that the surface of the APTES-YNP was successfully modified with PEG chains.
The amount of attached PEG was estimated using thermogravimetry (Fig. 2D). As shown in the figure, thermal decomposition of APTES-YNP and bPEG-YNP proceeded gradually from 100 °C. Difference in the weight loss between these YNP with increasing temperature 800 °C was calculated to be 2.0%, corresponding to the quantity of the attached PEG (0.34 chains nm−2 (23![[thin space (1/6-em)]](https://www.rsc.org/images/entities/char_2009.gif) 070 chains per particle)). This PEG density is similar to that of thiol-PEG (5000 Da) immobilized on a gold surface as determined by ellipsometry measurements.20
070 chains per particle)). This PEG density is similar to that of thiol-PEG (5000 Da) immobilized on a gold surface as determined by ellipsometry measurements.20
The dispersion stability of bPEG-YNP and unmodified YNP in HEPES buffer was evaluated by monitoring changes in turbidity with time. As shown in Fig. 2E, the dispersion stability was significantly improved by PEG modification.
The quantity of bound SA on the YNP surface was calculated from the concentration of unbound SA in the supernatant (0.16 μM). The number of SA molecules was found to be 926 molecules per particle. The relatively low immobilization ratio of SA per PEG moiety (4.0%) might be due to steric hindrance of SA molecules, since the maximum number of SA was calculated to be approximately 1900 molecules per particle, considering the size of SA (6 × 6 nm21). The functionality of immobilized SA was confirmed by determining its interaction with biotin plates (Fig. 2E). As shown in the figure, binding of SA-YNP to biotin plates was observed with NIR–NIR imaging. The binding of SA-YNP to biotin plate was significantly more efficient than that of bPEG-YNP, supporting the finding that SA immobilized on YNP is indeed capable of binding biotin. NIR fluorescence was clearly observed, indicating that SA-YNP can be used for NIR–NIR imaging with a NIR microscopy system.
Cancer cell imaging
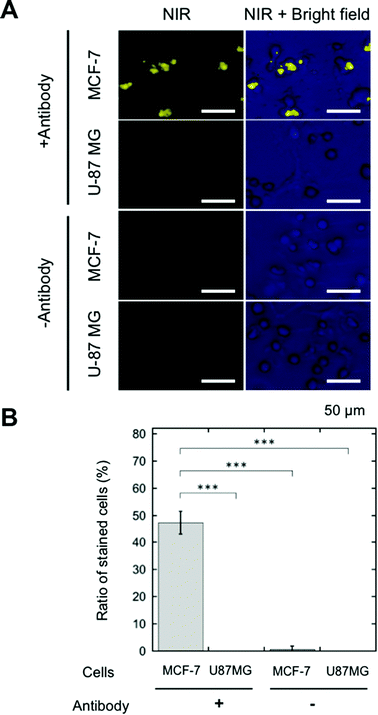
SA-YNP was applied to enable NIR–NIR imaging of cancer cells. First, in order to ensure that cells were sufficiently bound to the antibody, cancer cells were incubated with biotinylated anti-EpCAM. Then, SA-YNP was applied to enable the imaging of the cancer cells (Fig. 1B).To determine whether or not our imaging was dependent on EpCAM expression levels, two different cell lines, MCF-7 (human breast cancer, high EpCAM expression) and U87MG (human glioblastoma, low EpCAM expression), were used.15 When EpCAM-negative U87MG cells were used, no NIR fluorescence signal from YNP was observed (Fig. 3A). In contrast, NIR fluorescence from EpCAM-positive MCF-7 cells was clearly observed. Control experiments without an antibody showed that no NIR fluorescence was observed, suggesting that SA-YNP and EpCAM-positive cancer cells interact specifically via the biotinylated anti-EpCAM antibody. Subsequent statistical analysis strongly supports these results (Fig. 3B).
Cancer tissue imaging
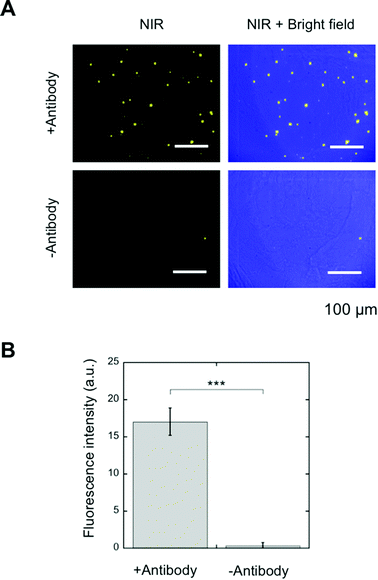
SA-YNP and biotinylated anti-EpCAM antibody were further applied to the NIR–NIR imaging of cancer tissues (Fig. 1B). Human colon cancer (stage III) was used for this experiment, as colon cancer is reported in the literature to display high EpCAM expression.16 The expression of EpCAM in the tissue was confirmed using the anti-EpCAM (data not shown). The colon cancer tissue slides were incubated with biotinylated anti-EpCAM following incubation with SA-YNP and observed with the NIR microscopy system. As shown in Fig. 4A, NIR fluorescence from SA-YNP by NIR excitation was observed for cancer tissues incubated with an antibody, whereas no fluorescence was observed for tissues without antibody incubation. These results clearly indicate that cancer tissue-specific NIR–NIR imaging using SA-YNP and biotinylated antibody is indeed possible. Statistical analysis also supports antibody-dependent NIR–NIR imaging (Fig. 4B).These results also indicate that PEGylation of YNP significantly prevented its non-specific binding to cells and tissues. Despite possible residual cationic charges by the unreacted APTES moiety that may cause cellular interaction,22 PEG modification of YNP was efficient to prevent its non-specific binding.
NIR imaging of YNP through porcine meat
To determine the robustness and clinical potential of NIR–NIR imaging using YNP, we challenged our technique via imaging through porcine meat of 1 cm thickness. It has been shown that pig tissue is physiologically and optically similar to human tissue.8,23 Various imaging techniques have also been developed using porcine tissue as a pre-human validation model.24 As shown in Fig. 5, NIR fluorescence from YNP by NIR excitation could be clearly observed through the meat, supporting the notion that cancer detection by NIR–NIR imaging through the body may be possible.Conclusions
In conclusion and to the best of our knowledge, this is the first study to demonstrate cancer cell and tissue-targeted NIR–NIR imaging with SA-modified YNP and biotinylated cancer-specific antibodies. A particular advantage of this method is that many different antibodies can be used, enabling the study of a broad range of cancer types. NIR–NIR bioimaging using YNP shows significant promise for use in early, non-invasive cancer detection, because of its ability to penetrate deeper into the tissue, thus making it a potentially powerful tool.Acknowledgements
The authors thank Dr Takeshi Kuwata (National Cancer Center Hospital East) for technical advice for the tissue staining. This work was financially supported by New Energy and Industrial Technology Development Organization (NEDO) of Japan, RIKEN, and National Cancer Center Research & Development Fund (26-A-17) and Accelerating Regulatory Science Initiative (H-24), and by Program for Development of Strategic Research Center in Private Universities supported by Ministry of Education, Culture, Sport, Science, and Technology, Japan (MEXT) and Tokyo University of Science, 2009–2013 (S0901020).Notes and references
- J. O. Escobedo, O. Rusin, S. Lim and R. M. Strongin, Curr. Opin. Chem. Biol., 2010, 14, 64 CrossRef CAS PubMed; L. Yuan, W. Lin, K. Zheng, L. He and W. Huang, Chem. Soc. Rev., 2013, 42, 622 RSC.
- E. Hemmer, N. Venkatachalam, H. Hyodo, A. Hattori, Y. Ebina, H. Kishimoto and K. Soga, Nanoscale, 2013, 5, 11339 RSC.
- A. M. Smith, M. C. Mancini and S. Nie, Nat. Nanotechnol., 2009, 4, 710 CrossRef CAS PubMed.
- K. Soga, K. Tokuzen, K. Tsuji, T. Yamano, H. Hyodo and H. Kishimoto, Eur. J. Inorg. Chem., 2010, 2673 CrossRef CAS PubMed.
- M. Kamimura, N. Kanayama, K. Tokuzen, K. Soga and Y. Nagasaki, Nanoscale, 2011, 3, 3705 RSC.
- L. A. Sordillo, Y. Pu, S. Pratavieira, Y. Budansky and R. R. Alfano, J. Biomed. Opt., 2014, 19, 56004 CrossRef CAS PubMed; G. Hong, J. C. Lee, J. T. Robinson, U. Raaz, L. Xie, N. F. Huang, J. P. Cooke and H. Dai, Nat. Med., 2012, 18, 1841 CrossRef PubMed.
- K. Welsher, Z. Liu, S. P. Sherlock, J. T. Robinson, Z. Chen, D. Daranciang and H. Dai, Nat. Nanotechnol., 2009, 4, 773 CrossRef CAS PubMed; K. Welsher, S. P. Sherlock and H. Dai, Proc. Natl. Acad. Sci. U. S. A., 2011, 108, 8943 CrossRef PubMed; Y. Zhang, G. Hong, Y. Zhang, G. Chen, F. Li, H. Dai and Q. Wang, ACS Nano, 2012, 6, 3695 CrossRef PubMed.
- T. Zako, H. Hyodo, K. Tsuji, K. Tokuzen, H. Kishimoto, M. Ito, K. Kaneko, M. Maeda and K. Soga, J. Nanomater., 2010, 2010, 491471 Search PubMed.
- N. Venkatachalam, T. Yamano, E. Hemmer, H. Hyodo, H. Kishimoto and K. Soga, J. Am. Ceram. Soc., 2013, 96, 2759 CrossRef CAS PubMed.
- K. Soga, K. Tokuzen, K. Fukuda, H. Hyodo, E. Hemmer, N. Venkatachalm and H. Kishimoto, J. Photopolym. Sci. Technol., 2012, 25, 57 CrossRef CAS.
- M. Kamimura, D. Miyamoto, Y. Saito, K. Soga and Y. Nagasaki, Langmuir, 2008, 24, 8864 CrossRef CAS PubMed; K. Soga, A. Okada and M. Yamada, J. Photopolym. Sci. Technol., 2006, 19, 45 CrossRef.
- T. Zako, H. Nagata, N. Terada, M. Sakono, K. Soga and M. Maeda, J. Mater. Sci., 2008, 43, 5325 CrossRef CAS PubMed.
- T. Zako, H. Nagata, N. Terada, A. Utsumi, M. Sakono, M. Yohda, H. Ueda, K. Soga and M. Maeda, Biochem. Biophys. Res. Commun., 2009, 381, 54 CrossRef CAS PubMed.
- G. Hong, J. T. Robinson, Y. Zhang, S. Diao, A. L. Antaris, Q. Wang and H. Dai, Angew. Chem., Int. Ed., 2012, 51, 9818 CrossRef CAS PubMed; D. J. Naczynski, M. C. Tan, M. Zevon, B. Wall, J. Kohl, A. Kulesa, S. Chen, C. M. Roth, R. E. Riman and P. V. Moghe, Nat. Commun., 2013, 4, 2199 Search PubMed; J. T. Robinson, G. Hong, Y. Liang, B. Zhang, O. K. Yaghi and H. Dai, J. Am. Chem. Soc., 2012, 134, 10664 CrossRef PubMed.
- J. P. Stephan, S. Schanz, A. Wong, P. Schow and W. L. Wong, Am. J. Pathol., 2002, 161, 787 CrossRef.
- M. Trzpis, P. M. McLaughlin, L. M. de Leij and M. C. Harmsen, Am. J. Pathol., 2007, 171, 386 CrossRef CAS PubMed.
- N. Venkatachalam, Y. Saito and K. Soga, J. Am. Ceram. Soc., 2009, 92, 1006 CrossRef CAS PubMed.
- E. Hemmer, H. Takeshita, T. Yamano, T. Fujiki, Y. Kohl, K. Low, N. Venkatachalam, H. Hyodo, H. Kishimoto and K. Soga, J. Mater. Sci. Mater. Med., 2012, 23, 2399 CrossRef CAS PubMed.
- J. V. Jokerst, T. Lobovkina, R. N. Zare and S. S. Gambhir, Nanomedicine, 2011, 6, 715 CrossRef CAS PubMed.
- K. Yoshimoto, T. Hirase, J. Madsen, S. P. Armes and Y. Nagasaki, Macromol. Rapid Commun., 2009, 30, 2136 CrossRef CAS PubMed.
- W. A. Hendrickson, A. Pahler, J. L. Smith, Y. Satow, E. A. Merritt and R. P. Phizackerley, Proc. Natl. Acad. Sci. U. S. A., 1989, 86, 2190 CrossRef CAS.
- S. J. Tan, N. R. Jana, S. Gao, P. K. Patra and J. Y. Ying, Chem. Mater., 2010, 22, 2239 CrossRef CAS; L. C. Cheng, X. Jiang, J. Wang, C. Chen and R. S. Liu, Nanoscale, 2013, 5, 3547 RSC.
- J. K. Lunney, Int. J. Biol. Sci., 2007, 3, 179 CrossRef CAS; T. P. Sullivan, W. H. Eaglstein, S. C. Davis and P. Mertz, Wound Repair Regen., 2001, 9, 66 CrossRef.
- S. J. Ellner, J. Mendez, D. R. Vera, C. K. Hoh, W. L. Ashburn and A. M. Wallace, Ann. Surg. Oncol., 2004, 11, 674 CrossRef CAS PubMed; B. B. Goldberg, D. A. Merton, J. B. Liu, M. Thakur, G. F. Murphy, L. Needleman, A. Tornes and F. Forsberg, Radiology, 2004, 230, 727 CrossRef PubMed; E. I. Altinoglu, T. J. Russin, J. M. Kaiser, B. M. Barth, P. C. Eklund, M. Kester and J. H. Adair, ACS Nano, 2008, 2, 2075 CrossRef PubMed.
Footnote |
| † Current address: Institute of Multidisciplinary Research for Advanced Materials, Tohoku University, 2-1-1 Katahira, Aoba, Sendai, Miyagi 980-8577, Japan. |
| This journal is © The Royal Society of Chemistry 2015 |

