 Open Access Article
A preliminary investigation to group disparate batches of licit and illicit diazepam tablets using differential scanning calorimetry
S.
Bibi
a,
D. H.
Bremner
b,
M.
Macdougall-Heasman
b,
R.
Reid
a,
K.
Simpson
c,
A.
Tough
a,
S.
Waddell
a,
I. J.
Stewart
b and
K. H.
Matthews
*a
aSchool of Pharmacy and Life Sciences, Robert Gordon University, Riverside East, Garthdee Road, Aberdeen AB10 7GJ, UK. E-mail: k.h.matthews@rgu.ac.uk
bSchool of Science, Engineering and Technology, Abertay University, Bell Street, Dundee DD1 1HG, UK
cSpecialist Crime Division, Police Scotland, 173 Pitt Street, Glasgow G2 4JS, UK
First published on 20th August 2015
Abstract
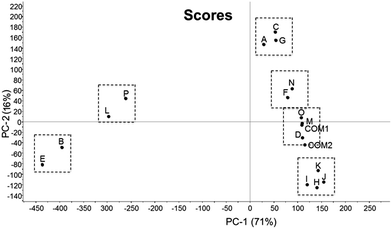
Increasing numbers of illicit and unlicensed medicines are in general circulation and regularly seized by the police and other regulatory authorities. Forensic identification of seized tablets tends to focus on visual appearance and chromatographic identification of the contained drug. This process is relatively time consuming and places a strain on forensic laboratories. It was therefore of interest to investigate the possible application of differential scanning calorimetry (DSC) as a fast and efficient tool to facilitate the identification of contained drug/s and associated tablet excipients. Sixteen different cases (Cases A to P) of diazepam tablets obtained from Police Scotland were characterised based on visual appearance (colour and manufacturers' logos), physical attributes (size, weight and hardness), drug type, drug quantity (HPLC) and thermal properties (DSC). Raw DSC data was further processed using principal component analysis (PCA) as an objective assessment of the thermograms obtained with a view to statistical grouping of different cases. Cases J/K, M/O and L/P could be paired on visual appearance and Cases B/C/E/G and J/K/L/P on tablet hardness (17–23 and 80–89 N respectively). HPLC indicated that 75% of the cases examined contained diazepam but less than half of these contained the recognised amount (10 mg); Cases B/E/L/P contained phenazepam and J/K contained etizolam. The thermal signatures of individual tablets provided by DSC produced qualitative information about both drugs and excipients, indicating lactose in Cases D/F/H/I/J/K/M/N/O and Emcompress™ in B/E/L/P. In particular, DSC coupled with PCA provided confident groupings of A/C/G, B/E/L/P and H/I/J/K, and specific pairings of B/E, L/P and F/N.
1 Introduction
It is recognised that although the prevalence of prescribed dose benzodiazepines is generally declining, that of illicit (non-prescribed) use has been rising steeply since the 1980s and now presents a major health problem.1,2 Global estimates of non-medical use of prescription drugs are generally not available despite such use remaining a major public health concern but the misuse or non-medical use of benzodiazepines remains high and, at times, higher than that of many illicit (non-licensed) substances.3 Polydrug users, particularly heroin addicts and those on methadone medication, use benzodiazepines to enhance the effect of the opioids.4,5 Benzodiazepines are also often cited among other substances reported in both fatal and non-fatal overdose cases concerning opioid users. In Scotland, the misuse of benzodiazepines has been directly linked, or been a contributor to, drug related deaths, with benzodiazepines noted in 28% of the fatalities reported during 2013 and diazepam specifically in 20% of all deaths.6 This is slightly down on the previous year's statistics of 34% for ‘any benzodiazepine’ and 27% for diazepam.2Control of these drugs in the UK is compromised by the increase in the amount of diazepam, for example, purchased from online pharmacies outside the European Union, mainly China and India, where the counterfeit trade appears to be sophisticated.3 Although medicinal solutions of this anxiolytic are legitimately available for oral and intravenous injection; as are tablets containing 2, 5 and 10 mg of the active,7 the 10 mg tablets are most commonly abused.
Apart from the necessary qualitative and quantitative analyses of drug type and content, other important tablet characteristics such as appearance (colour and identifying marks) and physical attributes such as size, shape, weight and hardness, can all contribute to forensic classification. Licitly produced tablets (tablets licensed in the UK) would be expected to conform to recognised national pharmacopoeial standards whereas illicitly produced tablets would not necessarily be subject to the same rigorous rules. Previous work using advanced chromatographic and spectroscopic methods, e.g. GC-MS, HPLC and SEM-EDXA, indicated that apart from a lack of control in drug quality, quantity and even drug type, diazepam tablets being sold illicitly often bear a variety of genuine manufacturers' logos that serve to confuse the issue of forensic identification.8 In these preliminary studies, 39% of the individually seized batches contained the expected quantity of diazepam while 5% contained a lesser amount. More worryingly, 32% contained a much higher than expected level of diazepam with one batch containing 48 mg of the active ingredient i.e. almost five-times the recommended dose. Surprisingly, 24% of the batches tested were found to contain the much more potent and unlicensed (in the UK) phenazepam and the similarly unclassified thienotriazolodiazepine, etizolam.
In addition to drug analysis, identification and characterisation of tablet excipients, i.e. pharmacologically inert materials that are blended with the pure drug to enable tablet production, was also of interest when classifying tablets. To this end, differential scanning calorimetry (DSC) was investigated for ‘thermal profiling’ of unknown tablets. DSC is a non-standard technique in the forensic identification of tablets despite being well-established as a key analytical tool in preformulation studies within the pharmaceutical sector.9–11 The method involves heating a small amount (<10 mg) of powdered sample, contained in a closed aluminium pan, in a furnace alongside an empty pan and recording the temperature difference between both pans, Fig. 1. Changes to the heat capacity of the sample are indicative of phase changes or chemical reactions within the sample and are characteristic for individual samples. Thermal events encountered typically include dehydration, recrystallization, melting and degradation. For example, diazepam tablets containing the common excipient lactose would be expected to show a signal for the melting of the drug and the dehydration and melting/degradation of lactose.12 This well-established thermoanalytical technique was applied to the analysis of disparate tablet seizures supplied by Police Scotland and the raw data further processed using principal component analysis (PCA) to evaluate the grouping of individual tablets in terms of thermal profile.
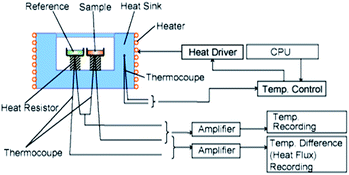 | ||
| Fig. 1 Schematic diagram of a heat flux differential scanning calorimeter (DSC). Courtesy of http://Hitachi-Hightec.com. | ||
2 Materials and methods
2.1 Materials
Confiscated tablets containing ‘diazepam’ were kindly donated by Police Scotland (Cases A to P). Licit diazepam tablets (28 × 10 mg) were supplied by Actavis (Barnstaple, UK) and Teva (Runcorn, UK) and are coded as ‘Com 1’ and ‘Com 2’ respectively. Diazepam, temazepam, oxazepam, nitrazepam, clonazepam and phenazepam were supplied by Sigma-Aldrich (Gillingham, UK). Tablet excipients including Maize Starch B.P. (Thornton & Ross, Huddersfield, UK), calcium phosphate dihydrate, Emcompress™ (Forum Products, Surrey, UK) and several grades of lactose monohydrate including ‘Lactose B.P.’ (supplier unknown) – Grade 1; Granulac™ 230 (Meggle, Wasserburg, Germany) – Grade 2; Pharmatose™ 80 – Grade 5; Lactopress™SD, 150, 175 and 300 μm (DFE Pharma, Goch, Germany) – Grades 4, 3, 6 and 7 respectively – were all analysed by DSC. Tablet lubricants magnesium stearate and stearic acid, and tablet binder, poloxomer 407, were also supplied by Sigma-Aldrich. Polyvinylpyrollidone, PVP (PVP-K25), another common tablet binder known to be present in commercial products, was also analysed.2.2 Measurement of physical attributes
2.3 Visual analysis and drug content
A randomly selected tablet from each batch was crushed in a mortar and pestle and approximately 20 mg was accurately weighed and transferred to a volumetric flask (10 mL) and acetonitrile (2 mL) added followed by 0.1 M HCl to 10 mL giving a final concentration of 2.0 mg mL−1. Samples for analysis were filtered (1 mL Plastipak syringe and disposable 0.45 μm Whatman syringe fliter) prior to injection (20 μL). A mobile phase gradient of 75![[thin space (1/6-em)]](https://www.rsc.org/images/entities/char_2009.gif) :
:![[thin space (1/6-em)]](https://www.rsc.org/images/entities/char_2009.gif) 25 (Eluent A
25 (Eluent A![[thin space (1/6-em)]](https://www.rsc.org/images/entities/char_2009.gif) :
:![[thin space (1/6-em)]](https://www.rsc.org/images/entities/char_2009.gif) Eluent B) was changed to 45
Eluent B) was changed to 45![[thin space (1/6-em)]](https://www.rsc.org/images/entities/char_2009.gif) :
:![[thin space (1/6-em)]](https://www.rsc.org/images/entities/char_2009.gif) 55 over 31 minutes, held for 4 minutes and returned to 75
55 over 31 minutes, held for 4 minutes and returned to 75![[thin space (1/6-em)]](https://www.rsc.org/images/entities/char_2009.gif) :
:![[thin space (1/6-em)]](https://www.rsc.org/images/entities/char_2009.gif) 25 at 35 minutes. Peak integration was undertaken using LC solutions software. Values quoted in Table 1 are the mean of 3 measurements from each case.
25 at 35 minutes. Peak integration was undertaken using LC solutions software. Values quoted in Table 1 are the mean of 3 measurements from each case.
| Case code | Markings | Excipients detected | Diazepam content (mg per tablet) |
|---|---|---|---|
| Com 1 | “C/DC” | Lactose, stearic acid | 8.79 |
| Com 2 | “10” | Lactose | 8.48 |
| A | No markings | Stearic acid, ![[n with combining low line]](https://www.rsc.org/images/entities/char_006e_0332.gif) ![[o with combining low line]](https://www.rsc.org/images/entities/char_006f_0332.gif) lactose lactose |
7.32 |
| B | “MA/D10” |
Emcompress, ![[n with combining low line]](https://www.rsc.org/images/entities/char_006e_0332.gif) ![[o with combining low line]](https://www.rsc.org/images/entities/char_006f_0332.gif) lactose lactose |
0 (Phenazepam) |
| C | “MA/D10” | Stearic acid, ![[n with combining low line]](https://www.rsc.org/images/entities/char_006e_0332.gif) ![[o with combining low line]](https://www.rsc.org/images/entities/char_006f_0332.gif) lactose lactose |
7.15 |
| D | “COX/DC” | Lactose (amorphous) | 23.24 |
| E | “MA/D10” |
Emcompress, ![[n with combining low line]](https://www.rsc.org/images/entities/char_006e_0332.gif) ![[o with combining low line]](https://www.rsc.org/images/entities/char_006f_0332.gif) lactose lactose |
0 (Phenazepam) |
| F | “MSJ” (small tablet) | Lactose | 7.58 |
| G | “MA/D10” | Stearic acid, ![[n with combining low line]](https://www.rsc.org/images/entities/char_006e_0332.gif) ![[o with combining low line]](https://www.rsc.org/images/entities/char_006f_0332.gif) lactose lactose |
6.61 |
| H | “COX/DC” | Lactose (amorphous) | 23.38 |
| I | “COX/DC” | Lactose (amorphous) | 23.11 |
| J | “MA/D10” | Lactose (amorphous) | 0 (Etizolam) |
| K | “MA/D10” | Lactose (amorphous) | 0 (Etizolam) |
| L | “10” |
Emcompress, ![[n with combining low line]](https://www.rsc.org/images/entities/char_006e_0332.gif) ![[o with combining low line]](https://www.rsc.org/images/entities/char_006f_0332.gif) lactose lactose |
0 (Phenazepam) |
| M | “MA/D10” | Lactose (amorphous) | 9.52 |
| N | “Tensium” | Lactose | 9.37 |
| O | “MA/D10” | Lactose (amorphous) | 9.73 |
| P | “10” |
Emcompress, ![[n with combining low line]](https://www.rsc.org/images/entities/char_006e_0332.gif) ![[o with combining low line]](https://www.rsc.org/images/entities/char_006f_0332.gif) lactose lactose |
0 (Phenazepam) |
2.4 Thermoanalytical analysis by differential scanning calorimetry
In addition to normal processing of DSC data using TA universal analysis software (version 4.3), principal component analysis (PCA) was performed on the raw heat flow data from 25–213 °C using Unscrambler® X (Camo Software AS, Oslo, Norway). The rationale for this was to further objectify the DSC data with a view to producing statistical matches of disparate tablets.
3 Results and discussion
3.1 Physical attributes
With the exception of Case F, much smaller in diameter (5.55 ± 0.01 mm) than all the other cases which ranged from 8.03 (A and N)–8.15 mm (G), only Cases C/G and A/N could be confidently distinguished from the rest based on mean diameter and standard deviation. Most notable from consideration of mean tablet weights was the relatively small standard deviations obtained for the two licit cases, Com 1 and Com 2 (0.0014–0.0017 g). These values should be compared with Cases E and I (0.0133–0.0138 g) respectively which showed the highest deviations in weight. All other cases had relatively narrow deviations from the individual mean tablet weights (0.0016–0.0084 g). For the purposes of comparison of all batches, mean weight was of limited value. Of much more value was comparison of tablet hardness. Clear and significant differences were apparent between Cases B/C/E/G, which were softer (17–23 N) than all the others, the hardest tablets being J/K/L/P (80–89 N).Measurement of tablet thickness indicated highly variable results ranging from 2.4367 ± 0.0635 mm (F) to 3.5200 ± 0.0872 mm (A). The narrowest standard deviations from the mean (<0.03 mm) were obtained for Cases C/L/M/O/P, Com 1 and Com 2. Based on these physical attributes alone, Cases B/C/E/G and J/K/L/P were grouped with low confidence.
3.2 Visual analysis
Tablet markings indicated that Cases B/C/E/G (“MA/D10”), J/K (“MA/D10”) and L/P (“10”) may be grouped based on logo alone but there remained discrepancies between the absolute font type and character spacing (see Cases E and G – spacing of the numbers “1” and “0” and Cases K and L – different logos), Table 1 and Fig. 2. Based on visual observation of colour alone, only Cases J/K, L/P and M/O showed any resemblance, however, too much variability between colour, hue and distribution of dye substance rendered subjective assessment of little use.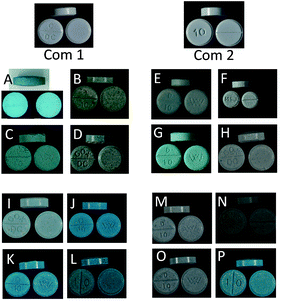 | ||
| Fig. 2 Photographic images of licit (Com 1 and Com 2) and illicit ‘diazepam’ tablets. Individual Cases A to P are included. | ||
3.3 Drug type and content
Definitive identification of the specific drug and its content in individual tablets was of primary importance for forensic identification. HPLC identified two distinctly different benzodiazepines (diazepam and phenazepam) and the thienotriazolodiazepine, etizolam in particular cases (Table 1). This enabled Cases B/E/L/P to be related based on phenazepam content although the precise quantity per tablet was not determined at this stage in these studies. Identification of etizolam in Cases J and K (quantities unknown) suggested a connection supported by testing of physical attributes, markings and colour (Fig. 2). All other tablets tested contained varying levels of diazepam from 6.61 mg per tablet for Case G to 23.38 mg per tablet for Case H (Table 1). Based on the recognised doses of 2, 5 and 10 mg per tablet, diazepam content of the licit batches (Com 1 and Com 2) were actually less than the expected 10 mg per tablet. The British Pharmacopoeia12 specifies that for uniformity of (drug) content, not more than one tablet should deviate from 85–115% of the average content of 10 tablets. Clearly, Com 2 is on the lower limit of this specification but would have passed the manufacturer's quality system. This is also true of Cases M, N and O which contain 9.52, 9.37 and 9.73 mg per tablet diazepam respectively. In contrast, Cases A, C, D, F, G, H and I would fail the pharmacopoeial test by a considerable amount. Most worryingly are the dangerously high levels of diazepam in Cases D, H and I of 23.24, 23.38 and 23.11 mg per tablet respectively. It may be safe to assume that based on diazepam content alone, only Cases M, N and O could be construed as licitly produced.3.4 Differential scanning calorimetry
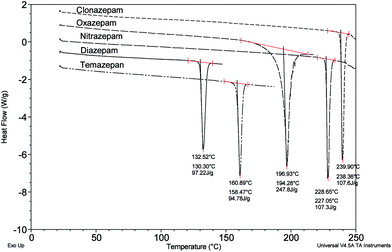
Clearly, there are significant discrepancies in the values of melting point determined in these studies by DSC for temazepam, diazepam and oxazepam compared to the quoted literature values. It should be noted that the quoted values take no account of polymorph or pseudopolymorph (solvate) formation and refer to crystals from specific solvents with melting points determined using traditional laboratory melting point apparatus. The three benzodiazepines showing discrepancies in this study, like most drug substances, are known to exhibit polymorphism.14 Using DSC, melting for diazepam has been recorded at 132.8 °C,15 132 °C16 and 132.3 °C (unspecified forms);17 118 °C (Form V), 120 °C (Form III), 136 °C (Form I-solvate), 134 °C (Form VI-hydrate) and 157 °C (Form VII-solvate).18 A metastable form of temazepam has been recorded at 159 °C14 that can be compared with the widely quoted value of 119–121 °C for ‘crystals from cyclohexane’.13 The melting of oxazepam (Form IV)19 is recorded at 195 °C but known to coincide with decomposition rendering the value for the enthalpy of the melt transition quoted in Fig. 3 indeterminate. Although unable to give unambiguous indication of the specific polymorphic form of a substance as a stand alone technique in the absence of definitive X-ray crystallographic data, for the purposes of this study, DSC is able to quickly distinguish between the different types of benzodiazepine that may be present in an unknown tablet sample. In these studies, 66% of the tablets tested showed evidence of a sharp melt transition around 130 °C indicative of diazepam, supported by the results of HPLC analysis summarised in the previous section.
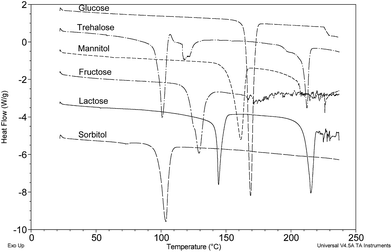
Several different pharmaceutical grades of lactose (numbered 1–7-see Section 2.1) were analysed by DSC (Fig. 5) and some minor variation in the peak temperature of 144–150 °C for dehydration of α-lactose monohydrate and observable differences in the peak width were apparent. Grades 4, 6 and 7 showed some evidence of amorphous content (∼167 °C) that was much less notable in the other grades tested. As an aside, Grade 3 indicated the probable melting of β-anhydrous lactose at 227 °C.
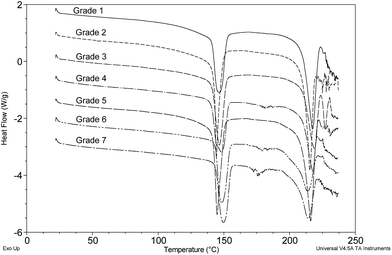 | ||
| Fig. 5 Grade 1-Lactose B.P. (supplier unknown); Grade 2-Granulac™230; Grade 3-Lactopress™150; Grade 4-Lactopress™SD; Grade 5-Pharmatose™80; Grade 6-Lactopress™175; Grade 7-Lactopress™300. | ||
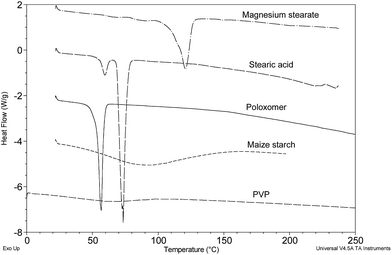
Other common tablet excipients tested included the binders maize starch, PVP and poloxamer 407, and the lubricants magnesium stearate and stearic acid (known to be present in Com 1). A variety of thermal behaviours were apparent for these four excipients and are shown in Fig. 6.
Briefly, magnesium stearate indicated a broad melting range of 110–125 °C typical of commercial samples;21 stearic acid displayed a well-defined endotherm with an onset of 68.6 °C and a weaker endotherm with onset 55.71 °C, the latter event being attributed to <10% (w/w) palmitic acid content which appears to be common;12 poloxomer 407 (a synthetic co-polyether) displayed a sharp melt at 53.3 °C and maize starch produced a very broad displacement of the base line between 20 and 160 °C known to be associated with the desorption of water as a function of increasing temperature during measurement. PVP displayed a largely non-descript thermogram showing a small drift in the baseline (heat capacity) most probably associated with desorption of water as for maize starch. No other thermal events were detected to 200 °C.
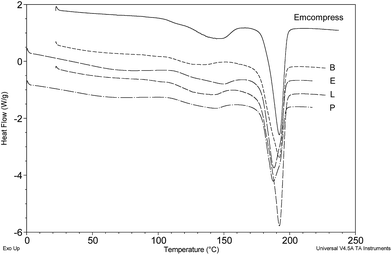
Cases A, C and G showed no sign of lactose content, giving a fairly broad and (as yet) uncharacterised endothermic event from 115–150 °C that included a clear signature peak for diazepam (Fig. 8). Cases B, E, L and P similarly showed no evidence for lactose but were clearly composed of the alternative tablet filler/diluent known as ‘Emcompress’, a trade name for calcium hydrogen phosphate dihydrate.21 HPLC indicated that these particular tablets contained the unlicensed phenazepam (results not shown) a potent benzodiazepine that has only recently been classified in the UK and is known to be around five-times more potent than diazepam.22,23 Two polymorphic forms of phenazepam have recently been reported with melting points of 207–212 °C (β-form) and 226–227 °C.24 No evidence of either of these transitions was apparent in the DSC results presented (Fig. 9). Possible reasons could be attributed to the proximity of the main Emcompress dehydration event causing major perturbations within the sample pan and a resultant loss of a distinct signal for the drug, or the drug content being too low for detection. A combination of these factors may also be involved.
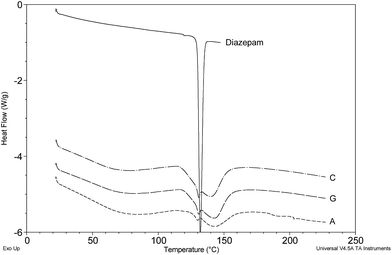 | ||
| Fig. 8 DSC thermograms of Cases A, C and G containing diazepam and an (as yet) unidentified excipient. | ||
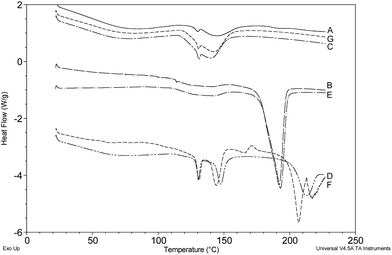
It was concluded that DSC is a fast and effective method of tablet analysis able to reveal both crude and subtle differences between disparate batches of tablets. This capability is illustrated in Fig. 10 where seven separate cases can be quickly grouped into three distinct sets based on the bulk excipients i.e. A/C/G (unknown excipient), B/E (Emcompress) and D/F (lactose). Comparison of Cases D and F indicates significant differences in the lactose ‘signature’ that suggest tablets of different origin and this is supported by the appearance of distinctly different tablet logos and markings (Fig. 2).
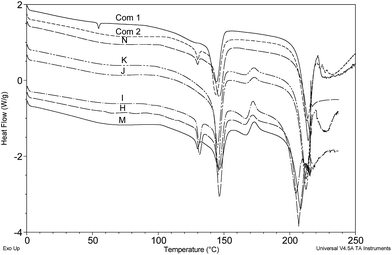
Finally, the bulk of the cases containing lactose as the main excipient were closely grouped by PCA as might be expected and discrepancies relating to the relative magnitude of diazepam content (height of the diazepam melt transition relative to the dehydration of lactose) and the conspicuous signature associated with the presence of amorphous lactose, were distinguishing features readily revealed by DSC that aided further correlation of different cases.
4 Conclusions
DSC is a fast and effective method for generating the thermal profile of unclassified tablets that can be used in conjunction with other characterisation methods to definitively highlight any similarities between individual batches of tablets. This ability makes it invaluable as a method for the forensic identification of tablets.Acknowledgements
The authors would like to thank Police Scotland for supplying the diazepam tablets and Mr Iain Tough (Forensic Laboratory, RGU) for expert advice in forensic imaging.References
- Medical Healthcare Regulatory Agency. 2013, Man sentenced to 44 months imprisonment after £1.6 million worth of unlicensed and Class C medicines seized by MHRA.
- Drug-related deaths in Scotland in 2013, Report by the National Records of Scotland, August 2014.
- World Drug Report 2013, United Nation Office of Drugs and Crime, United Nations, June 2013.
- C. E. Ashton, Benzodiazepine abuse. Drugs and dependence, Harwood, London, 2002 Search PubMed.
- J. D. Jones, S. Mogali and S. D. Comer, Drug Alcohol Depend., 2012, 125, 8–18 CrossRef CAS PubMed.
- Drug-related deaths in Scotland in 2012, Report by the National Records of Scotland, August 2013.
- British National Formulary, Pharmaceutical Press, 2014, 66, p. 225 Search PubMed.
- M. Macdougall-Heasman, I. J. Stewart, D. H. Bremner, A. Tough and K. Simpson, Poster presented at Home Office Science and Engineering Conference on ‘Tackling Drug and Alcohol Abuse’, London, 16th September 2014 Search PubMed.
- P. Mura, A. Manderioli, G. Bramanti, S. Furlanetto and S. Pinzauti, Int. J. Pharm., 1995, 119, 71–79 CrossRef CAS.
- L. Muggetti, M. Zurlo, A. Martini, P. Civaroli and R. de Ponti, Int. J. Pharm., 1996, 136, 81–88 CrossRef CAS.
- G. van den Mooter, P. Augustijins, N. Blaton and R. Kinget, Int. J. Pharm., 1998, 164, 67–80 CrossRef CAS.
- A. Gombás, P. Szabó-Révész, M. Kata, G. Regdon Jr and I. Erõs, J. Therm. Anal. Calorim., 2002, 68, 503–510 CrossRef.
- Merck Index, An encyclopedia of chemicals, drugs and biologicals, ed. S. Budvari, Merck & Co., Inc., New Jersey, U.S.A, 13th edn, 2001 Search PubMed.
- D. Giron, Thermochim. Acta, 1995, 248, 1–59 CrossRef CAS.
- D. Tita, A. Fulius, B. Tita, G. Vlase, B. Vlase and N. Doca, Rev. Roum. Chim., 2010, 55, 1047–1052 CAS.
- D. R. Lide, Handbook of Chemistry and Physics, CRC Press, 88th edn, 2007, pp. 3–516 Search PubMed.
- O. Chitvanich, B. Sirithunyalug, S. Okonogi, S. Piyamongkol and J. Sirithunyalug, J. Nat. Sci., 2009, 8, 175–188 Search PubMed.
- J. R. Rao, K. N. Rao, S. R. Krishna, G. A. Rani, J. Madhavi, R. C. Kanaiyalal, N. L. Rao and D. Debashish, International Pat., WO 201004692920, 2010.
- J. Masse, O. Hourri, P. Bernier and M. Ribet, Thermochim. Acta, 1993, 216, 191–212 CrossRef.
- G. Alderborn, Tablets and compaction, in Aulton’s Pharmaceutics – the design and manufacture of medicines, ed. M. E. Aulton and M.G. Taylor, Churchill-Livingstone, 4th edn, 2013, ch. 30, p. 514 Search PubMed.
- H. A. Kibbe, Handbook of Pharmaceutical Excipients, Pharmaceutical Press, 3rd edn, London, 2010 Search PubMed.
- L. Iverson, Letter to the Minister of State for Crime Prevention and ASB Reduction, Advisory Council on the Misuse of Drugs (ACMD), UK Government, 2011.
- UK Government, Explanatory memorandum to the Misuse of Drugs Act 1971 (Amendment) Order 2012, no. 1390, National Archives.
- Y. N. Morozov, A. Y. Utekhina, V. P. Shabatin, V. V. Chernyshev and G. B. Sergeev, Russ. J. Gen. Chem., 2014, 84, 1010–1017 CrossRef CAS.
| This journal is © The Royal Society of Chemistry 2015 |

