
Evaluation of Analytical Instrumentation. Part XXVI: Instrumentation for Voltammetry
C. B.
Braungardt
*
School of Geography, Earth and Environmental Sciences, Plymouth University, Plymouth PL4 8AA, UK. E-mail: charlotte.braungardt@plymouth.ac.uk
First published on 29th January 2015
Abstract
The Analytical Methods Committee has received and approved the following report from the Instrumental Criteria Sub-Committee.
Introduction
This report was prepared for the Analytical Methods Committee (AMC) by the author with contributions and critical review from other members of the Instrumental Criteria Sub-Committee: S. Greenfield (Chair), S. Gaisford, S. J. Hill, K. E. Jarvis, G. Lord, M. Sargent (Vice Chair), P. J. Potts and M. West.All users of analytical equipment should be familiar with the basic principles of its operation, the main areas of application, key features and aspects of day-to-day use. The aim of this report is to provide a general overview of the technique followed by an objective evaluation of the instrumentation and its capabilities in tabular form. The table of selection criteria is a unique aspect of this series of reports, providing a checklist of features to be considered in purchasing and using complex analytical instrumentation. Most features relate to the instrumentation itself but more general factors such as installation in the laboratory, service requirements and manufacturer support are also considered. A brief description is provided for each feature together with an explanation of its importance and, if appropriate, guidance on how it may be assessed.
Other reports
The Analytical Methods Committee has published the following reports in the series:Part I. Atomic absorption spectrophotometers, primarily for use with Flames, Anal. Proc., 1984, 21, 45. Revised in Analyst, 1998, 123, 1407.
Part II. Atomic absorption spectrophotometers, primarily for use with Electrothermal Atomizers, Anal. Proc., 1985, 22, 128. Revised in Analyst, 1998, 123, 1415.
Part III. Polychromators for use in Emission Spectrometry with ICP Sources, Anal. Proc., 1986, 23, 109.
Part IV. Monochromators for use in Emission Spectrometry with ICP Sources, Anal. Proc., 1987, 24, 3.
Part V. Inductively Coupled Plasma Sources for use in Emission Spectrometry, Anal. Proc., 1987, 24, 266.
Part VI. Wavelength Dispersive X-ray Spectrometers, Anal. Proc., 1990, 27, 324.
Part VII. Simultaneous Wavelength Dispersive X-ray Spectrometers, Anal. Proc., 1991, 28, 312.
Part VIII. Instrumentation for Gas-Liquid Chromatography, Anal. Proc. 1993, 30, 296.
Part IX. Instrumentation for High-performance Liquid Chromatography. Analyst, 1997, 122, 387.
Part X. Instrumentation for Inductively Coupled Plasma Mass Spectrometry, Analyst, 1997, 122, 393.
Part XI. Instrumentation for Molecular Fluorescence Spectrometry, Analyst, 1998, 123, 1649.
Part XII. Instrumentation for Capillary Electrophoresis, Analyst, 2000, 125, 361.
Part XIII. Instrumentation for UV-VIS-NIR Spectrometry, Analyst, 2000, 125, 367.
Part XIV. Instrumentation for Fourier Transform Infrared Spectrometry, Analyst, 2000, 125, 375.
Part XV. Instrumentation for Gas Chromatography-Ion-Trap Mass Spectrometry, Analyst, 2001, 126, 953.
Part XVI. Evaluation of General User NMR Spectrometers, Accred. Qual. Assur., 2006, 11, 130–137.
Part XVII. Instrumentation for Inductively Coupled Plasma Atomic Emission Spectrometers, Accred. Qual. Assur., 2005, 10, 155–159.
Part XVIII. Differential Scanning Calorimetry, Accred. Qual. Assur., 2005, 10, 160–163.
Part XIX. CHNS Elemental Analysers, Accred. Qual. Assur., 2006, 11, 569–576.
Part XX. Instrumentation for Energy Dispersive X-ray Fluorescence Spectrometry, Accred. Qual. Assur. 2006, 11, 610–624.
Part XXI. NIR Instrumentation for Process Control, Accred. Qual. Assur., 2006, 11, 236–237.
Part XXII. Instrumentation for Liquid Chromatography/Mass Spectrometry, Accred. Qual. Assur., 2007, 12, 3–11.
Part XXIII. Portable XRF Instrumentation, Accred. Qual. Assur., 2008, 13, 453–464.
Part XXIV. Instrumentation for Quadrupole ICP-MS. Anal. Methods, 2010, 2, 1206–1221.
Part XXV. Differential Scanning Calorimetry, in press.
An overview of voltammetry
Introduction
The basic principle of electroanalytical chemistry is the direct conversion of chemical information into an electrical signal, typically the result of processes occurring within an electrochemical cell in which the analyte is dissolved in an electrolyte solution.1 The much wider field of electrochemistry began with a galvanic cell created from zinc and copper wires and frogs' legs by Luigi Galvani in the 1780s, followed by Allessandro Volta's precursor to the battery in the late 1790s.2 By the early 20th century, the basic theory and practical applications of electrolysis, electrode potential, polarisation/decomposition voltage and different electrode systems had been elucidated by an international group of scientists, including C. F. Varley, G. Lippman, B. Kucera, H. Davy, M. Faraday, H. Helmoltz, W. Nernst and M. Le Blanc. In 1922, Jaroslav Heyrovsky constructed the first polarograph at Prague University. The original apparatus measured current–voltage curves resulting from the electrolysis of oxygen at a dropping mercury electrode. Over the following decades, polarography was developed for chemical analysis of electroactive species, eventually leading to the invention of voltammetry with the advent of the hanging mercury drop electrode in the 1950s.2In voltammetry, the transfer of an electron between an oxidised and reduced species within an electrochemical cell occurs at a potential specific for each analyte at the electrode/solution interface. The measured signal is the oxidation or reduction current as a function of a variable (ramped) potential that is applied to the electrochemical cell. Signals in the form of a response curve at specific potentials are quantified by area or height and converted to analyte concentrations by application of a previously determined calibration equation or through standard addition.
Since the 1960s, modifications to classic voltammetric techniques and advances in electronic signal amplification promoted the development of sensitive and selective methods for the determination of trace metals in solution at picomolar concentrations as well as the detection of electroactive organic compounds.
The main advantages of voltammetric techniques include:
• Determination of the analyte in high ionic strength media without matrix removal.
• Excellent limit of detection that is adjustable (from pmol L−1 to nmol L−1 range) by changing deposition (pre-concentration) time (from minutes to seconds).
• Linear range approximately 1.3 orders of magnitude.
• On-line or in situ application for near-real time determination of analytes in the field.
• Direct determination of operationally defined groups of dissolved metal species, without prior sample treatment (except filtration for most applications).
• Moderate cost.
• Continuing development of new electrode systems and analytical methods that broaden the range of inorganic and organic analytes and applications.
Disadvantages include:
• Limited capability for multi-elemental analysis.
• Time-consuming analysis.
• Inter-element interferences.
• Matrix interferences (e.g. organic compounds) that may require sample pre-treatment.
• The reliance in many applications on mercury which may be banned under future environmental legislation in some countries.
There is a wide range of instruments of varying complexity on the market. Some packages offer an almost ‘black box’ approach to instrumentation and reagents, suitable for routine analysis following standard operating procedures. Simple configuration of separate components may be favoured for teaching and certain R&D applications, while flexible, modular and, in some cases, multi-channel instruments provide full access to analytical parameters, enable different electrode systems to be used and therefore allow method development and specialised research applications. A wide range of electrode systems and a multitude of accessories for sample treatment are available. This report covers criteria important to the selection of bench-top systems. Instrumentation for stand-alone or in situ deployment is not specifically considered here, although many of the discussed criteria will apply.
Key instrument components
The principal components of a voltammetric analyser are (Fig. 1):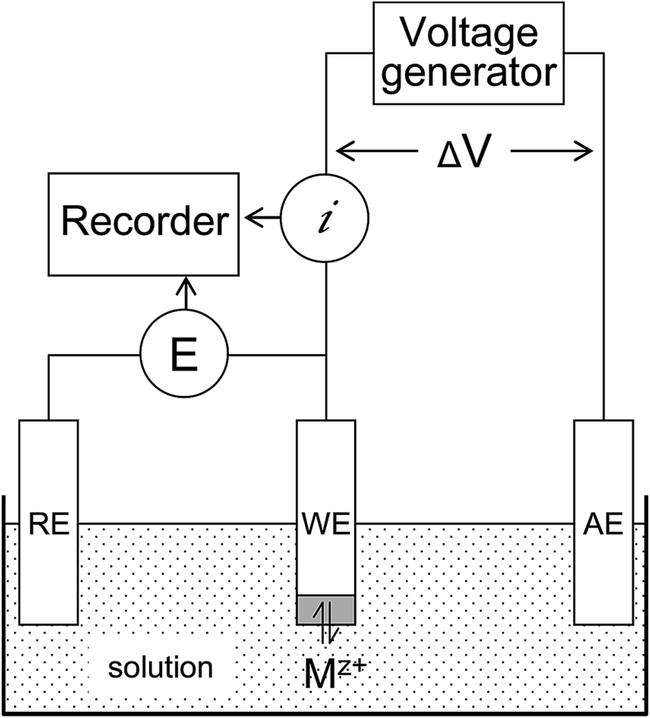 | ||
| Fig. 1 Schematic representation of a basic voltammetric system comprising of three electrodes (WE: working, RE: reference, AE: auxiliary) immersed in electrolyte solution. Mz+ represents a cationic species of charge z in solution interacting with the electrode surface. For further explanations, see text. | ||
• Three-electrode cell.
• Voltage generator (potentiostat).
• Voltmeter.
• Current meter.
• Data recorder.
The working, reference and auxiliary electrodes are immersed in the sample solution containing a supporting electrolyte and the analyte, which in Fig. 1 is shown as Mz+ and represents a metal or electroactive compound of the positive charge z. The potentiostat controls the potential of the working electrode during the two phases of the analytical cycle: (1) the deposition of Mz+ at the working electrode (pre-concentration step) and (2) the potential scan during which the electron flow resulting from oxidation or reduction of the analyte is measured as current i. The reference electrode provides a constant reference potential that remains uncompromised because the current flow in the cell is conducted through the auxiliary electrode and the potential at the auxiliary electrode balances the oxidation or reduction reaction that occurs at the working electrode. The current signal (i) is recorded as a function of the potential (E) and has the form of a current peak resulting from the oxidation or reduction of an analyte at a specific potential.
Most instruments are controlled via computers with bespoke software, which also allows the selection of analytical parameters and the storage, treatment and display of data. Alternatively, some integrated instruments feature a display and keypad, through which analytical and output parameters are controlled.
Accessories may include:
• Integrated sample stirrer.
• Integrated sample de-oxygenation facility.
• Automated facilities (e.g. for change of sample, reagent and/or standard additions).
• Sample pre-treatment apparatus (e.g. filtration, oxidation of organic matter).
• Silver (solid state).
• Gold (solid state).
• Platinum (solid state).
• Palladium (solid state).
• Mercury drop.
• Glassy carbon (solid state).
• Mercury film on glassy carbon or iridium.
• Bismuth film on glassy carbon.
• Pyrolytic graphite (solid state).
• Carbon paste or carbon nanoparticle paste.
• Boron doped diamond (solid state).
The configurations of the solid state electrodes include static or rotating rods, shaking or rotating disk and ring electrodes, single micro-electrodes and micro-arrays.
While the determined quantity is the current (i) that crosses the electrode/solution interface, it is the current density (current per unit electrode surface area in A cm−2) that is directly proportional to the concentration of the analyte in solution. Voltammetric signals depend on the dimensions of the working electrode, which must therefore be constant. The disadvantage of solid state electrodes is their vulnerability to fouling, scratches and other surface imperfections, which alter the effective surface area. Resolutions to this problem include semi-permeable membranes that prevent the migration of potentially interfering compounds to the electrode surface3,4 and mercury electrodes, which are either films plated onto a solid electrode substrate or the hanging mercury drop electrode, which provides a fresh Hg drop for each measurement.
The use of mercury has been restricted in the EU and in future may be banned in some countries. Although alternative working electrode materials are available (e.g. bismuth film5), mercury remains the working electrode material of choice for many applications. Mercury electrodes can span a wide range of potentials and therefore have a wide analytical detection window, which is ideally suited for the measurements of dissolved oxygen, various sulfur species, some organic compounds, as well as Fe2+, Mn2+ and a wide range of trace metals at environmental concentrations. For example, anodic stripping voltammetry (ASV) allows the direct determination of Cd, Cu, Pb and Zn in natural waters and other media, while any metal that forms an electrochemically reactive complex with an added ligand can be determined using adsorptive cathodic stripping voltammetry (AdCSV, e.g. Co, Cr, Cu, Ni, Pb, U, V, Zn).6
The most commonly used mercury electrodes for voltammetric trace metal determinations in natural waters are the hanging mercury drop electrode (HMDE) and the mercury film electrode (MFE). The HMDE comprises a mercury reservoir feeding a capillary, at the mouth of which a drop of reproducible size is formed by some means of expressing the mercury (e.g. a valve and knocker or pressurised gas). Different types of mercury drop electrode include the static mercury drop, dropping mercury and controlled growth mercury electrodes. The MFE is formed by deposition or plating of elemental Hg onto the substrate surface of the working electrode (e.g. iridium, gold, semi-conductors) from a Hg(II) salt in solution. The high surface area to volume ratio of MFEs affords excellent sensitivity due to the high analyte enrichment factor during the pre-concentration step7 and the employment of MFE in micro-electrodes (size <10 μm) allows trace metal determination at picomolar levels.8,9
Research-driven developments in electrode technology over the past three decades include chemically modified electrodes for the determination of organic compounds as well as metals. Examples include gold-nanoparticle, carbon paste and carbon nanotube paste electrodes modified with surfactants or ligands.10–12 The interest in such specialised electrodes within the scope of this report lies solely in whether or not the instrument set-up allows for less common electrodes to be used and developed.
Any working electrode is vulnerable to material being adsorbed on its surface, which may result in a degradation of the current response. In such a case, the electrode surface will have to be renewed (e.g. MFE) or cleaned. In the case of solid state electrodes, cleaning typically involves polishing with a fine-grained material or electrochemical treatment. When selecting electrode systems suitable for the intended application, such maintenance should be considered with respect to cost (time) and reproducibility.
Key principles of voltammetry
Central to understanding voltammetry are the interactions of the analyte with the working electrode, as summarised in Fig. 2 for the detection of a metal Mz+ using AdCSV in an electrochemical cell. | ||
| Fig. 2 Principal reactions of a metal–ligand complex at a mercury electrode. | ||
These interactions include:
• The complex formation between dissolved analyte Mz+ and the solution ligand L and its dissociation is in thermodynamic equilibrium.
• Diffusion controls the transport of the analyte, solution ligand and their complex ML near the electrode surface.
• Diffusion limits the flux of the analyte, solution ligand and the metal ligand (ML) complex at the electrode.
• The dissociation of the analyte–ligand complex near or at the electrode surface is also rate-limiting.
• The solution ligand or the analyte–ligand complex may be adsorbed at the electrode surface and can cause interferences.
• Redox reactions of the analyte (Mz+/M0 couple) can be described by the standard redox potential (E0) and rate constant (k0) for the reaction.
• The charge transfer resulting from the redox reaction is very rapid relative to the flux of compounds at the electrode and is fully reversible (so-called Nernstian behaviour14).
Chemical equilibria are controlled by the chemical potentials of the reactants and products. However, the electrochemical equilibrium is determined by the balance between chemical energies (chemical potentials) and electrical energy. This occurs because an electron is transferred between the solution and the electrode, the potentials of which may differ from each other.13 Both, chemical and electrical energies are accounted for in the Nernst equation, which applies under conditions of constant temperature and pressure:
Φm − Φs = Δμ0/F + RT/F![[thin space (1/6-em)]](https://www.rsc.org/images/entities/char_2009.gif) ln([reactants]/[products]) ln([reactants]/[products]) | (1) |
Φ m and Φs are the electrical potentials of the metal (working) electrode and the solution, respectively, Δμ0 is the difference in chemical potentials between reactants and products, F is the Faraday constant (96485.3 C mol−1), R is the gas constant (8.31447 J K−1 mol−1) and T is the temperature (in K).
A second (reference) electrode is inserted into the electrochemical cell because the measurement of the potential drop Φm − Φs requires an electrical circuit, through which a very small current passes. This allows electrode potential changes to be measured at the working electrode. By measuring the standard electrode potentials of redox couples relative to a standard hydrogen electrode under standard conditions, the Nernst equation can be re-written:
| E = E0f + RT/Fln([A]/[B]) | (2) |
Standard electrode potentials for aqueous solutions can be found in the literature (e.g. Compton and Banks13 and references therein) and provide approximate values for formal potentials, which take into account solution-specific conditions. E0f is the formal standard electrode potential of the half reaction A + e− ⇌ B occurring at the working electrode surface, which depends on temperature, pressure and electrolyte concentrations. In order to avoid non-negligible current resulting from the electrode transfer (redox) process through the reference electrode, a third (auxiliary) electrode completes the electrochemical cell. The auxiliary electrode conducts the same current that flows through the working electrode and its potential is controlled to a voltage value that facilitates this.
Factors affecting kinetic processes that take place at the electrode surface include:
• Close (1–2 nm) proximity of reactants to the electrode surface so that electrode transfer during redox reactions (a quantum mechanical process) can take place.
• Diffusion of the reactant from the bulk solution controls the flux of reactant at the electrode.
• The redox reaction decreases the concentration of reactant at the electrode surface in comparison to that in the (well mixed) bulk solution, creating a concentration gradient within the diffusion layer surrounding the electrode (Fig. 2).
• The molecular geometry of reactants and the rate constants for electrochemical reactions, which are dependent on the potential applied.
The reversibility (or otherwise) of electrode processes deserves consideration and is related to the voltage scan rate during the ramping of the potential. The shorter the time taken to scan the potential from the initial to the final value, the thinner the diffusion layer and, following Fick’s 1st law, the greater the fluxes of reagents from the bulk solution to the electrode surface. On the other hand, with a faster the scan rate electrode reactions become less reversible.13 A full treatment of theoretical considerations related to electrochemical cells and the interpretation of voltammetric measurements is beyond the scope (and purpose) of this report and can be found in the literature.13–16
Practical considerations for analysis
Electroanalytical chemistry is a wide field, ranging from the study of electrode processes to the quantification of electroactive species in environmental samples. The following sections focus mainly on one of the most common practical applications of electrochemistry, namely stripping voltammetry for metals in solution. For a comprehensive treatment of modern electroanalytical chemistry and insight into methodologies, sensors, detectors and microchips the reader is referred to Wang.17(a) Square wave and differential pulse voltammetry. Square wave (SW) and differential pulse (DP) wave forms have been developed to improve the ratio of the Faradaic to capacitive currents. In SW and DP, the respective waveform is superimposed on a stepped potential (staircase) and the current is measured at two specific points in each wave or pulse, at which the capacitive current components are of opposite signs. As the current difference between the two is the recorded signal, much of the non-Faradaic contribution is eliminated. Other advantages of these waveforms are the increased speed of analysis, sensitivity and limit of detection (LOD = 10−8 to 10−10 mol L−1), improved peak separation between analytes and reduced interferences caused by surface active compounds in solution.13,16,18
Interference from dissolved oxygen may require de-oxygenation of the sample, for example through a purge with argon or high purity nitrogen gas prior to analysis. To maintain homogeneity of the bulk solution, analyses are usually carried out under conditions of forced convection (e.g. stirring).
(b) Linear sweep voltammetry. In linear sweep voltammetry (LSV), the voltage is ramped linearly at a fixed rate (mV s−1) during the stripping step and the current is determined as a function of time. This method has a relatively low Faradaic/capacitive ratio, resulting in low sensitivity and therefore is mainly used for dissolved oxygen determinations.
(c) Cyclic voltammetry. Cyclic voltammetry (CV) is a variation of LSV, whereby the potential is ramped to its final value and then scanned back to the origin. CV can be employed to investigate the electrochemical properties of chemical species and electrode processes.6,13
To sustain sensitivity during ASV analysis, the sample pH is maintained at a relatively low pH value, either through addition of acid or a buffer (pH 2–4). This allows the simultaneous determination of Cd, Cu, Pb and Zn in one sample aliquot, although the formation of inter-metallic complexes between Zn and Cu under certain conditions may in practice limit the scope for multi-metal analysis.20
The analytical ASV cycle begins with the application of a deposition potential, which is usually more negative (by 0.3–0.4 V) than the oxidation potential of the analyte. During deposition the analyte is reduced to the metallic state and collected into the electrode by amalgamation with the Hg, as described by the forward direction of eqn (3). The deposition time can be adjusted to vary the limit of detection and linear range and serves as a pre-concentration step.
| Mz+(aq) + ze− ⇌ M(electrode) | (3) |
Deposition is followed by the stripping step, whereby the potential ramp starts at a value more negative than the oxidation potential of the analyte(s) and continues towards the final, more positive, potential (anodic scan). This scan induces a Faradaic loss of the accumulated analyte from the electrode and is described by the reverse direction of eqn (3).
| Analyte | pH range | Buffer (optimum pH) | Added ligand |
|---|---|---|---|
| APDC: ammonium pyrrolidine dithiocarbamate; BES: N,N-bis(2-hydroxyethyl)-2-aminoethanesulfonic acid; DMG: dimethylglyoxime; DTPA: diethylenetriamine pentaacetic acid; NN: 1-nitroso-2-napthol; HEPES: N-hydroxyethylpiperazine-N′-2′-ethanesulfonic acid; Nioxime: cyclohexane-1,2-dionedioxime; Oxine: hydroxyquinoline; PIPES: piperazine-N,N-bis-2-ethanesulfonic acid; SA: salicylaldoxime. | |||
| Cd, Cu, Zn, Pb | 7.5–8.5 | HEPES (7.8) | Oxine |
| Cu | 6.0–9.0 | Borate (8.5) | Oxine, tropolone or catechol |
| Cu | 8.0–8.4 | Borate (8.35) | SA |
| Cr | 6.0–6.8 | Acetate (6.2) | DTPA |
| Fe | 6.8–8.0 | HEPES (8.0) or PIPES (6.8) | NN or DMG or catechol |
| Ni | 6.8–7.8 | HEPES (7.8) | Nioxime |
| Ni, Co | 7.0–10 | HEPES (7.8) or borate (8.4) | DMG |
| Ni, Zn | 7.0–8.5 | HEPES (7.8) or BES (7.3) or borate (8.4) | APDC |
| U | 6.5–7.1 | PIPES (6.8) | Oxine |
| V | 6.6–7.2 | PIPES (6.8) | Catechol |
| Zn | 6.2–8.5 | HEPES (7.8) or BES (7.3) or borate (8.4) | APDC |
In AdCSV, the added ligand LA forms a complex with the analyte metal ion (Mz+, eqn (4)) in solution. During deposition, a potential, slightly more positive (by ≥0.1 V) than the reduction potential of the MLA complex, is applied to the cell and a minute fraction of MLA forms a mono-molecular layer on the electrode surface. The potential ramp starts at a value more positive than the reduction potential of the analyte(s) and continues towards the final, more negative, potential (cathodic scan). At a potential specific to the MLA complex, the adsorbed metal is reduced and stripped from the Hg surface. In some cases reduction of a group on LA occurs (eqn (4)).
 | (4) |
These include:
• The length of the pre-concentration step, which can be adjusted for each individual sample to achieve the limit of detection and linear range appropriate to the analyte concentration.
• The deposition potential, which can be adjusted to limit or exclude the deposition of interfering solution ligands or metals.
• Conditioning potentials, which can be used to fine-tune analytical conditions and reduce interference from organic compounds.
• Instrumentation can be deployed in the field, where the temperature in the analytical cell may change over time with ambient conditions.
Illustrative applications
Classic applications of voltammetry to the analysis of metals and metal speciation in natural waters using ASV and AdCSV have been reported by numerous authors. A recent review25 illustrates the diversity of methodologies developed over several decades for just one element, iron.A selection of applications that highlight the utility of voltammetry for metal speciation in natural waters is given below:
• Determination of total dissolved metal concentrations in filtered and oxidised (i.e. organic matter removed) samples21,23,26
• Determination of the (operationally defined) labile dissolved metal fraction in fresh, filtered samples7,8,27
• In situ analysis of the (operationally defined) dynamic metal fraction in seawater20,28
• Determination of metal complexing capacity and complexing strength (logK′) of natural organic ligands in fresh, filtered samples22,29–31
• Determination of the free metal ion concentration.32
The determination of organic compounds with voltammetric techniques is a wide field and full coverage is beyond the scope of this report. However, a brief overview of some applications is given here. The quantitative determination of organic compounds with voltammetric (or polarographic) techniques typically relies on reduction or oxidation of functional groups. Reducible compounds include hydrocarbons with conjugated double and triple bonds, halogens (except fluoro), aldehydes, quinones, peroxides, nitrate esters, nitro- and nitroso-compounds, hydroxylamines, azo- and hydrazo-compounds, pyridines, quinolones, oximes, isocyanates, disulfides, sulfones and organometallic compounds. Among the oxidisable groups are phenols, aromatic amines and amides and groups that react with mercury ions include thiols, carbamates, thioamides and hydrazine derivatives.33
In most cases the redox reaction involves the removal or addition of H+ to the molecule and therefore the analysis is pH dependent and has to be carried out in buffered solutions (e.g. phosphate, borate, acetate). Because of the low solubility of many organic compounds, the analysis is usually carried out in organic solvents, such as high purity alcohols, acetonitrile, tetrahydrofuran, or mixtures thereof with water.34 Interference from non-target compounds within complex matrices may occur and separation of the analyte or the interferants may be necessary using HPLC, solid phase or solvent extraction.
Applications include:
• Quantitative analysis in industrial quality control (dyes, plastics, agricultural products and pharmaceuticals).
• Medical applications (blood, serum, urine).
• Monitoring of waste streams and water quality.
• The determination of equilibrium constants and rate constants.
• Detection of intermediates for organic reactions.
Illustrative examples of applications are detailed by Thomas and Henze33 and Zuman34 who provide a very helpful introduction to polarography and voltammetry for the analysis of pharmaceutical compounds, which is also more generally instructive.
Comparison with other techniques
Voltammetric techniques are capable of the direct determination of metals complexed by groups of ligands, without the need for sample pre-treatment, other than filtration. The analyst defines the groups of metal species that are detected by the technique. In ASV this is achieved through the parameters set for analysis and in AdCSV via the choice and concentration of the added ligand, which in both cases operationally defines the competitive complexation environment in the sample aliquot. This is a unique feature of voltammetry, whereas all other analytical techniques compared in Table 2 would need some form of sample treatment prior to analysis if speciation information is desired.| Technique | LOD | Linear range (order of magnitude) | Multi-elemental | Time per sample (min) | Instrument cost* |
|---|---|---|---|---|---|
| OM: orders of magnitude; ICP: inductively coupled plasma; MS: mass spectrometry; OES: optical emission spectrometry; AAS: atomic absorption spectroscopy. ETA: electrothermal atomisation.a Depends on pre-concentration time and therefore, is flexible.b With micro-arrays, mid-pM.c Depends on element.d Typically analysis of one metal at a time, in some cases 2 or 3 metals simultaneously.e One element at a time.* Please note that the cost depends on instrument configuration, analytical features and accessories. | |||||
| ASV | Low nmol L−1a,b | 1 to 1.5a up to low μM | Zn, Cd, Pb, Cu only | 10–30 | Low |
| AdCSV | Mid-pmol L−1 to nmol L−1a | 1 to 1.5a up to high nM | Wide variety of metalsd | 10–30 | Low |
| ICP-MS (quadrupole) | Mid-nmol L−1c | 8 | Yes | 1–2 | Medium |
| ICP-MS (high resolution) | Low nmol L−1c | 8 | Yes | 1–2 | High |
| ICP-OES | Mid-nmol L−1c | 6 | Yes | 1–2 | Medium |
| Flame-AAS | High nmol L−1c | 1 | Wide variety of metalse | <1 | Low |
| ETA AAS | Low nmol L−1 | 1 | Wide variety of metalse | 5 | Medium |
Selection criteria for voltammetric instrumentation
Table 3 summarises key features of voltammetric instrumentation and includes criteria worth considering when purchasing voltammetric equipment. It also provides some guidance on instrumental requirements for different applications, for example research and development or routine analysis.| Feature | Description of feature and guidance for assessment | Reasoning |
|---|---|---|
| 1 Instrumental criteria | ||
|
||
| (a) General instrument design | ||
| (i) Integrated or compact systems | Compact systems integrate electrochemical cell, potentiostat, data analysis and user interface | Integrated systems offer ease of operation and simplicity at relatively modest cost but also minimal flexibility |
| Look for ease of use, adequate range of standard procedures and sufficient access to analytical parameters for the intended applications | Faults may cause extended downtime compared with modular systems | |
| (ii) Modular systems | The instrument is composed of separate components that are linked by cables | Very important where maximum flexibility of functionality for R&D and multi-channel analysis are required |
| Look for scope for expansion and interface with auxiliary equipment | Provides flexibility and options for expansion as required by changes in applications | |
| Exchange or repair of individual modules reduces downtime | ||
| (iii) Auxiliary component range | Auxiliary components may include sample pre-treatment (e.g. filtration, destruction of organic matter) and automated operation of the electrochemical cell during analysis (sample, reagent and standard addition and cleaning of cell) | Some analytical tasks (e.g. determination of total dissolved metal concentration) require sample pre-treatment to make analyte detectable |
| Look for functionality appropriate to intended applications and whether desired components are offered by voltammeter manufacturer | A degree of automation is advantageous in routine laboratory or high-resolution on-line analysis of samples (e.g. on board ship) | |
| Look for options to interface non-proprietary equipment | Proprietary components can be expensive | |
| (iv) Degree of automation | Instruments, components and software range from fully manual to fully automated operation and data manipulation | The degree of automation determines sample throughput and repeatability in routine and on-line applications |
| Look for degree of automation and flexibility suited to intended applications | R&D may require fully manual operation to ensure expert judgement can be applied to data treatment and quality assurance | |
| (v) Flexibility of setting analytical parameters | Range of analytical parameters that can be set determines breadth of applications | R&D applications require full access to analytical parameters |
| Look for sufficient access to analytical parameters for the intended applications | Restrictions to standard operating procedures allow routine application with minimal training | |
| (vi) Portability and size | Size, weight and footprint of instrument and accessories | Dimensions and weight are critical for transportation and where space is limited, for example on board ship |
| Portability and on line use may be important for applications outside laboratory | ||
| (vii) In situ applications | Some instruments are fully submersible and can be deployed in situ (e.g. in rivers, lakes, the sea) | A Robust and reliable system of pressure compensation between external medium and electrochemical cell and reference electrode during fully submersed applications at depth is crucial |
| Look for maximum depth, required power supply, telemetry options suitable to intended application | ||
| Look for robust electrode systems | ||
| (viii) Accessibility of electrodes | Maintenance and exchange of reference and working electrodes should be user-friendly | Rapid response to faults and unstable signals shortens downtime |
| Look for physical access, ease of replacement; robustness of connections | Poor contact increases signal-to-noise ratio | |
| (ix) Power | Look for flexibility of AC input (US/Europe/Asia); low voltage DC power supply (e.g. battery), as appropriate | Flexibility eases portability of instrument for research to different countries and remote locations |
| (x) Cable management | Modular systems have several power leads and external signal cables | Integrated systems provide in-built shielding and noise suppression, which minimises interference with analytical signals |
| Integrated instruments minimise cable management | ||
| (xi) Environmental considerations | Look for alternatives to mercury electrodes compatible with the chosen instrumentation | Electrode material and mode of operation may involve elements and chemicals (e.g. mercury and its compounds) that are restricted in use in some countries and/or have special requirements for disposal |
| Are there facilities for toxic waste collection in automated systems? | ||
|
||
| (b) Electrochemical cell | ||
| (i) Working electrodes | Capability to use a wide range of working electrodes, supplied by the manufacturer of the instrument or by third parties | Flexibility maximises range of applications and enables new developments to be implemented |
| Does instrument design allow application of electrodes developed in-house? | Some electrode systems require expertise and auxiliary equipment for preparation (e.g. polishing equipment) | |
| Are working electrodes ready-to-use or do they require preparation by user? | ||
| Enquire about longevity and cost of electrodes | ||
| (ii) Reference electrode | Look for reliability and nature of reference electrode system, depending on application | Maximises signal stability and repeatability. Can be judged from literature and experience of users |
| (iii) Counter/auxiliary electrode | Stability and robustness of materials | Minimises downtime and cost |
| (iv) Cell material | Is a range of cell materials available, including glass and PTFE? | Maximises range of applications |
| (v) Cell auxiliaries | Availability of integrated stirrer and/or purge facilities | Simplifies most voltammetric applications |
| (vi) Sample and reagent delivery and removal | Facilities for manual or automated sample, reagent and standard additions should enable reliable, precise and reproducible delivery and thorough removal and rinsing | Ease of access in manual systems reduces analytical time and potential for contamination; |
| Manifolds and tubing in automated systems should avoid dead spaces and be accessible for cleaning | ||
|
||
| (c) Analytical parameters | ||
| (i) Procedures and parameters | Look for the range of available pre-set procedures in manufacturer's software and for the level of accessibility of analytical parameters | Pre-set procedures ease instrument set-up especially for inexperienced operators, in-house definition of standard operating procedures and routine applications |
| R&D applications require possibility to define new procedures | ||
| (ii) Electrical potential range | Look for the potential ranges which are pre-set in the instrument, as appropriate to intended applications | Maximises applications; difficult matrices may require higher potentials than more traditional applications, such as fresh and seawaters |
| (iii) Electrical potential wave forms applied during stripping step | Available range of waveforms pre-set in the instrument (see Section 5.1 in the introductory text), and option to change step potential and amplitude, as appropriate to intended applications | R&D and certain matrices may require full access to parameterisation of waveforms |
|
||
| (d) Instrument control and data analysis | ||
| (i) Data output | Is there a graphical interface that allows access to processed data while analysis is underway? | Instant access to voltammogram is vital to the operator for judging success of analysis by examining baseline, interferences, noise, blank etc. |
| Is the raw data (current response to stripping potential) accessible? | For analysis of difficult matrices and R&D application, raw data access allows data evaluation and treatment informed by expert judgement | |
| (ii) Data analysis facilities | Look for software features, such as automatic peak identification and quantification, background subtraction, smoothing algorithms, calibration curve application | Automation of voltammogram analysis offers rapid assessment, but may curtail flexibility in peak and baseline determination, smoothing functions and quantification |
| Is fully manual peak quantification possible? | ||
| (iii) Data export | Accessibility of raw data and analytical results | File format of exported data should be compatible with software used by users. |
| Look for compatible file formats | Option to export raw data is crucial for non-routine analysis and R&D applications | |
|
||
| 2 Non-instrumental criteria | ||
|
||
| (a) Previous instruments | ||
| (i) Innovation | Manufacturer's record for instruments with innovative features | Demonstrates knowledge and understanding of technique and user requirements |
| (ii) Reliability record | Manufacturer's record for instrument reliability | Reflects good design and quality assurance |
| (iii) Similarity of operation, layout and design to existing instruments in the laboratory | May be important for routine or commercial work; less important for research applications and where innovative features rank higher | Similarity of design and operation allows operators to draw on in-house expertise, reducing reliance on external training; may maximise use of spare parts and accessories |
| (iv) Confidence in supplier | Confidence gained from past personal experience | Benefits from a good working experience |
|
||
| (b) Technical support | ||
| (i) Applications support | Advice available from the manufacturer's application department | Maximises ability of operators to apply instrument to new applications |
| (ii) Technical information | Range and quality of technical information, including detailed technical specifications, operating manual, application notes, trouble shooting and references to R&D literature | Helps operators to design experiments and optimise instrument use and in-house maintenance |
| (iii) Telephone and on-line assistance | Support available by manufacturer or supplier, including software updates and remote diagnostics | Timely availability of assistance reduces need for service call-out; can be judged by reference to existing user experience |
| (iv) Training | Training available during and following instrument set-up and follow up courses for more advanced user | Ensures operators use instrument effectively |
| (vi) User meetings | Meetings, conferences and technical briefings organised for users by the manufacturer or third party | Other users are often the best source of advice for solving problems and developing new applications |
|
||
| (c) Servicing and maintenance | ||
| (i) Service support | Availability of a service contract or support from the manufacturer, supplier or third party | Essential to ensure continued operation of instrument over planned lifetime |
| (ii) Availability, cost and delivery of spares and consumables | Range of stock carried by, or quickly available to, the manufacturer or supplier | Reduces instrument down-time and defines day-to-day operating costs |
| (iii) Call-out time and cost | Proximity, time and cost for an engineer to reach the laboratory | Determines instrument down-time and costs resulting from faults |
| (iv) Effectiveness of service support | Ability of a service agent to identify and repair faults. | Reduces instrument down-time; can be judged by reference to existing user experience |
| (v) In-house serviceability | Accessibility of instrument parts for in-house servicing and routine maintenance (e.g. electrode exchange) | Reduces instrument down-time and call out costs; can be judged from technical specifications, operating manual and experience of existing users |
References
- P. T. Kissinger, The Past, Present, and Future of Electroanalytical Chemistry, ed. Z. Nagy and B. Ernest, Yeager Center for Electrochemical Sciences (YCES) and Chemical engineering Department, Case Western Reserve University, Cleveland, Ohio, 2005 Search PubMed; B. Ernest, ed. Yeager Center for Electrochemical Sciences (YCES) and Chemical Engineering Department, Case Western Reserve University, Cleveland, Ohio, 10-10-2012.
- M. Heyrovsky and J. Heyrovsky, Polarography, ed. Z. Nagy and B. Ernest, Yeager Center for Electrochemical Sciences (YCES) and Chemical engineering Department, Case Western Reserve University, Cleveland, Ohio, 2010 Search PubMed; B. Ernest, Yeager Center for Electrochemical Sciences (YCES) and Chemical Engineering Department, Case Western Reserve University, Cleveland, Ohio, 10-10-2012.
- M.-L. Tercier and J. Buffle, Antifouling membrane-covered voltammetric microsensor for in-situ measurements in natural waters, Anal. Chem., 1996, 68, 3670–3678 CrossRef CAS.
- J. Wang, M. Bonakdar and M. M. Pack, Glassy carbon electrodes coated with cellulose acetate for adsorptive stripping voltammetry, Anal. Chim. Acta, 1987, 192, 215–223 CrossRef CAS.
- E. A. Hutton, B. Ogorevic, S. B. Hočevar, F. Weldon, M. R. Smyth and J. Wang, An introduction to bismuth film electrode for the use in cathodic electrochemical detection, Electrochem. Commun., 2001, 3, 707–711 CrossRef CAS.
- M. Taillefert and T. F. Rozan, Electrochemical Methods for the Environmental Analysis of Trace Elements Biogeochemistry, in Environmental Electrochemistry. Analyses of Trace Element Biogeochemistry, ed. M. Taillefert and T. F. Rozan, ACS, 2002, pp. 2–14 Search PubMed.
- A. M. Mota and M. M. Correia dos Santos, Trace metal speciation of labile chemical species in natural waters: electrochemical methods, in Metal speciation and bioavailability in aquatic systems, ed. A. Tessier and D. R. Turner, Chichester, John Wiley & Sons Ltd., 1995, pp. 205–258 Search PubMed.
- J. Wang, N. Foster, S. Armalis, D. Larson, A. Zirino and K. Olsen, Remote stripping electrode for in situ monitoring of labile copper in the marine environment, Anal. Chim. Acta, 1995, 310, 223–231 CrossRef CAS.
- C. B. Braungardt, E. P. Achterberg and B. Axelsson, et al., Analysis of dissolved metal fractions in coastal waters: An inter-comparison of five voltammetric in situ profiling (VIP) systems, Mar. Chem., 2009, 114, 47–55 CrossRef CAS PubMed.
- R. Agraz, M. T. Sevilla and L. Hernandez, Chemically modified electrode for the simultaneous determination of trace metals and speciation analysis, Anal. Chim. Acta, 1993, 205–212 CrossRef CAS.
- B. J. Sanghavi and A. K. Srivastava, Simultaneous voltammetric determination of acetaminophen, aspirin and caffeine using an in situ surfactant-modified multiwalled carbon nanotube paste electrode, Electrochim. Acta, 2010, 55, 8638–8648 CrossRef CAS PubMed.
- J.-M. Zen, A. S. Kumar and D.-M. Tsai, Recent updates of chemically modified electrodes in analytical chemistry, Electroanalysis, 2003, 15, 1073–1087 CrossRef CAS.
- R. G. Compton and C. E. Banks, Understanding Voltammetry, Imperial College Press, London, 2011 Search PubMed.
- D. R. Crow, Principles and Applications of Electrochemistry, Stanley Thornes Ltd., Cheltenham, 1994 Search PubMed.
- C. H. Hamann, A. Hamnett and W. Vielstich, Electrochemistry, Wiley-VCH Verlag GmBH, Weinheim, Germany, 1998 Search PubMed.
- J. Buffle, Complexation Reactions in Aquatic Systems; and Analytical Approach, Ellis Horwood Ltd, Chichester, 1988 Search PubMed.
- J. Wang, Analytical Electrochemistry, Wiley-VCH, Weinheim, 2006 Search PubMed.
- C. M. G. Van den Berg, Electroanalytical chemistry of sea-water, in Chemical Oceanography, ed. J. P. Riley and R. Chester, Academic Press, Ltd., New York, 1988, pp. 197–245 Search PubMed.
- C. M. G. Van den Berg, Potentials and potentialities of cathodic stripping voltammetry of trace elements in natural waters, Anal. Chim. Acta, 1991, 250, 165–276 CrossRef.
- J. Pei, M. L. Tercier-Waeber and J. Buffle, Simultaneous determination and speciation of zinc, cadmium, lead, and copper in natural water with minimum handling and artifacts, by voltammetry on a gel-integrated microelectrode array, Anal. Chem., 2000, 72, 161–171 CrossRef CAS.
- C. M. G. Van den Berg, Adsorptive cathodic stripping voltammetry of trace elements in sea water, Analyst, 1989, 114, 1527–1530 RSC.
- M. L. A. M. Campos and C. M. G. van den Berg, Determination of Cu complexation in sea water by CSV and ligand competition with salicylaldoxime, Anal. Chim. Acta, 1994, 284, 481–496 CrossRef.
- J. R. Donat and K. W. Bruland, Direct determination of dissolved cobalt and nickel in seawater by differential pulse cathodic stripping voltammetry preceded by adsorptive collection of cyclohexane-1,2-dione dioxime complexes, Anal. Chem., 1988, 60, 240–244 CrossRef CAS.
- L. M. Carvalho, P. C. do Nascimento, D. Bohrer, E. J. Pilau, R. Stefanello and M. Lauer, Voltammetric Behavior of Arsenic(III) in the Presence of Sodium Diethyl Dithiocarbamate and Its Determination in Water and Highly Saline Samples by Adsorptive Stripping Voltammetry, Electroanalysis, 2006, 18(11), 1081–1089 CrossRef.
- M. Lu, N. V. Rees, A. S. Kabakaev and R. G. Compton, Determination of iron: electrochemical methods, Electroanalysis, 2012, 24(8), 1693–1702 CAS.
- C. B. Braungardt, E. P. Achterberg and M. Nimmo, On-line voltammetric monitoring of dissolved Cu and Ni in the Gulf of Cadiz, south-west Spain, Anal. Chim. Acta, 1998, 377, 205–215 CrossRef CAS.
- C. B. Braungardt, E. P. Achterberg, M. Gledhill, M. Nimmo, F. Elbaz-Poulichet, A. Cruzado and Z. Velasquez, Chemical speciation of dissolved Cu, Ni and Co in a contaminated estuary in southwest Spain and its influence on plankton communities, Environ. Sci. Technol., 2007, 41, 4212–4220 CrossRef.
- C. B. Braungardt, K. A. Howell, A. D. Tappin and E. P. Achterberg, Temporal variability in dynamic and colloidal metal fractions determined by high resolution in situ measurement in a UK estuary, Chemosphere, 2011, 84, 423–431 CrossRef CAS PubMed.
- E. Dixon, M. Gardner and S. Parry, Optimised design for complexation capacity titrations, Chem. Speciation Bioavailability, 1999, 11, 51–56 CrossRef CAS.
- M. T. Lam, J. Murimboh, N. M. Hassan and C. L. Chakrabarti, Competitive ligand exchange/adsorptive cathodic stripping voltammetry (CLE/AdCSV) for kinetic studies of nickel speciation in aqueous environmental samples containing heterogeneous, macromolecular, organic complexants, Anal. Chim. Acta, 1999, 402, 195–209 CrossRef CAS.
- M. Pesavento, G. Alberti and R. Biesuz, Analytical methods for determination of free metal ion concentration, labile species fraction and metal complexation capacity of environmental waters: A review, Anal. Chim. Acta, 2009, 631, 129–141 CrossRef CAS PubMed.
- J. Galceran, C. Huidobro, E. Companys and G. Alberti, AGNES: A technique for determining the concentration of free metal ions. The case of Zn(II) in coastal Mediterranean seawater, Talanta, 2007, 71, 1795–1803 CrossRef CAS PubMed.
- F. J. Thomas and G. Henze, Applications: organic species, Introduction to Voltammetric Analysis: Theory and Practice, Csiro Publishing, ch. 7, 2001 Search PubMed.
- P. Zuman, Principles of Applications of Polarography and Voltammetry in the Analysis of Drugs, FABAD J. Pharm. Sci., 2006, 31, 97–115 Search PubMed.
| This journal is © The Royal Society of Chemistry 2015 |