Rapid analysis of four Sudan dyes using direct analysis in real time-mass spectrometry
Ze
Li
,
Yi-Wei
Zhang
,
Yi-Ding
Zhang
,
Yu
Bai
and
Hu-Wei
Liu
*
Beijing National Laboratory for Molecular Sciences, Key Laboratory of Bioorganic Chemistry and Molecular Engineering of Ministry of Education, College of Chemistry and Molecular Engineering, Peking University, Beijing 100871, China. E-mail: hwliu@pku.edu.cn; Fax: +86-10-62751708; Tel: +86-10-62754976
First published on 19th November 2014
Abstract
A simple direct analysis in a real time-mass spectrometry (DART-MS) method was developed for the rapid determination of four Sudan dyes (I–IV) in chili powder. Simple liquid extraction by hexane without further clean-up was used for sample preparation. DART parameters were systematically optimized to achieve the best detection performance. A DIP-it sampler was used for automatic sampling. The matrix effect was measured by comparing the limit of detection (LOD) in matrix solution with that in pure organic solution. Eventually, the identification of the Sudan dyes was confirmed by MS/MS results and the LODs for four analytes in matrix solution were ∼0.5 μg mL−1. The method showed good linearity with correlation coefficients (R2) greater than 0.99 for concentrations ranging from 1 to 20 μg mL−1. The whole analytical process could be completed within 15 minutes with good recoveries (88–116%) and satisfactory repeatability (<26%, n = 3).
Introduction
Sudan dyes are a family of synthetic organic azo-compounds, which are abundantly used in industry for coloring. However, some human foodstuff such as chili powder and chili sauces were reported to be illegally adulterated with Sudan dyes a few years ago.1,2 This is very harmful to human health because molecules with diazo bonds could cause cancer.3 Due to their potential danger, many countries have banned the use of most azo-dyes in human consumption products. Actually, the European Food Safety Authority (EFSA) has declared Sudan dyes as suspected carcinogens and classified as group 3 compounds. Additionally, the European Union fixed an action to set a limit of 0.5 mg kg−1 for Sudan dyes in foodstuff (Commission Directive 2006/33/EC).4 Several methods for the determination of Sudan I–IV have been published in the past years,5–10,21 and were mostly based on liquid chromatography (LC) with photometry or mass spectrometry (MS) detectors, which is time-consuming due to chromatography separation and complicated sample preparation. Micellar electrokinetic chromatography (MEKC)10 and the enzyme-linked immunosorbent assay (ELISA)11 have also been proposed. Furthermore, some efficient sample pre-preparation methods12–14 such as molecularly imprinted solid-phase extraction (MISPE), SPE and dispersive liquid–liquid microextraction (DLLME) were introduced to obtain better sensitivity. Similarly, complex sample pre-preparation procedures were labour-intensive. Therefore, fast and sensitive methods for the identification and quantification of Sudan dyes in food have been extensively desired.Ambient mass spectrometry (AMS) is a novel ionization technique first proposed by G. Cooks in 2004.15 The main advantage of this method is that it facilitated MS analysis under ambient conditions without or with a little sample preparation and separation. Direct analysis in real time (DART) is a representative ion source of AMS that has been commercialized and widely applied for the detection of various small molecules.16–19 Samples could be analyzed in various states including gases, liquids and solids. For instance, liquid analysis could be conducted by dipping a glass rod into the fluid followed by directly placing the glass rod in front of the DART ionizing beam. As AMS is capable of providing real-time information, it has been widely applied for high throughput analysis.
In this work, we proposed DART-MS as a new method for the determination of four Sudan dyes. Simple liquid extraction was combined with DART-MS direct analysis, and the method was supposed to be easy, fast and highly efficient.
Results and discussion
Optimization of DART-MS parameters
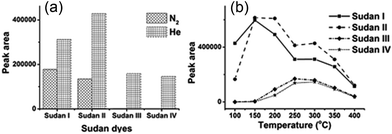
In order to realize higher ionization efficiency and better detection performance, DART-MS parameters including working gas types, gas heater temperature (50–450 °C, in 50 °C steps), the distance between the DART orifice and MS inlet and sampling speed were all investigated with diluted mixed stock solution (5 ppm). The working gas types and gas temperature were found to be the most important factors influencing the signal intensity. As shown in Fig. 1(a), only Sudan I and II could be detected when nitrogen was used as the working gas (gas heater temperature 300 °C). The excited state of helium (23S, electronic excited state, 19.8 eV) has higher energy than that of nitrogen, thus more kinds of analytes could be ionized.16 Therefore, helium was chosen as the working gas for the following experiments. | ||
| Fig. 1 The optimization of DART parameters affecting the detection performance of four Sudan dyes: (a) working gas types; (b) gas heater temperature. | ||
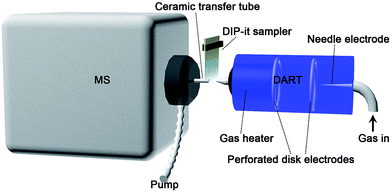
Working gas temperature would affect the analyte desorption efficiency, and then the signal intensity. Fig. 1(b) shows that for low molecular weight targets like Sudan I and II, the highest peak intensity was observed at 150 °C. Along with the increase of gas temperature, the desorption efficiency of higher boiling point Sudan III and IV started to increase. But the signal intensity of Sudan I and II decreased due to insufficient ionization efficiency, which was caused by ion competition ionization. 250 °C would be the best for Sudan III and IV. Taking all four target analytes into consideration, 300 °C was selected as gas heater temperature eventually. Other DART parameters were further evaluated with mixed standard working solutions (5 ppm). A distance of 2.2 cm from the DART orifice to the ceramic transfer tube orifice and a rate of 0.2 mm s−1 for the DIP-it sampler were finally chosen for later analysis. The analysis diagram is shown in Scheme 1.
Under all the optimized conditions, mixed standard solutions were detected as demonstrated. Fig. 2 shows that all the four target analytes were observed in their protonated molecular ions (Sudan I ([M + H]+, m/z 249.21), Sudan II ([M + H]+, m/z 277.25), Sudan III ([M + H]+, m/z 353.27), and Sudan IV ([M + H]+, m/z 381.30)). This is because proton transfer is the dominant mechanism in positive mode.
Matrix effect, limit of detection (LOD), linearity and reproducibility
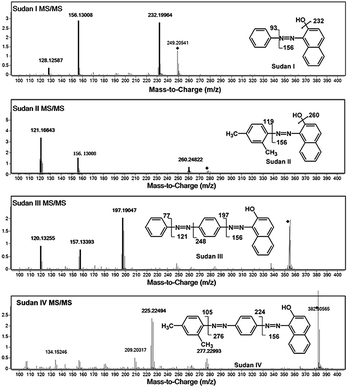
The high resolution feature of QTOF-MS was useful for identification and confirmation of target analytes. However, when considering the unknown complex components, only protonated molecular ions were not sufficient to confirm the presence of target molecules. To make the results more reliable, MS/MS detection was used, and a precursor ion and at least one daughter ion were used to confirm the existence of target analytes. To evaluate the effect of chili powder matrix on the detection, LODs of the four Sudan dyes in methanol and in matrix solutions were measured. Collision energies were optimized to obtain the best MS/MS performance, and the finally selected values are listed in Table 1. MS/MS spectra and proposed fragmentation pathways are shown in Fig. 3. Under optimized conditions, the LODs measured in methanol and in matrix solutions are listed in Table 2. Sudan I and II could be detected at a concentration as low as 100 ng mL−1, while Sudan III and IV could be detected at 80 ng mL−1 in methanol. Owing to the matrix interference especially in higher molecular ranges, detection sensitivities in matrix solutions were worse than those in pure organic solution. Sudan III and IV could not be observed until 0.5 μg mL−1, while Sudan I and II were detected at 0.4 μg mL−1 and 0.3 μg mL−1, respectively. The LODs obtained in this method were better than those reported by the ambient MS approach.20 Due to method reliability, liquid extraction without further clean-up was adopted for sample preparation. Along with the further increase of analyte concentration, clear protonated molecular ions could be apparently observed even in matrix solutions. Therefore, the MS scan method was adopted and the extracted protonated ion chromatograms were integrated for the following quantitative analysis for method simplicity. Each analysis was measured according to the average peak areas of 6 repeated samples.| Compound | Methanol (μg mL−1) | Matrix (μg mL−1) |
|---|---|---|
| Sudan I | 0.1 | 0.4 |
| Sudan II | 0.1 | 0.3 |
| Sudan III | 0.08 | 0.5 |
| Sudan IV | 0.08 | 0.5 |
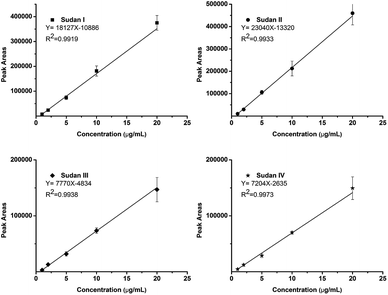
The calibration curve was built by sampling five matrix-diluted standard solutions at 1, 2, 5, 10 and 20 ppm, respectively. Higher concentrations (50 and 100 ppm) could not be obtained with good linearity due to the ion competition and suppression effect. Four calibration curves with correlation coefficients (R2) higher than 0.99 were obtained as shown in Fig. 4. The reproducibilities were measured at all concentrations covering the calibration curve and all achieved satisfactory RSDs (n = 6) lower than 15%. To further increase the reproducibility, an isotope-internal standard may be needed.
Method application
Three kinds of chili powders were purchased from the local market and all were detected as Sudan dye adulteration-free samples. Therefore, the recovery of the proposed liquid-extraction DART-MS approach was conducted by spike experiments. Method reproducibility and recovery are all listed in Table 3. Good recoveries for all four Sudan dyes at three concentrations were obtained, ranging from 88% to 116% with satisfactory repeatability under 26% (RSD, n = 3).| Compound | Spiked samples (ppm) | Calculated concentration (ppm) | RSD (n = 3) | Recovery (%) |
|---|---|---|---|---|
| a ND: not detected. | ||||
| Sudan I | 0 | NDa | ND | ND |
| 10 | 11.6 | 0.19 | 116 | |
| 20 | 18.9 | 0.10 | 95 | |
| 40 | 36.8 | 0.19 | 92 | |
| Sudan II | 0 | ND | ND | ND |
| 10 | 10.1 | 0.25 | 101 | |
| 20 | 17.6 | 0.05 | 88 | |
| 40 | 36.5 | 0.21 | 91 | |
| Sudan III | 0 | ND | ND | ND |
| 10 | 11.2 | 0.26 | 112 | |
| 20 | 21.5 | 0.22 | 107 | |
| 40 | 38.5 | 0.07 | 96 | |
| Sudan IV | 0 | ND | ND | ND |
| 10 | 9.6 | 0.06 | 96 | |
| 20 | 19.2 | 0.15 | 96 | |
| 40 | 37.5 | 0.11 | 94 | |
Experimental
Reagents and standards
Four standard Sudan dyes (Sudan I, 1-[(2,4-dimethylphenyl)azo]-2-naphthalenol; Sudan II, 1-(phenylazo)-2-naphthol; Sudan III, 1-(4-phenylazophenylazo)-2-naphthol; and Sudan IV, o-tolylazo-o-tolylazo-betanaphthol) were obtained from Sigma Aldrich (St Louis, MO). Methanol and hexane of HPLC-grade were supplied by Dikma Technologies Inc. (Richmond, VA, USA). Four standard stock solutions were individually prepared in methanol at a concentration of 0.5 mg mL−1. Mixed matrix-free working solution (5 ppm) used for method optimization was prepared by diluting the stock solutions with hexane. All solutions were stored at 4 °C in darkness.Pepper powder was purchased from the local market.
Helium gas (purity 99.999%) was purchased from Beijing Helium Gas Industry Co. Ltd. (Beijing, China) and nitrogen gas (purity 99.999%) was purchased from Haike Yuanchang Applied Gas Co. Ltd. (Beijing, China).
Sample preparation
Preliminary experiments showed that the chili powder used was adulteration-free. Then 0.5 g chili powder was weighed into 10 mL centrifugal tubes, and 5 mL hexane was added for liquid extraction. Tubes were manually shaken for a few seconds, followed by 5 minute sonication. At last, the samples were centrifuged for 3 minutes at 3000 r min−1. Supernatant layer liquid was obtained as matrix solution.Matrix-diluted solutions were provided to measure the LODs and calibration curves. Stock solutions were diluted with matrix solution to obtain a series of working standards ranging from 1 to 100 ppm. For recovery experiments, corresponding standard stock solutions were directly spiked into 0.5 g chili powder and air dried. Further sample preparations were carried out in the same way as above. A fused glass rod, which is called DIP-it economically, was dipped into the extraction hexane layer for a few seconds, and then placed into the DART working gas stream for DART-MS analysis.
Apparatus and parameters
All analyses were performed on an Agilent 6530 Accurate-Mass Quadrupole Time-of-Flight mass spectrometer (Agilent Technologies, CA, USA), equipped with a DART®-SVP source (IonSense, Saugus, MA, USA) after removing the Agilent Jet Stream ESI source. A ceramic transfer tube (3.75 mm i.d., 83 mm length) and vacuum pump were equipped outside and aligned in line with the QTOF-MS orifice for ion transfer (see Scheme 1), according to existing publications.21 Both DART and QTOF-MS were operated in positive mode. An automatic 12-sample DIP-it sampler (IonSense, Saugus, MA, USA) was equipped for sampling. It allowed multiple sample analysis automatically at one time, thus greatly improving approach efficiency. The MS operating conditions were set as commonly used parameters, which have been optimized earlier in our lab: capillary entrance voltage 3500 V, fragmentor 175 V, and skimmer 65 V. Both the MS and MS/MS data were acquired at a rate of 1.02 spectra per second in the mass range of 50–500 (m/z) by MassHunter Data Acquisition B.02.00 (Agilent Technologies, CA, USA). Data analysis was conducted with a MassHunter Qualitative Analysis B.02.00 (Agilent Technologies, CA, USA). The voltage of the discharge needle and the grid electrode of DART were set to 6 kV and 100 V, respectively, according to previous optimization experiments. The working gas types and gas heater temperature were optimized to obtain the best sensitivity.Conclusions
A simple method for the fast determination of four Sudan dyes (I–IV) was developed in this work. Simple liquid extraction with DIP-it sampling and DART-MS detection were combined together. DART parameters were systematically optimized, and finally helium gas and gas heater temperature of 300 °C were selected for the analysis. Matrix-diluted solutions were provided to measure the LODs and calibration curves. Reliable results were confirmed by MS/MS detection and satisfactory sensitivity (0.5 ppm) was obtained. The detection method was proved to have good linearity (1–20 ppm, R2 > 0.99) and repeatability (RSD < 15%). The whole analytical process could be completed within 15 minutes with good recoveries (88–116%) and satisfactory repeatability (<26%, n = 3).Acknowledgements
This work was financially supported by the National Natural Science Foundation of China (Grant no. 21275012).Notes and references
- F. Calbiani, M. Careri, L. Elviri, A. Mangia and I. Zagnoni, J. Chromatogr. A, 2004, 1058, 127–135 CrossRef CAS PubMed.
- F. Calbiani, M. Careri, L. Elviri, A. Mangia, L. Pistarà and I. Zagnoni, J. Chromatogr. A, 2004, 1042, 123–130 CrossRef CAS PubMed.
- M. Stiborová, V. Martínek, H. Rýdlová, P. Hodek and E. Frei, Cancer Res., 2002, 62, 5678–5684 Search PubMed.
- C. Schummer, J. Sassel, P. Bonenberger and G. Moris, J. Agric. Food Chem., 2013, 61, 2284–2289 CrossRef CAS PubMed.
- V. Cornet, Y. Govaert, G. Moens, J. Van Loco and J. M. Degroodt, J. Agric. Food Chem., 2006, 54, 639–644 CrossRef CAS PubMed.
- E. Ertas, H. Özer and C. Alasalvar, Food Chem., 2007, 105, 756–760 CrossRef CAS PubMed.
- L. M. He, Y. J. Su, B. H. Fang, X. G. Shen, Z. L. Zeng and Y. H. Liu, Anal. Chim. Acta, 2007, 594, 139–146 CrossRef CAS PubMed.
- E. Mejia, Y. S. Ding, M. F. Mora and C. D. Garcia, Food Chem., 2007, 102, 1027–1033 CrossRef CAS PubMed.
- M. R. V. S. Murty, N. Sridhara Chary, S. Prabhakar, N. Prasada Raju and M. Vairamani, Food Chem., 2009, 115, 1556–1562 CrossRef CAS PubMed.
- T. S. Fukuji, M. Castro-Puyana, M. F. Tavares and A. Cifuentes, J. Agric. Food Chem., 2011, 59, 11903–11909 CrossRef CAS PubMed.
- C. M. Ju, Y. Tang, H. Y. Fan and J. D. Chen, Anal. Chim. Acta, 2008, 621, 200–206 CrossRef CAS PubMed.
- F. J. López-Jiménez, S. Rubio and D. Pérez-Bendito, Food Chem., 2010, 121, 763–769 CrossRef PubMed.
- H. Y. Yan, J. D. Qiao, H. Wang, G. L. Yang and K. H. Row, Analyst, 2011, 136, 2629–2634 RSC.
- M. M. Zheng, J. H. Wu, Y. Q. Feng and F. H. Huang, Anal. Methods, 2011, 3, 1851 RSC.
- Z. Takats, J. M. Wiseman, B. Gologan and R. G. Cooks, Science, 2004, 306, 471–473 CrossRef CAS PubMed.
- R. B. Cody, J. A. Laramée and H. D. Durst, Anal. Chem., 2005, 77, 2297–2302 CrossRef CAS PubMed.
- J. H. Gross, Anal. Bioanal. Chem., 2014, 406, 63–80 CrossRef CAS PubMed.
- L. P. Li, B. S. Feng, J. W. Yang, C. L. Chang, Y. Bai and H. W. Liu, Analyst, 2013, 138, 3097–3103 RSC.
- B. S. Feng, Y. Bai and H. W. Liu, Sci. Sin.: Chim., 2014, 44, 784–788 CrossRef PubMed.
- D. Taverna, L. Di Donna, F. Mazzotti, B. Policicchio and G. Sindona, J. Mass Spectrom., 2013, 48, 544–547 CrossRef CAS PubMed.
- S. Yu, E. Crawford, J. Tice, B. Musselman and J. T. Wu, Anal. Chem., 2009, 81, 193–202 CrossRef CAS PubMed.
| This journal is © The Royal Society of Chemistry 2015 |


