Highly sensitive and portable mercury(II) ion sensor using personal glucose meter
Xu
Xue-tao
*a,
Liang
Kai-yi
b and
Zeng
Jia-ying
c
aHKUST Fok Ying Tung Graduate School, GuangZhou, GuangDong 511458, China. E-mail: xuxuetao201405@163.com
bFaculté des Sciences et Techniques, Université du Maine Avenue Olivier Messiaen, 72085 Le Mans Cedex 9, France
cSouth China University of Technology, Tianhe, Guangzhou, Guangdong, China
First published on 6th August 2014
Abstract
In this paper, a highly sensitive and portable mercury(II) ion sensor based on personal glucose meter (PGM) recording is proposed. Thymine–thymine mismatches in the capture and detection of DNA were used to recognize target Hg2+. Magnetic separation and hydrolysis of sucrose into glucose of DNA-invertase conjugation were employed to obtain the PGM signal. There was a linear relationship between the PGM signal and the concentration of Hg2+ in the range of 8.0 nM to 1 μM. A correlation coefficient of 0.995 was obtained and the relative standard deviation was 3.6% for a concentration of 100 nM Hg2+ (n = 9). The selectivity and performance of the Hg2+ sensor in lake water, tap water and river water were also studied, which suggested our method has a great potential to be used in real applications.
1. Introduction
Mercuric ion (Hg2+) is a widespread heavy metal ion which may cause deleterious effects on human health and the environment.1 A very low concentration of Hg2+ can lead to adverse human health effects. Water-soluble Hg2+ is one of the most stable forms of mercury pollution.2,3 To prevent potential human exposure to Hg2+, it is of great significance to be able to selectively and sensitively detect water-soluble Hg2+. Great efforts have been made to develop sensitive and selective Hg2+ detection methods. Among those methods, some are constructed by using thymine (T)-containing oligonucleotides as the sensing elements.4,5 As reported in previous papers, Hg2+ can bind to two T residues of DNA, with high selectivity and affinity, which provides a powerful tool to develop Hg2+ detection methods. Many Hg2+ detection methods based on traditional analytical techniques, such as atomic absorption spectrometry, atomic fluorescence spectrometry, mass spectrometry, inductively coupled plasma atomic emission spectrometry and cyclic voltammetry, have been developed.6,7 Although high sensitivity and selectivity have been achieved, most of these analytical techniques are expensive, time-consuming and require sophisticated instrumentation.8–12 This has limited their wider applications, such as on-site applications. Therefore, it is interesting and of significance to develop a highly sensitive, inexpensive, simple and point-of-use method to detect Hg2+.Due to its low cost, simple operation and portability, the personal glucose meter (PGM) has attracted worldwide attention.13,14 It is available in stores at a low price (as low as $10 for a meter), and has been integrated into cell phones for point-of-use application. PGMs are mainly used to monitor the glucose concentration in diabetic patients. In 2011, Yi Lu linked PGM with functional DNA sensors to achieve portable, low-cost and quantitative detection of targets other than glucose.15 This has provided an excellent alternative to develop sensitive, inexpensive, simple and point-of-use Hg2+ sensors. However, it is an invasive DNA approach toward targets, which sacrifices the sensitivity of detection.
In this work, we developed a highly sensitive and portable mercury(II) ion sensor using a PGM. As shown in Fig. 1, in the presence of Hg2+, the Hg2+ and detection DNA were captured and concentrated onto streptavidin-MNBs through T–Hg–T linkage and magnetic separation, respectively. After the washing away of unbound Hg2+ and detection DNA, the bound DNA-invertase can be used to catalyze the hydrolysis of sucrose into glucose with millions of turnovers, which transformed the concentration of Hg2+ into the level of glucose for monitoring by a PGM.
2. Experimental
2.1 Reagents and chemicals
Streptavidin-MNBs (350 nm in diameter, aqueous suspension containing 0.05% Tween-20, 0.1% bovine serum albumin (BSA) and 10 μM EDTA at a concentration of 3.324 × 10¹¹ beads mL−1) were obtained from Bangs Laboratories Inc. (Fishers, IN). All oligonucleotides were synthesized and purified by Sangon (Shanghai, China). The sequences were as follows:Capture DNA: 5′-biotin-AAAAAAAAA![[T with combining low line]](https://www.rsc.org/images/entities/i_char_0054_0332.gif)
![[T with combining low line]](https://www.rsc.org/images/entities/i_char_0054_0332.gif)
![[T with combining low line]](https://www.rsc.org/images/entities/i_char_0054_0332.gif) CCG
CCG![[T with combining low line]](https://www.rsc.org/images/entities/i_char_0054_0332.gif)
![[T with combining low line]](https://www.rsc.org/images/entities/i_char_0054_0332.gif)
![[T with combining low line]](https://www.rsc.org/images/entities/i_char_0054_0332.gif) CGC
CGC![[T with combining low line]](https://www.rsc.org/images/entities/i_char_0054_0332.gif)
![[T with combining low line]](https://www.rsc.org/images/entities/i_char_0054_0332.gif)
![[T with combining low line]](https://www.rsc.org/images/entities/i_char_0054_0332.gif) -3′
-3′
Detection DNA: 5′-HS-AAAAAAAAA![[T with combining low line]](https://www.rsc.org/images/entities/i_char_0054_0332.gif)
![[T with combining low line]](https://www.rsc.org/images/entities/i_char_0054_0332.gif)
![[T with combining low line]](https://www.rsc.org/images/entities/i_char_0054_0332.gif) GCG
GCG![[T with combining low line]](https://www.rsc.org/images/entities/i_char_0054_0332.gif)
![[T with combining low line]](https://www.rsc.org/images/entities/i_char_0054_0332.gif)
![[T with combining low line]](https://www.rsc.org/images/entities/i_char_0054_0332.gif) GCC
GCC![[T with combining low line]](https://www.rsc.org/images/entities/i_char_0054_0332.gif)
![[T with combining low line]](https://www.rsc.org/images/entities/i_char_0054_0332.gif)
![[T with combining low line]](https://www.rsc.org/images/entities/i_char_0054_0332.gif) -3′
-3′
All DNA oligonucleotides were diluted by TE buffer (10 mM Tris–HCl and 1.0 mM Na2EDTA, pH 8.0). They were denatured at 95 °C for 5 min and naturally cooled down to room temperature before use. Grade VII invertase obtained from baker's yeast (S. cerevisiae), Tween-20, sulfosuccinimidyl-4-(N-maleimidomethyl)cyclohexane-1-carboxylate (sulfo-SMCC), Tris(2-carboxyethyl)phosphine hydrochloride (TCEP) and BSA were purchased from Sigma (St. Louis, MO). Other chemicals were of analytical grade and obtained from standard reagent suppliers and used directly. All solutions were prepared with Milli-Q water (resistivity = 18 MΩ cm) from a Millipore system.
2.2 DNA-invertase conjugation
Firstly, amounts of 30 μL of detection DNA (1 mM), 2 μL of sodium phosphate buffer (1 M, pH 5.5) and 2 μL of TCEP solution (30 mM) were mixed, which was then incubated for 1 h at room temperature. The mixture was purified by Amicon-10K 10 times using buffer A (0.1 M NaCl, 0.05% Tween-20, 0.1 M sodium phosphate buffer, pH 7.3). Then, in order to conduct invertase conjugation, 1 mg of sulfo-SMCC was added into 400 μL of invertase solution (dissolved in buffer A), which was incubated for 1 h on a roller. The obtained mixture was purified through centrifugation and Amicon-100K using buffer A 10 times. Finally, the obtained sulfo-SMCC-activated invertase was mixed with the detection DNA, which was incubated for 48 h at room temperature. The mixture was purified by Amicon-100K 10 times using buffer A.2.3 Procedures for Hg2+ detection using PGM
Firstly, 5 μL of streptavidin-MNBs was washed three times by using buffer A to remove the surfactants. Then, 50 μL of buffer A was added into the streptavidin-MNBs suspension. One microliter of this streptavidin-MNBs suspension was added into a tube and 10 μL of capture DNA was added to bind the streptavidin-MNBs, which was placed on a roller for 30 min. It was washed using buffer A 5 times and the streptavidin-MNBs were separated by a magnet. Then, 100 μL of Hg2+ at different concentrations were mixed with the obtained streptavidin-MNBs and 100 μL of DNA-invertase conjugate (obtained as described in Section 2.2). It was allowed to incubate for 2 h on a roller. The mixture was further washed 5 times using buffer A containing BSA (2 mg mL−1). It was washed 5 times using buffer A. Finally, 100 μL of sucrose in buffer A (0.5 M) was added into the system and allowed to incubate for 3 h. An amount of 5 μL of the obtained mixture was detected by a PGM.3. Results and discussion
3.1 Design principle of Hg2+ sensor using a PGM
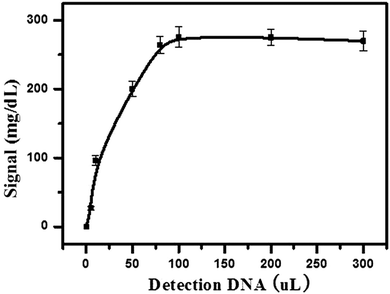
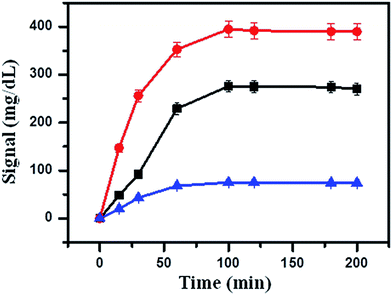
The design principle of the Hg2+ sensor is schematically described in Fig. 1. The capture DNA was immobilized onto streptavidin-MNBs through the reaction between streptavidin and biotin. The detection DNA was modified with DNA-invertase conjugation. In this case, the detection DNA and capture DNA were separated, as the mismatch of T–T. In the presence of Hg2+, the detection DNA and capture DNA stitched together after formation of T–Hg–T complex. The Hg2+ and detection DNA were captured and concentrated onto the streptavidin-MNBs through T–Hg–T linkage and magnetic separation, respectively. Therefore, only in the presence of Hg2+ can the detection DNA modified with DNA-invertase conjugation be immobilized onto streptavidin-MNBs. We assumed the concentration of Hg2+ was proportional to the amount of DNA-invertase bound to the streptavidin-MNBs. After the washing away of unbound Hg2+ and detection DNA, the bound DNA-invertase can be used to catalyze the hydrolysis of sucrose into glucose with millions of turnovers, which transformed the concentration of Hg2+ into the level of glucose for monitoring by a PGM.3.2 Optimization of experimental parameters
3.3 Sensing performance for Hg2+ detection
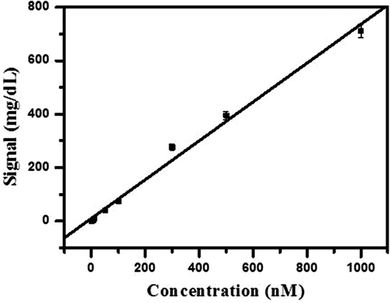
In order to evaluate the performance of the Hg2+ sensor, we challenged it with a series of concentrations of Hg2+, covering a range of nearly 3 orders of magnitude (8.0 nM to 1 μM). Improved signal of PGM was observed with the increase of Hg2+ concentration and intensity of signal increased monotonically (nearly linearly) with the concentration of Hg2+ (as shown in Fig. 4). There was a linear relationship between the signal of the PGM and the concentration of Hg2+ in the range of 8.0 nM to 1 μM. A correlation coefficient of 0.995 was obtained and the relative standard deviation (RSD) was 3.6% for a concentration of 100 nM Hg2+ (n = 9), which was comparable to or even better than some other reported methods. Such an attractive detection limit of our sensing strategy can be primarily attributed to the enrichment effect of streptavidin-MNBs and the million turnovers of sucrose hydrolysis into glucose. Substantial Hg2+ and detection DNA in solution were collected onto the surface of the PGM and one sucrose on the detection DNA turns into millions of glucose for monitoring by the PGM. According to the maximum contamination level of Hg2+ in drinking water issued by the United States Environmental Protection Agency (EPA), our Hg2+ sensor has great application prospects for the point-of-use and routine monitoring of Hg2+ with a wide dynamic range and superior detection sensitivity. A comparison of the detection performance with traditional methods using different equipment for determination of Hg2+ is given in Table 1. | ||
| Fig. 4 Relationship between the concentration of Hg2+ and signal. Condition: each data point represents an average of 3 measurements (each error bar indicates the standard deviation). | ||
| Equipment | Method | Linear range (10−7 mol L−1) | Reference |
|---|---|---|---|
| Spectrofluorimeter | QDs/DNA/Au NPs based nanosensor | 0.02–0.6 | Anal. Chem., 83, 7061–7065 |
| Test paper detection | Variation of color upon binding with reagent | 100–4000 | RSC Adv., 2012, 2, 3714–3721 |
| UV-visible spectrophotometer | Coordination of Hg2+ to gold nanoparticles | 0.1–5 | Analyst, 2011, 136, 1690–1696 |
| Electrochemical workstation | Modification of glassy carbon electrode | 0.01–1 | Anal. Methods, 2014, 6, 4988–4990 |
| Renishaw 2000 | Interaction between silver nanoparticles and Hg2+ | 90.9 pM detected | Nanoscale, 2012, 4, 5902–5905 |
| Personal glucose meter | T–T mismatches recognize target Hg2+ | 0.08–10 | This work |
3.4 Selectivity
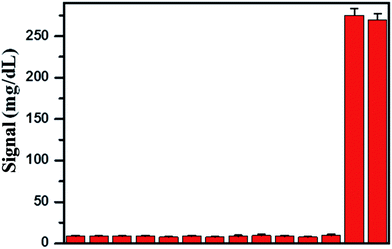
In order to evaluate the selectivity of the Hg2+ sensor for Hg2+, we challenged the Hg2+ sensor with a series of environmentally relevant metal ions, including Cd2+, Pb2+, Mn2+, Fe3+, Cu2+, Co2+, Ni2+, Al3+, Ca2+, Cr3+, Sn2+, Zn2+, and Ag+, using the same experimental procedures as those for Hg2+. These metal ions were selected as they may coexist with Hg2+ in drinking water. The response of the Hg2+ sensor to these metal ions is shown in Fig. 5. We found that the presence of those metal ions at 1 μM elicits negligible responses compared with that of 300 nM of Hg2+ and their mixture. The signal of PGM was almost equal to the background signal. These observations suggested that binding of Hg2+ relies on specific recognition and that capture DNA and detection DNA were highly specific for the capturing of Hg2+. What is more, the presence of abundant metal ions in the solution did not affect the detection of Hg2+, which suggests that our sensor holds great promise as a powerful tool to be applied for detection of Hg2+ in real samples.3.5 Real sample analysis
In order to evaluate the practical application of the proposed Hg2+ sensor, we challenged the Hg2+ sensor with a series of environmental water samples, namely lake water, tap water and river water, using the same experimental procedures as those for Hg2+ detection in buffer solution. The results of Hg2+ detection for the different water samples suggested that the signals of PGM in lake water, tap water and river water were similar to that in buffer solution. Furthermore, the Hg2+ sensor was challenged with different amounts of Hg2+ in different water samples for recovery tests. The results are summarized in Table 2. Satisfactory values of between 94 and 106% were obtained for the recovery experiments, which indicated that the possible interference from the different background composition of water samples on the Hg2+ sensor was negligible. The above results demonstrate that our introduced Hg2+ sensor can be successfully applied to Hg2+ analysis in real environmental samples.| Sample | Added (nM) | Found (nM) | Recovery (%) |
|---|---|---|---|
| a Note: each sample was analyzed using our proposed sensor, and all values were obtained as an average of three repeat determinations ± standard deviation (mean ± SD). | |||
| Tap water | 20 | 18.9 ± 4.6 | 94.5 |
| 100 | 103.2 ± 7.9 | 103.2 | |
| 300 | 285.0 ± 9.4 | 95.0 | |
| Lake water | 20 | 19.1 ± 4.9 | 95.5 |
| 100 | 106.1 ± 8.1 | 106.1 | |
| 300 | 282.3 ± 9.2 | 94.1 | |
| River water | 20 | 19.2 ± 5.1 | 96.0 |
| 100 | 98.5 | 98.5 | |
| 300 | 287.9 | 96.0 | |
4. Conclusion
In summary, a highly sensitive and portable Hg2+ sensor was developed based on thymine (T)-containing oligonucleotide recognition and PGM recording. The Hg2+ was captured and concentrated on streptavidin-MNBs and the DNA-invertase conjugation on the detection DNA catalyzed the hydrolysis of sucrose into glucose with millions of turnovers, which transformed the concentration of Hg2+ into the level of glucose for monitoring by the PGM. There was a linear relationship between the PGM signal and the concentration of Hg2+ in the range of 8.0 nM to 1 μM. A correlation coefficient of 0.995 was obtained and the relative standard deviation (RSD) was 3.6% for a concentration of 100 nM Hg2+ (n = 9). What is more, the Hg2+ sensor has a high selectivity in buffer solution and a comparable performance in lake water, tap water and river water, which suggests that our proposed Hg2+ sensor has a great positional to be used in real applications.References
- E. M. Nolan and S. J. Lippard, Tools and tactics for the optical detection of mercuric ion, Chem. Rev., 2008, 108, 3443–3480 CrossRef CAS PubMed.
- H. H. Harris, I. J. Pickering and G. N. George, The chemical form of mercury in fish, Science, 2003, 301, 1203 CrossRef CAS PubMed.
- I. Onyido, A. R. Norris and E. Buncel, Biomolecule–mercury interactions: modalities of DNA base–mercury binding mechanisms. Remediation strategies, Chem. Rev., 2004, 104, 5911–5929 CrossRef CAS PubMed.
- J. Chen, S. Zhou and J. Wen, Disposable strip biosensor for visual detection of Hg2+ based on Hg2+-triggered toehold binding and exonuclease III-assisted signal amplification, Anal. Chem., 2014, 86, 3108–3114 CrossRef CAS PubMed.
- T. Li, S. Dong and E. Wang, Label-free colorimetric detection of aqueous mercury ion (Hg2+) using Hg2+-modulated G-quadruplex-based DNAzymes, Analytical chemistry, 2009, 81, 2144–2149 CrossRef CAS PubMed.
- S. Xu, L. Chen, J. Li, Y. Guan and H. Lu, Novel Hg2+-imprinted polymers based on thymine–Hg2+–thymine interaction for highly selective preconcentration of Hg2+ in water samples, J. Hazard. Mater., 2012, 237–238, 347–354 CrossRef CAS PubMed.
- L. Chen, T. Lou, C. Yu and Q. Kang, N-1-(2-mercaptoethyl)thymine modification of gold nanoparticles: a highly selective and sensitive colorimetric chemosensor for Hg2+, Analyst, 2011, 136, 4770–4773 RSC.
- D. Huang, C. Niu, M. Ruan, X. Wang, G. Zeng and C. Deng, Highly sensitive strategy for Hg2+ detection in environmental water samples using long lifetime fluorescence quantum dots and gold nanoparticles, Environ. Sci. Technol., 2013, 47, 4392–4398 CrossRef CAS PubMed.
- D. Huang, C. Niu, X. Wang, X. Lv and G. Zeng, Turn-on fluorescent sensor for Hg2+ based on single-stranded DNA functionalized Mn:CdS/ZnS quantum dots and gold nanoparticles by time-gated mode, Anal. Chem., 2013, 85, 1164–1170 CrossRef CAS PubMed.
- A. Porchetta, A. Vallee-Belisle, K. W. Plaxco and F. Ricci, Allosterically tunable, DNA-based switches triggered by heavy metals, J. Am. Chem. Soc., 2013, 135, 13238–13241 CrossRef CAS PubMed.
- J. S. Lee, M. S. Han and C. A. Mirkin, Colorimetric detection of mercuric ion (Hg2+) in aqueous media using DNA-functionalized gold nanoparticles, Angew. Chem., Int. Ed., 2007, 46, 4093–4096 CrossRef CAS PubMed.
- T. Yuan, Z. Liu, L. Hu, L. Zhang and G. Xu, Label-free supersandwich electrochemiluminescence assay for detection of sub-nanomolar Hg2+, Chem. Commun., 2011, 47, 11951–11953 RSC.
- Y. Xiang and Y. Lu, Using personal glucose meters and functional DNA sensors to quantify a variety of analytical targets, Nat. Chem., 2011, 3, 697–703 CrossRef CAS PubMed.
- Y. Xiang and Y. Lu, Using commercially available personal glucose meters for portable quantification of DNA, Anal. Chem., 2012, 84, 1975–1980 CrossRef CAS PubMed.
- Y. Xiang and Y. Lu, An invasive DNA approach toward a general method for portable quantification of metal ions using a personal glucose meter, Chem. Commun., 2013, 49, 585–587 RSC.
| This journal is © The Royal Society of Chemistry 2015 |


