A novel platform for detection of protooncogene based on Au nanocluster enhanced fluorescence†
Kang
Mao
a,
Yizhen
Liu
ab,
Huaming
Xiao
a,
Yinran
Chen
a,
Zitong
Wu
a,
Xiaodong
Zhou
*a,
Aiguo
Shen
a and
Jiming
Hu
a
aKey Laboratory of Analytical Chemistry for Biology and Medicine (Ministry of Education), College of Chemistry and Molecular Sciences, Wuhan University, Wuhan, 430072, China. E-mail: zhouxd@whu.edu.cn; Tel: +86 027 68752439 8116
bCollege of Chemistry and Chemical Engineering, Shenzhen University, Shenzhen 518060, Guangdong, China
First published on 5th November 2014
Abstract
For the first time, gold nanoclusters were found to exhibit high fluorescence enhancement ability based on the metal-enhanced fluorescence (MEF) effect, which can effectively enhance the fluorescence of fluorescein isothiocyanate (FITC). By means of this phenomenon, Au nanoclusters have been successfully used in the construction of a fluorescence-enhanced sensing platform for the detection of protooncogene.
1. Introduction
Fluorescence-based detection technology, in combination with nanotechnology, has been widely used in biological fields.1–4 A number of fluorescent nanomaterials, including quantum dots,1 up conversion nanoparticles2 and dye-doped nanoparticles,3 are of considerable interest as sensors and indicators for biological detection due to their high fluorescence intensity, stability, and easy modification. To further increase fluorescence intensities of nanomaterial-based probes, metal nanostructures and dye molecules have been combined to fabricate metal–dye nanocomposites. It has been proven that fluorescence can be enhanced by several folds when the metal nanostructures and dye molecules are kept within a certain distance, but weakened or quenched otherwise.5–7 Such a fluorescence enhancement phenomenon is well-known as the metal-enhanced fluorescence (MEF) effect. The mechanisms of MEF have been extensively studied and several pathways of metal enhancement have been proposed.8–14 First of all, the occurrence of surface plasmon resonance (SPR) leads to a strongly enhanced absorption of the incident light.14–16 In fact, surface plasmon resonance has been widely used in explaining some interesting phenomena such as enhancement of the photoluminescence,15,16 plasmon-controlled Förster Resonance Energy Transfer (FRET),17 enhanced energy transfer between quantum dots (QDs) and nanoparticles,18–20 metal-enhanced surface plasmon-coupled phosphorescence,21 surface-enhanced Raman scattering (SERS)22 and plasmon-enhanced surface catalysis.23 Considering the fluorescence enhancement, when the surface plasmon resonance band of a metal nanostructure overlaps the excitation of the fluorophore, the energy is transferred from the metal to the fluorophores so that the possibility of excitation of the dye molecules is increased. Secondly, the metal nanostructure can change the radiative deactivation rate of the fluorophores. Thus, the fluorescence lifetime and the quantum yield are changed.24 Thirdly, the scattering of the metallic nanostructures affects the coupling efficiency of the fluorescence emission to the far field.25,26 By regulating the plasmon resonance band to the fluorophore emission wavelength, a fluorescence enhancement can be obtained. Also, the rapid development of nanotechnology has produced various new types of metallic nanostructures, which generates a number of new effects of metallic nanomaterials on dye molecular properties, such as the dimensional effects of metallic nanostructures on fluorescence intensity.27The fluorescence of metal nanoclusters has drawn continuous research interest in the fields of chemistry, biology and materials.4,28–32 There has been a great deal of research work on the fluorescence of metal nanoclusters, especially gold and silver.29,31,33,34 Owing to their ultrasmall size, biocompatibility and highly fluorescent properties, fluorescent gold nanoclusters (AuNCs) have become an attractive field of study. To date, the applications of fluorescent AuNCs in analysis are mainly based on the fluorescence quenching effect33,35 of AuNCs through the interaction between gold and the limited analytes like Fe3+,36 Hg2+,37,38 Cu2+,39,40 and cysteine.41 Also, AuNCs are novel optical probes for in vitro and in vivo fluorescence imaging.29,42 As we know, the fluorescence of AuNCs correlates not only with the metal quantization effect but also with the surface ligands or scaffolds.43 How to rationally design fluorescent AuNCs with functional ligands or scaffolds to give them broad applications remains to be explored.
According to the mechanisms of metal enhancement proposed above, for the first time, we report a simple and homogeneous assay format for protooncogene by using BSA-protected gold nanocluster-based enhanced fluorogenic nanoprobes. Except high selectivity and sensitivity, this mix-and-detect assay format is simple. Importantly, the assay is homogeneous because it occurs exclusively in the liquid phase, which makes it easy to automate or suitable for in situ detection.
2. Materials and methods
2.1. Materials
All oligonucleotides (P1: 5′-FITC-CGCTCCAGAGGCAGTAACCAGAGCGTTTTTTTTTT-(CH2)6-SH-3′; T1: 5′-TGGTTACCGCCTCTG-3′; ssDNA1: 5′-TGGTTACTGCCTCTG-3′; ssDNA2: 5′-CCAACCTGTCTTTCCTACG-3′; ssDNA3: 5′-AACCTGTCTTTCCTACG-3′; ssDNA4: 5′-CCTGTCTTTCCTACG -3′) were purchased from Sangon Biotech (Shanghai, China) Co. Ltd. and purified by HPLC. Deionized water was purified using a Millipore filtration system (18.2 MΩ resistivity) and used in all experiments. All the experiments were carried out in phosphate buffer saline (PBS) buffer (0.1 mM PBS, 0.1 M NaCl, pH 8.00).2.2. Instrumentation
The size distribution and structure of the AuNCs were probed by high-resolution transmission electron microscopy (HRTEM) using a JEM-2100 (HR) operating at an acceleration voltage of 200 kV. A fluorescence spectrometer (F-4600, Hitachi Co. Ltd., Japan) with a xenon lamp excitation source was employed to record fluorescence spectra. The excitation was set at 490 nm and the emission was monitored at 520 nm.2.3. Synthesis of red fluorescent AuNCs
According to the literature,44 all glassware was washed with aqua regia (HCl![[thin space (1/6-em)]](https://www.rsc.org/images/entities/char_2009.gif) :
:![[thin space (1/6-em)]](https://www.rsc.org/images/entities/char_2009.gif) HNO3 volume ratio = 3
HNO3 volume ratio = 3![[thin space (1/6-em)]](https://www.rsc.org/images/entities/char_2009.gif) :
:![[thin space (1/6-em)]](https://www.rsc.org/images/entities/char_2009.gif) 1) and rinsed with ethanol and ultrapure water (caution: aqua regia is a very corrosive oxidizing agent, which should be handled with great care). In a typical experiment, aqueous HAuCl4 solution (5 mL, 10 mM, 37 °C) was added to BSA solution (5 mL, 50 mg mL−1, 37 °C) under vigorous stirring. NaOH solution (0.5 mL, 1 M) was introduced 2 min later and the reaction was allowed to proceed under vigorous stirring at 37 °C for 12 h. The obtained suspension was centrifuged and suspended with water before further characterizations and applications.
1) and rinsed with ethanol and ultrapure water (caution: aqua regia is a very corrosive oxidizing agent, which should be handled with great care). In a typical experiment, aqueous HAuCl4 solution (5 mL, 10 mM, 37 °C) was added to BSA solution (5 mL, 50 mg mL−1, 37 °C) under vigorous stirring. NaOH solution (0.5 mL, 1 M) was introduced 2 min later and the reaction was allowed to proceed under vigorous stirring at 37 °C for 12 h. The obtained suspension was centrifuged and suspended with water before further characterizations and applications.
2.4. Fluorescence spectra measurements
The fluorescent probe P1 (10 nM) was hybridized with different amounts of T1 for 30 min in a PBS buffer solution of 195 μl, prior to the addition of the AuNCs solution (5 μl). The final concentration of T1 ranged from 0 to 60 nM. For the kinetic study of fluorescence enhancement, fluorescence spectra were recorded immediately after addition of AuNCs into P1 solution. For DNA assays, the fluorescence measurements were performed after being incubated with AuNCs for 30 min. A fluorescence spectrometer (F-4600, Hitachi Co. Ltd., Japan) with a xenon lamp excitation source was employed to record fluorescence spectra. The excitation was set at 490 nm and the emission was monitored at 520 nm.3. Results and discussion
3.1. Fluorescence enhancement between FITC-tagged ssDNA and Au nanoclusters
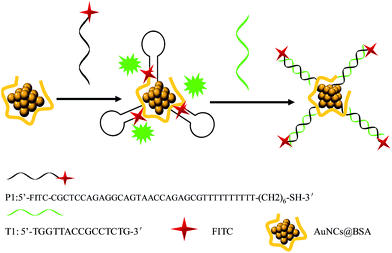
The proposed mix-and-detect strategy is depicted in Scheme 1. In our process, two important factors, the adhesion layer and the distance,45,47 between the fluorophores and AuNCs, which exert great influence on fluorescence enhancement have been examined. The crucial role of the adhesion layer in plasmonic fluorescence enhancement has been reported by Heykel Aouani's group.46 In Rizia Bardhan's report,47 Au nanoshells (NSs) and Au nanorods wrapped in human serum albumin (HSA) were used as substrates, which more effectively enhanced the fluorescence compared with pure fluorophores. HSA and bovine serum albumin (BSA) were widely used in most studies as a stabilizer and reducer to form fluorescent AuNCs. Thus, BSA was chosen in our study as the adhesion layer to protect AuNCs.44 As to the influence of the distance between the fluorophores and AuNCs on fluorescence enhancement, the ideal distance for maximum enhancement reported was 5–11 nm.47 In our study, DNA techniques were applied to adjust the distance between AuNCs and fluorophores (FITC).In our strategy, a quantitative readout of the target DNA can be realized through the following principle and process. Based on the mechanisms of metal enhancement about surface plasmon resonance enhanced energy transfer, BSA-protected Au nanoclusters can be used as the donor48 and FITC is the acceptor. When the distance between AuNCs and FITC controlled by DNA is perfect, the fluorescence of FITC is enhanced strongly. We expect that AuNCs can adsorb the dye-labeled single-stranded DNA (ssDNA, the hairpin structure) probe via the Au–S force between SH and the AuNCs and then enhance the fluorescence of the dye.41 In contrast, when a ssDNA probe is hybridized with its complementary target DNA, because the nucleobases are buried between the densely negatively charged helical phosphate backbones, the dye-labeled probe is away from the surface of AuNCs, resulting in getting rid of the fluorescence enhancement of the probe. As a result, the fluorescence of the probe is expected to provide a quantitative readout of the target DNA. In this work, protooncogene acts as the target DNA.
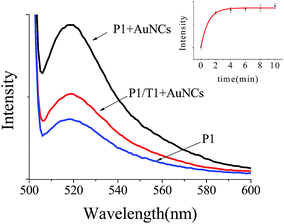
In our experiments, the AuNCs were synthesized through the reduction of chloroauric acid with bovine serum albumin (BSA) at a physiological temperature using a recently developed method44 (see Fig. S1†). The fluorescence enhancement ability of AuNCs toward the FITC-labeled ssDNA was evaluated via measurements upon mixing the fluorescent probe (FITC) and the prepared AuNCs. The FITC-labeled ssDNA probe (P1) used here is for a protooncogene aptamer. In the presence of AuNCs, the fluorescence of P1 was obviously enhanced (see the curve of P1 + AuNCs in Fig. 1). The enhancement kinetics was very fast, with up to more than 2 times fluorescence intensity obtained within 4 min after P1 was mixed with the AuNCs solution (see the curve of P1 + AuNCs in the inset of Fig. 1), which suggested that the interaction between FITC and AuNCs is quite strong and the AuNCs possesses a high fluorescence enhancement ability. In addition, temperature from 20 °C to 35 °C has a little effect on fluorescence enhancement of FITC (see Fig. 2).
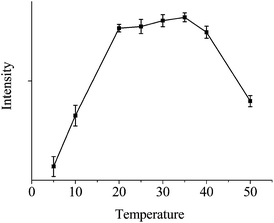 | ||
| Fig. 2 Temperature dependences of the FITC fluorescence intensity (enhanced fluorescence spectra of 10 nM P1 in the presence of AuNCs at 5, 10, 20, 25, 30, 35, 40 and 50 °C). | ||
Considering that the fluorescence stability is highly pH dependent, we studied the effects of pH on the fluorescence enhancement. According to Fig. 3, enormous changes of fluorescence of FITC with different pH values from 5.5 to 10.0 have occurred. According to previous reports, this is caused by the alternation of the fluorescein structure between lactone and open loop tautomerism with different pH values. Under alkaline conditions, lactone is the main form and two hydroxide radicals will have a certain degree of take off (with weak fluorescence). Under acidic conditions, the main form is open loop (neutral molecules or proton, and weak fluorescence). Thus, when the pH value increases, the fluorescence of FITC gets enhanced. Taking into account the effect of different pH values on the fluorescence intensity (above) and Hoogsteen base pairing, 8 is the best suitable pH value.
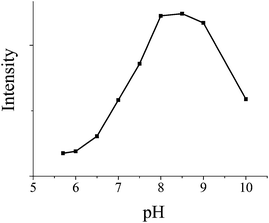 | ||
| Fig. 3 The pH (pH 5.5, 6.0, 7.0, 7.5, 8.0, 8.5, 9.0 and 10) dependences of the FITC fluorescence intensity (fluorescence spectra of 10 nM P1 in the presence of AuNCs). | ||
When the distance between FITC-labeled ssDNA and AuNCs is too wide, the fluorescence would decrease. It is known that the fluorescence can be significantly enhanced when P1 is mixed with AuNCs. However, when P1 was hybridized with an equal amount of the complementary target DNA T1 to form dsDNA, the P1/T1 duplex, the fluorescence largely decreased (see the curve of P1/T1 + AuNCs in Fig. 1). This was because the distance between FITC-labeled ssDNA and AuNCs was widened when T1 was added. The result confirmed the influence of the distance between FITC and AuNCs on the fluorescence enhancement intensity.
On the basis of the aforementioned findings, by adjusting the distance between FITC and AuNCs and keeping the pH value at the ideal level, a sensing platform for quantitative DNA assay can be built using AuNCs with high fluorescence enhancement ability.
3.2. Assay for protooncogene in aqueous buffer
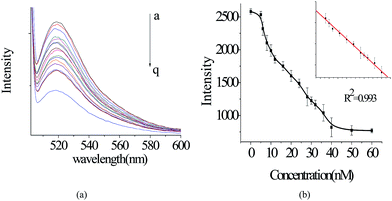
In the experiment to determine the linear range of our DNA sensor, 10 nM of P1 was hybridized with T1 at various concentrations at room temperature for 30 min, and then the mixture was incubated with an aliquot of AuNC solution. As the concentration of T1 increased, the percentage of P1 hybridized with T1 to form a duplex also increased. As a result, the enhanced fluorescence of P1 decreased (Fig. 4a). Note that the fluorescence could still decrease when the concentration of T1 exceeded that of P1. This might result from the absorption of T1 by AuNCs, which stopped part of T1 from being formed into the P1/T1 duplex. On the basis of Fig. 4b, this DNA sensor shows a linear range between 8 and 40 nM (R2 = 0.992), with a detection limit of 4 nM (3 times the standard deviation rule), which is simple and homogeneous.3.3. Selectivity assays
In addition, control experiments were conducted to confirm that the decreased fluorescence was due to the specific DNA structural switching. Four other types of mismatch ssDNA were systemically studied using the same assay protocol. However, none of the four analogues could induce the distinct fluorescence decrease, even at a very high concentration (10 uM), as compared to the P1 sample (Fig. 5). This result has proven that the described mix-and-detect assay is highly selective toward protooncogene.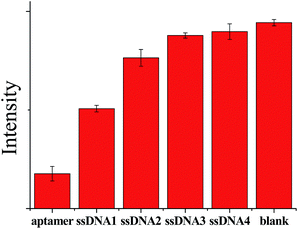 | ||
| Fig. 5 Selectivity of the AuNC-based protooncogene sensor over ssDNA1, ssDNA2, ssDNA3, ssDNA4 and blank sample (each 10 μM). Excitation and emission wavelengths are 490 and 520 nm, respectively. | ||
4. Conclusions
In conclusion, for the first time, we have revealed that when kept within a certain distance with FITC and when the pH value is suitable, AuNCs possesses high fluorescence enhancement efficiency. Inspired by these findings, we employed AuNCs in the construction of a sensing platform for the quantitative detection of specific DNA. This mix-and-detect assay format is simple. Importantly, the assay is homogeneous because it occurs exclusively in the liquid phase, which makes it easy to automate or suitable for in situ detection. In addition, AuNCs can be readily synthesized on a large scale and used as efficient fluorescence enhancement nanomaterials without further processing. What is worth mentioning is that aptamers in vitro selected nucleic acid molecules with high specificity and affinity toward a wide spectrum of targets49 are widely recognized as promising candidates for biosensing due to their intrinsic advantages.50,51 Besides the DNA hybridization, specific aptamer-target recognition can induce dramatic structural switching of the DNA probe.52 Combined with the use of assorted aptamers, the ability of AuNCs to discriminate specific DNA could offer a new approach to detect a broad range of analytes. What is not neglectable is the high fluorescence of the AuNCs itself which allows it to be widely used in the emerging multiplex fluorescence imaging in biological applications in the near future. With these remarkable advantages, we believe that this work provides opportunities to develop simple, rapid, and low-cost nanoprobes for molecular diagnostics.Acknowledgements
We gratefully acknowledge the support from the Natural Science Foundation of China (NSFC) (no. 20927003, 90913013, 41273093 and 21175101), the National Major Scientific Instruments and Device Development Project (2012YQ16000701) and the Foundation of China Geological Survey (Grant no. 12120113015200).References
- J. H. Warner, A. Hoshino, K. Yamamoto and R. Tilley, Angew. Chem., Int. Ed., 2005, 117, 4626–4630 CrossRef.
- S. F. Lim, R. Riehn, C.-K. Tung, W. S. Ryu, R. Zhuo, J. Dalland and R. H. Austin, Nanotechnology, 2009, 20, 405701 CrossRef PubMed.
- S.-Y. Liu, L. Huang, J.-F. Li, C. Wang, Q. Li, H.-X. Xu, H.-L. Guo, Z.-M. Meng, Z. Shi and Z.-Y. Li, J. Phys. Chem. C, 2013, 117, 10636–10642 CAS.
- Y. Bao, C. Zhong, D. M. Vu, J. P. Temirov, R. B. Dyer and J. S. Martinez, J. Phys. Chem. C, 2007, 111, 12194–12198 CAS.
- B. Yang, N. Lu, D. Qi, R. Ma, Q. Wu, J. Hao, X. Liu, Y. Mu, V. Reboud and N. Kehagias, Small, 2010, 6, 1038–1043 CrossRef CAS PubMed.
- K. Aslan, M. Wu, J. R. Lakowicz and C. D. Geddes, J. Am. Chem. Soc., 2007, 129, 1524–1525 CrossRef CAS PubMed.
- J. Zhang and J. R. Lakowicz, Opt. Express, 2007, 15, 2598–2606 CrossRef CAS.
- P. K. Jain, W. Huang and M. A. El-Sayed, Nano Lett., 2007, 7, 2080–2088 CrossRef CAS.
- P. K. Jain and M. A. El-Sayed, J. Phys. Chem. C, 2008, 112, 4954–4960 CAS.
- W. Huang, W. Qian, P. K. Jain and M. A. El-Sayed, Nano Lett., 2007, 7, 3227–3234 CrossRef CAS PubMed.
- M. Mahmoud and M. El-Sayed, J. Phys. Chem. C, 2007, 111, 17180–17183 CAS.
- P. K. Jain, K. S. Lee, I. H. El-Sayed and M. A. El-Sayed, J. Phys. Chem. B, 2006, 110, 7238–7248 CrossRef CAS PubMed.
- P. K. Jain, X. Huang, I. H. El-Sayed and M. A. El-Sayed, Plasmonics, 2007, 2, 107–118 CrossRef CAS.
- Q. C. Sun, H. Mundoor, J. C. Ribot, V. Singh, I. I. Smalyukh and P. Nagpal, Nano Lett., 2013, 14, 101–106 CrossRef PubMed.
- T. V. Shahbazyan, Nano Lett., 2012, 13, 194–198 CrossRef PubMed.
- J. Yoo, X. Ma, W. Tang and G.-C. Yi, Nano Lett., 2013, 13, 2134–2140 CrossRef CAS PubMed.
- L. Zhao, T. Ming, L. Shao, H. Chen and J. Wang, J. Phys. Chem. C, 2012, 116, 8287–8296 CAS.
- M. Lunz, V. A. Gerard, Y. K. Gun'ko, V. Lesnyak, N. Gaponik, A. S. Susha, A. L. Rogach and A. L. Bradley, Nano Lett., 2011, 11, 3341–3345 CrossRef CAS PubMed.
- C. C. Chang, Y. D. Sharma, Y. S. Kim, J. A. Bur, R. V. Shenoi, S. Krishna, D. Huang and S.-Y. Lin, Nano Lett., 2010, 10, 1704–1709 CrossRef CAS PubMed.
- S. Jin, E. DeMarco, M. J. Pellin, O. K. Farha, G. P. Wiederrecht and J. T. Hupp, J. Phys. Chem. Lett., 2013, 4, 3527–3533 CrossRef CAS.
- M. J. Previte, K. Aslan, Y. Zhang and C. D. Geddes, J. Phys. Chem. C, 2007, 111, 6051–6059 CAS.
- M. Banik, P. Z. El-Khoury, A. Nag, A. Rodriguez-Perez, N. Guarrottxena, G. C. Bazan and V. A. Apkarian, ACS Nano, 2012, 6, 10343–10354 CrossRef CAS PubMed.
- L.-B. Zhao, M. Zhang, Y.-F. Huang, C. T. Williams, D.-Y. Wu, B. Ren and Z.-Q. Tian, J. Phys. Chem. Lett., 2014, 5, 1259–1266 CrossRef CAS.
- W. M. Leevy, S. T. Gammon, H. Jiang, J. R. Johnson, D. J. Maxwell, E. N. Jackson, M. Marquez, D. Piwnica-Worms and B. D. Smith, J. Am. Chem. Soc., 2006, 128, 16476–16477 CrossRef CAS PubMed.
- K. Aslan, J. R. Lakowicz and C. D. Geddes, J. Phys. Chem. B, 2005, 109, 6247–6251 CrossRef CAS PubMed.
- K. Aslan, Z. Leonenko, J. R. Lakowicz and C. D. Geddes, J. Phys. Chem. B, 2005, 109, 3157–3162 CrossRef CAS PubMed.
- J. Chen, Y. Jin, N. Fahruddin and J. X. Zhao, Langmuir, 2013, 29, 1584–1591 CrossRef CAS PubMed.
- M. Ganguly, A. Pal, Y. Negishi and T. Pal, Langmuir, 2013, 29, 2033–2043 CrossRef CAS PubMed.
- L. Shang and G. U. Nienhaus, Biophys. Rev., 2012, 4, 313–322 CrossRef CAS.
- Y. Wang, J. Chen and J. Irudayaraj, ACS Nano, 2011, 5, 9718–9725 CrossRef CAS PubMed.
- H. Qian, M. Zhu, Z. Wu and R. Jin, Acc. Chem. Res., 2012, 45, 1470–1479 CrossRef CAS PubMed.
- J. M. Liu, J. T. Chen and X. P. Yan, Anal. Chem., 2013, 85, 3238–3245 CrossRef CAS PubMed.
- F. Wen, Y. Dong, L. Feng, S. Wang, S. Zhang and X. Zhang, Anal. Chem., 2011, 83, 1193–1196 CrossRef CAS PubMed.
- B. Paramanik and A. Patra, J. Mater. Chem. C, 2014, 2, 3005–3012 RSC.
- H. Dai, Y. Shi, Y. Wang, Y. Sun, J. Hu, P. Ni and Z. Li, Biosens. Bioelectron., 2014, 53, 76–81 CrossRef CAS PubMed.
- J.-a. Annie Ho, H.-C. Chang and W.-T. Su, Anal. Chem., 2012, 84, 3246–3253 CrossRef CAS PubMed.
- Y.-H. Lin and W.-L. Tseng, Anal. Chem., 2010, 82, 9194–9200 CrossRef CAS PubMed.
- D. Hu, Z. Sheng, P. Gong, P. Zhang and L. Cai, Analyst, 2010, 135, 1411–1416 RSC.
- M. Zhang and B.-C. Ye, Analyst, 2011, 136, 5139–5142 RSC.
- H. Liu, X. Zhang, X. Wu, L. Jiang, C. Burda and J.-J. Zhu, Chem. Commun., 2011, 47, 4237–4239 RSC.
- M.-L. Cui, J.-M. Liu, X.-X. Wang, L.-P. Lin, L. Jiao, L.-H. Zhang, Z.-Y. Zheng and S.-Q. Lin, Analyst, 2012, 137, 5346–5351 RSC.
- V. Venkatesh, A. Shukla, S. Sivakumar and S. Verma, ACS Appl. Mater. Interfaces, 2014, 6, 2185–2191 CAS.
- Z. Wu and R. Jin, Nano Lett., 2010, 10, 2568–2573 CrossRef CAS PubMed.
- J. Xie, Y. Zheng and J. Y. Ying, J. Am. Chem. Soc., 2009, 131, 888–889 CrossRef CAS PubMed.
- X. Zhang, C. A. Marocico, M. Lunz, V. A. Gerard, Y. K. Gun'ko, V. Lesnyak, N. Gaponik, A. S. Susha, A. L. Rogach and A. L. Bradley, ACS Nano, 2014, 8, 1273–1283 CrossRef CAS PubMed.
- H. Aouani, J. Wenger, D. Gérard, H. Rigneault, E. Devaux, T. W. Ebbesen, F. Mahdavi, T. Xu and S. Blair, ACS Nano, 2009, 3, 2043–2048 CrossRef CAS PubMed.
- R. Bardhan, N. K. Grady, J. R. Cole, A. Joshi and N. J. Halas, ACS Nano, 2009, 3, 744–752 CrossRef CAS PubMed.
- S. Raut, R. Rich, R. Fudala, S. Butler, R. Kokate, Z. Gryczynski, R. Luchowski and I. Gryczynski, Nanoscale, 2014, 6, 385–391 RSC.
- D. S. Wilson and J. W. Szostak, Annu. Rev. Biochem., 1999, 68, 611–647 CrossRef CAS PubMed.
- J. Liu, Z. Cao and Y. Lu, Chem. Rev., 2009, 109, 1948–1998 CrossRef CAS PubMed.
- S. Song, L. Wang, J. Li, C. Fan and J. Zhao, Trends Anal. Chem., 2008, 27, 108–117 CrossRef CAS PubMed.
- D. Li, S. Song and C. Fan, Acc. Chem. Res., 2010, 43, 631–641 CrossRef CAS PubMed.
Footnote |
| † Electronic supplementary information (ESI) available. See DOI: 10.1039/c4ay02117g |
| This journal is © The Royal Society of Chemistry 2015 |

