
 Open Access Article
 This Open Access Article is licensed under a Creative Commons Attribution-Non Commercial 3.0 Unported Licence
Accurate assessment of liver steatosis in animal models using a high throughput Raman fiber optic probe
Kevin C.
Hewitt
*a,
Javad
Ghassemi Rad
ab,
Hanna C.
McGregor
d,
Erin
Brouwers
b,
Heidi
Sapp
ce,
Michael A.
Short
d,
Samia B.
Fashir
a,
Haishan
Zeng
d and
Ian P.
Alwayn
b
aDepartment of Physics and Atmospheric Sciences, Dalhousie University, Halifax, Nova Scotia, Canada B3H 4R2. E-mail: Kevin.Hewitt@Dal.ca; Tel: 1-902-494-2315
bAtlantic Center for Transplant Research, Department of Surgery, Dalhousie University, Halifax, Nova Scotia, Canada
cQEII Health Sciences Centre, 1276 South Park St., Halifax, NS, Canada B3H 2Y9
dBC Cancer Agency Research Centre, Imaging Unit – Integrative Oncology, Vancouver, BC, Canada V5Z 1L3
eDepartment of Pathology, Dalhousie University, Halifax, Nova Scotia, Canada
First published on 18th August 2015
Abstract
Due to the shortage of healthy donor organs, steatotic livers are commonly used for transplantation, placing patients at higher risk for graft dysfunction and lower survival rates. Raman Spectroscopy is a technique which has shown the ability to rapidly detect the vibration state of C–H bonds in triglycerides. The aim of this study is to determine whether conventional Raman spectroscopy can reliably detect and quantify fat in an animal model of liver steatosis. Mice and rats fed a methionine and choline-deficient (MCD) and control diets were sacrificed on one, two, three and four weeks’ time points. A confocal Raman microscope, a commercial Raman (iRaman) fiber optic probe and a highly sensitive Raman fiber optic probe system, the latter utilizing a 785 nm excitation laser, were used to detect changes in the Raman spectra of steatotic mouse livers. Thin layer chromatography was used to assess the triglyceride content of liver specimens, and sections were scored blindly for fat content using histological examination. Principal component analysis (PCA) of Raman spectra was used to extract the principal components responsible for spectroscopic differences with MCD week (time on MCD diet). Confocal Raman microscopy revealed the presence of saturated fats in mice liver sections. A commercially available handheld Raman spectroscopy probe could not distinguish the presence of fat in the liver whereas our specially designed, high throughput Raman system could clearly distinguish lobe-specific changes in fat content. In the left lobe in particular, the Raman PC scores exhibited a significant correlation (R2 = 0.96) with the gold standard, blinded scoring by histological examination. The specially designed, high throughput Raman system can be used for clinical purposes. Its application to the field of transplantation would enable surgeons to determine the hepatic fat content of the donor's liver in the field prior to proceeding with organ retrieval. Next steps include validating these results in a prospective analysis of human liver transplantation implant biopsies.
1. Introduction
Hepatic steatosis, also known as non-alcoholic fatty liver disease (NAFLD), is a common condition characterized by excessive accumulation of triglycerides within hepatocytes.1,2 In general, steatosis is considered pathologic when fat accumulation exceeds 5% of the actual liver weight,1 a condition that might evolve into non-alcoholic steatohepatitis (NASH), fibrosis and even cirrhosis or liver failure.2,3Transplantation represents the ultimate treatment for end-stage liver disease. One of the strategies implemented to increase the number of donor organs and reduce wait times is the use of extended criteria organs of which steatotic livers comprise a major proportion.4–6 Unfortunately, transplanted steatotic livers are more prone to ischemia reperfusion injury (IRI) when compared to non-steatotic livers, and also exhibit higher rates of allograft dysfunction and reduced overall survival.7 Hepatic steatosis, however, is not always a contraindicator for transplantation.8 These challenges and opportunities highlight the need for reliable and objective means to assess, at the site of retrieval, the suitability of donor livers prior to transplantation.
A variety of imaging modalities such as computed tomography (CT), ultrasonography (US), magnetic resonance imaging (MRI), and positron emission tomography (PET) have been evaluated for their ability to measure the hepatic fat content.9 CT and US appear to lack the necessary sensitivity and selectivity to accurately quantify hepatic fat content.9 Although MRI has shown reliable quantitative measurements of hepatic steatosis,10 it is considered costly and not universally available. A liver biopsy is still considered the gold standard for determining the degree of hepatic steatosis, but the expertise to interpret these biopsies at the time of organ retrieval is often not readily available. Therefore, there is a pressing need for convenient and simple techniques to better assess hepatic fat content prior to transplantation.
Raman spectroscopy is an inelastic light scattering technique that is sensitive to molecular vibrations, the symmetry and frequencies of which are unique to the type of atoms and their spatial arrangement. Sensitivity to these properties is the basis of its ability to provide a spectral fingerprint of molecules in the illuminated region. It has been used to detect amino acids, nucleotide bases, fatty acids, saccharides, primary metabolites, and other constituents that form the protein, carbohydrates, fats and DNA/RNA of biological tissues.11,12 A recent review of the principal Raman techniques applied to biomedical systems13 highlight its potential for quantitative analysis of biomolecular species. It is an attractive technology for bioanalysis because no sample preparation is required, and unlike IR absorption the signal from water can be isolated to a very narrow spectral range. A wide variety of lipid containing systems have been investigated,14–16 including the study of liver steatosis.17–19 The content of hepatic fat, as measured by Coherent Anti-Stokes Raman spectroscopy (CARS), was shown by Wu et al.17 to be strongly correlated (R2 = 0.89) with that determined by biochemical analysis, over a pathologically significant range of hepatic fat content (2%–20% of the total tissue mass). These results were based on the relative strength of the symmetric stretching mode of the C–H bond in –CH2 found at 2864 cm−1. Adkins et al.18 also used CARS to visualize fat droplets in mice fed a diet containing conjugated linoleic acid (CLA) to induce insulin resistance in a novel NASH mice model. Using a confocal Raman system, 488 and 532 nm laser excitation, and 3D mapping, Majzner et al.19 was able to characterize the degree of saturation of lipid droplets in hepatocytes of mice fed a high fat diet consisting of 60% calories from saturated fat. A 2014 review20 of the use of CARS, and a related technique called Stimulated Raman Spectroscopy (SRS) in understanding lipid function point out that the techniques are not very cost-effective, because of the use of multi-photon laser scanning microscopy, ultra-fast pulsed laser and optical parametric oscillators (OPOs). Previous attempts using conventional Raman spectroscopy utilized subtraction programs to reduce the fluorescence background of the spectrum in order to analyze the triglyceride content in algae15 and milk.16 Huang et al.15 also reported that the use of 785 nm wavelength excitation greatly reduces the fluorescence background. While CARS/SRS is able to eliminate the laborious procedures required by traditional histopathological examination or biochemical analysis, it remains a technique that requires a dedicated system in a hospital at a cost of at least five hundred thousand US dollars, and the preparation of tissue sections. A conventional fiber-optic Raman system is cheaper but none have been shown to provide the sensitivity and specificity required for liver steatosis assessment. A complete conventional fiber optic Raman system including continuous laser is about $65![[thin space (1/6-em)]](https://www.rsc.org/images/entities/char_2009.gif) 000, and critically, is smaller, portable, robust and enables in situ scans of bulk tissue to be undertaken with very little experience required of the operator. A fibre-optic based Raman probe therefore takes full advantage of the quantification strengths of Raman spectroscopy without the limitations of CARS/SRS microscopy. We report on the use of a high-sensitivity endoscopic Raman fiber probe system which provides a measurement of steatosis that is highly correlated (0.96) with a pathologist’ rating, the gold standard.
000, and critically, is smaller, portable, robust and enables in situ scans of bulk tissue to be undertaken with very little experience required of the operator. A fibre-optic based Raman probe therefore takes full advantage of the quantification strengths of Raman spectroscopy without the limitations of CARS/SRS microscopy. We report on the use of a high-sensitivity endoscopic Raman fiber probe system which provides a measurement of steatosis that is highly correlated (0.96) with a pathologist’ rating, the gold standard.
Steatosis was induced in mice and rat livers by using a diet deficient in methionine and choline (MCD), and quantified using accepted biochemical analysis techniques, pathologist rating, and conventional Raman spectroscopy. Micro-Raman and commercial fiber-optic Raman systems were used along with a specially designed high-throughput one. We used the near infrared (NIR) excitation wavelength to minimize the fluorescent background, and improve the penetration depth of the laser while reducing the possibility of tissue damage. The level of steatosis was dependent on the lobe examined. The pathologist rating was highly correlated (0.96) with the scores obtained from Raman spectroscopy for the left lobe, whose response to the induction of steatosis mimics that of the human liver.21,22
2. Experimental
2.1 Animals and experimental design
Adult male Lewis rats (n = 15) weighing 200–225 g and male C57BL/6 mice (n = 12) obtained from Charles River (Wilmington, MA) were housed in an animal care facility (Dalhousie University) with a 12 hour light/dark photoperiod under standard environmental conditions. Animals had ad libitum access to laboratory chow and drinking water and were allowed to acclimatize to their new laboratory environment and food for a week prior to the study. All experiments using animals were conducted in an ethical and humane manner, following the guidelines of the Dalhousie University Committee on Laboratory Animals (UCLA), as approved under protocol number 14-070.Animals were arbitrarily placed in either the experimental (rats n = 10, mice n = 8) or the control (rats n = 5, mice n = 4) group. Experimental animals were fed a methionine–choline deficient, MCD, diet (Harlan Laboratories, Madison WI Cat# 90262) to induce hepatic steatosis. The controls were fed an amino acid control diet (Cat # 94149). Animals were provided with two pellets of food of their designated diets every two to three days. Three rats and three mice were sacrificed at each of one, two, three, four, and five weeks post introduction of diets. At each time point two MCD animals (rats n = 2, mice n = 2) and one-amino acid control animal (rats n = 1, mice n = 1) were anaesthetized using isofluorane inhalation (setting 2–3 at 1 L O2 per minute). Once surgical plane anaesthesia was confirmed by toe pinch, maintenance was achieved with an isofluorane flow rate of 1.5–2% and oxygen flow rate of 1 L min−1. For liver harvesting the abdomen was shaved and prepped with 70% alcohol. A vertical thoraco-abdominal incision (chest and abdomen) was made exposing the heart and liver. Following abdominal penetration, the handheld iRaman spectrometer was applied to mice livers for in vivo analysis. Then the whole liver was removed and placed in a petri dish for ex vivo Raman analysis. Rat livers were removed and cut into mm sized pieces. The animals were finally euthanized by cardiac puncture and exsanguination while still under anaesthesia. Rat and mice bulk liver lobes (a few mm on each side) were sent to the BC Cancer Agency Research Centre (BCCARC), for macro Raman analysis by an endoscopic Raman spectroscopy system and tissue samples were also sent for histological analysis and confocal Raman spectroscopy in Dalhousie.
2.2 Handheld iRaman spectroscopy
The handheld iRaman spectrometer (B&W TEK Inc., Newark, NJ) was equipped with a 785 nm excitation laser, front-illuminated CCD detector thermoelectrically cooled to 14 °C, with a maximum quantum efficiency of 40%, and laser power range of 3 mW–300 mW. The spectral range of the iRaman was 175 cm−1–3200 cm−1 with a resolution of 5 cm−1. The iRaman was connected to a computer with a USB cable, and the software BWSpec 3.27 (B&W TEK., Newark, DE) was used to obtain Raman spectra. To measure the reference spectrum, the iRaman probe, covered by saran wrap, was held on Palmitic Acid powder (Sigma-Aldrich, product# 286907) at a distance of ∼5.5 mm. The standard palmitic acid spectrum was used to observe the strong Raman signal at ∼2846 cm−1, which corresponds to the symmetric stretching mode of C–H bond in –CH2 molecular structure that is also present in the triglyceride of hepatic cells. Data from the mouse liver was collected in the surgery room by holding the liver at approximately 5.5 mm for both in vivo and ex vivo analysis.2.3 Confocal micro-Raman spectroscopy
The Raman spectra of fat droplets of randomly chosen liver tissue were recorded using a T64000 confocal Raman microscope (Horiba Jobin-Yvon). The microscope was powered with an Argon ion laser operating either with 458 nm or 514.5 nm excitation wavelengths. The laser light was focused through a 100× objective lens onto the sample to a diffraction limited spot size of about 1 micron. The scattered light was collected with the same lens and after eliminating the laser light with a long pass filter, it was dispersed with an 1800 g mm−1 or 150 g mm−1 grating onto a liquid nitrogen cooled charged-coupled device (CCD) detector. A section of the liver slice (5 μm thick) was chosen at random and placed under the Raman microscope. The section was initially tested for the signal at 2864 cm−1 and then the same area was tested for the fingerprint region (1000–1800 cm−1). Areas selected on the samples were measured with acquisition times of 10 s (5 s) averaged over 10 (5) accumulations, with 458 nm (514.5 nm) laser excitation. Each map consist of a 5 μm × 5 μm area sampled at 1 μm steps, comprising 25 spectra.2.4 Endoscopic macro-Raman spectroscopy
Frozen bulk liver lobes (a few mm on each side) were sent to the BCCARC (BC Cancer Agency Research Centre, BC, Canada) to measure Raman spectra using an endoscopic Raman spectroscopy system. This custom Raman system, developed at the BCCARC, was equipped with excitation of 785 nm and 300 mW stabilized diode laser (BRM – 785 B&W TEK). The spectral range of the system was set at 1900–3100 cm−1 and the dispersed light from the sample was analyzed with a back-illuminated, deep depletion CCD detector with 400 × 1340 pixels. A 0.75 m long probe with diameter of 1.8 mm, a central fibre 200 μm in diameter for excitation surrounded by 27 fibres 100 μm in diameter for collection, was placed on the bulk liver lobes for analysis. Proprietary technology was employed to correct the spectrograph image aberration to achieve the best signal to noise ratio rapid Raman spectral acquisition reported in the literature.23,24 The 200 μm diameter excitation fibre has a numerical aperture of 0.22, and its end was held approximately 5 mm above the sample. Consequently, the diameter of the 150 mW excitation spot on the tissue surface was 2.25 mm. The laser penetrates approximately to 1 mm in depth in tissue and laterally, by about 0.5 mm more than the diameter of the excitation spot at its widest point. The shape of the illuminated volume is approximated as an oblate spheroid, resulting in a total sampling volume of 4.0 mm3.2.5 Biochemical analysis – lipid extraction and thin-layer chromatography
Liver tissues were excised from each lobe of liver and homogenized. Lipids were extracted according to Hildebrandt et al.25 Briefly, 1 part homogenate was mixed with 4 parts methanol (CHCl3:MeOH) 1:2 (v/v) with continuous agitation at room temperature for 3 hours. Mixtures were centrifuged at 3000 rpm for 10 minutes after which the supernatant were transferred. CHCl3 (1 ml) and KCl (1 ml) were added, followed by an additional centrifugation at 3000 rpm for 10 minutes. Lower-phase extracts were dried down under N2 gas and re-suspended in 60–70 μL of CHCL3:MeOH (1:1).
Thin-layer chromatography (TLC) was used to separate neutral lipid classes and measure lipid content in rat liver tissue. Samples were loaded onto HPTLC plates in 5 mm wells. Lipids were separated using n-hexane/diethyl ether/acetic acid (70:30:1) after which they were air-dried and dipped into 8% (w/v) H3PO4 containing 10% copper(II) sulphate pentahydrate. Plates were baked for 15 minutes at 180 °C, scanned and the lipid concentration was subsequently measured by densitometry. TLC results of liver tissues were compared to standards such as triolein, pentadecanoin and stearic acid that were dissolved in CHCl3. Results are reported as milligrams of triglycerides per gram of liver.
2.6 Histological examination
Liver sections (5 μm thick) from week 4 MCD fed and control rats were fixed in 10% formalin overnight then washed with 70% ethanol and sent to the histology laboratory (11G1, Sir Charles Tupper building, Dalhousie University) for tissue processing. Paraffin-embedded liver tissues were then cut into thin sections using a Microtome and stained with haematoxylin and eosin (H&E stain) and Oil Red O stains. Prepared slides were examined under the light microscope (10× objective). A hepato-pathologist viewed the slides and scored the tissue samples for steatosis using the following, standard criteria: 0: absent; 1: mild; 2: moderate, and 3: severe and mixed (mix of two or more classifications). The pathologist was blind to the experimental groups.2.7 Statistical analysis of Raman spectra
The raw Raman spectra have to be standardized before they can be analyzed or compared with published spectra.26 The usual procedure is to subtract the dark signal from the raw data of each spectrum, calibrate for the wavelength-dependent sensitivity of the system, smooth the spectra and finally, remove the underlying fluorescence with a modified 5th order polynomial.27 However removing the underlying fluorescence from the sample in this way led to artefacts in the processed Raman spectra due to its complex shape. To overcome this problem the underlying fluorescence was minimized by converting the calibrated and smoothed raw spectra into 2nd order derivative spectra with a Savitzky–Golay six-point quadratic polynomial.28–30 Normalization of the spectra was required to account for any fluctuations in laser power or differences in probe to sample distance. This was accomplished by summing the squared derivative values of a spectrum and then dividing each variable in the spectrum by this sum. The complete data set of 2nd order derivative spectra were then analyzed using statistical software (Statistica 6.0, StatSoft Inc. Tulsa, OK). Multivariate statistics were used which compare whole spectra rather than single Raman peaks (univariate) as these have been shown be more accurate.31 Principal components (PCs) for all the spectra were computed to reduce the number of variables. This was followed by a linear discrimination analysis (LDA) with leave-one-out cross validation on single, or groups of, PCs that individually accounted for 0.1% or more of the variance.3. Results and discussion
3.1 Experiments using mice
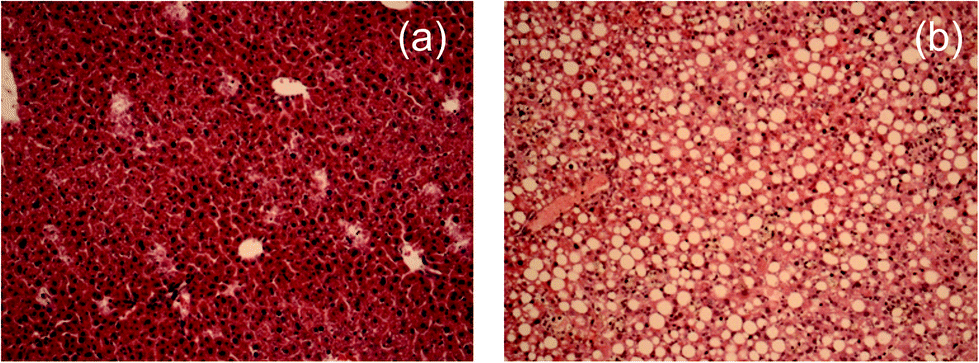 | ||
| Fig. 1 Images of H&E stained liver sections from representative mice fed four weeks after consuming a standard (a) or (b) MCD diet. In (b) macrovesicular steatosis of mouse hepatocytes can be seen, characterized by large fat droplets displacing the nuclei towards the periphery of the cells (H&E, 10×). | ||
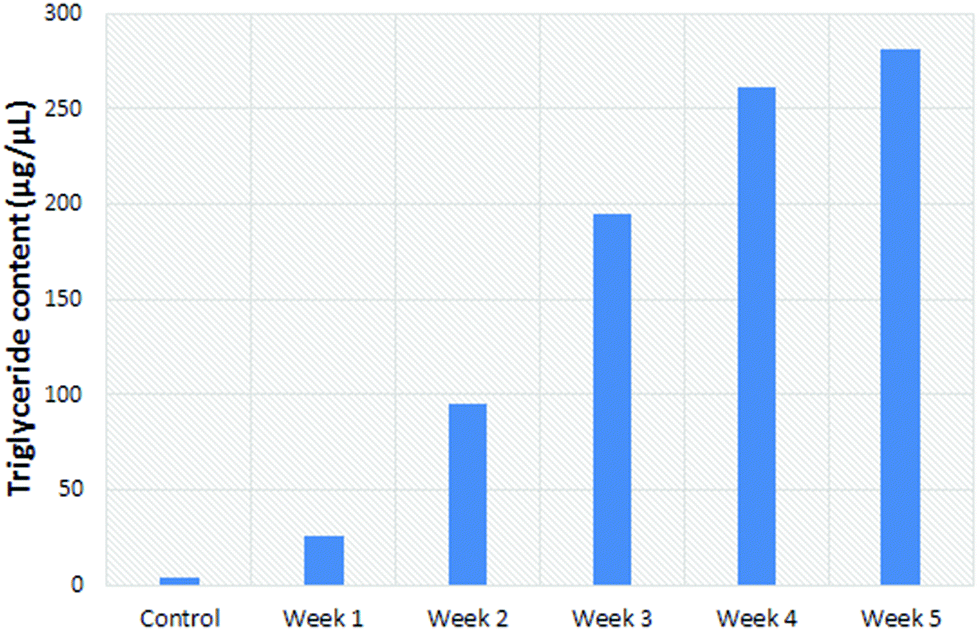
Since steatosis in human liver tissue exhibit changes similar to the left lobe of mice and rats, it was used as the more reliable comparator to steatosis in humans. It has been shown to appear in this lobe in a homogeneous manner.17 As such, results from the left lobe are presented. The triglyceride content in the liver consistently increased over time, from 7.5% at week two to 25% of the mass of the liver at the 4 week time point (Fig. 2).
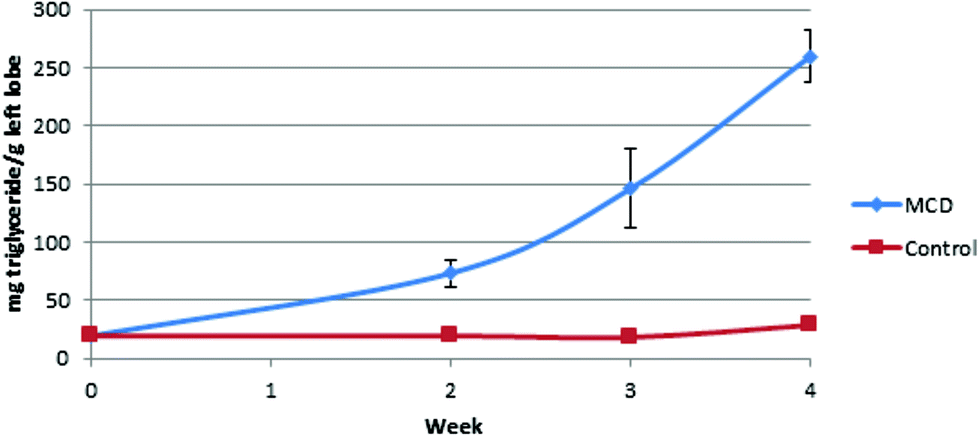 | ||
| Fig. 2 The average triglyceride content (mg g−1) in the left lobe of MCD (n = 10) and control (n = 5) mice over the duration of the experiment. | ||
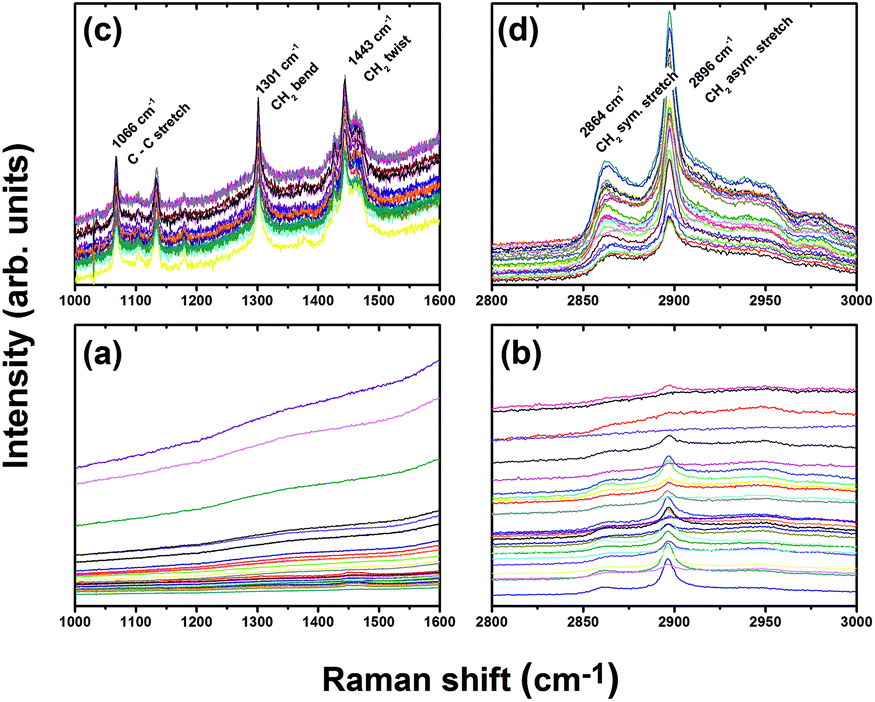 | ||
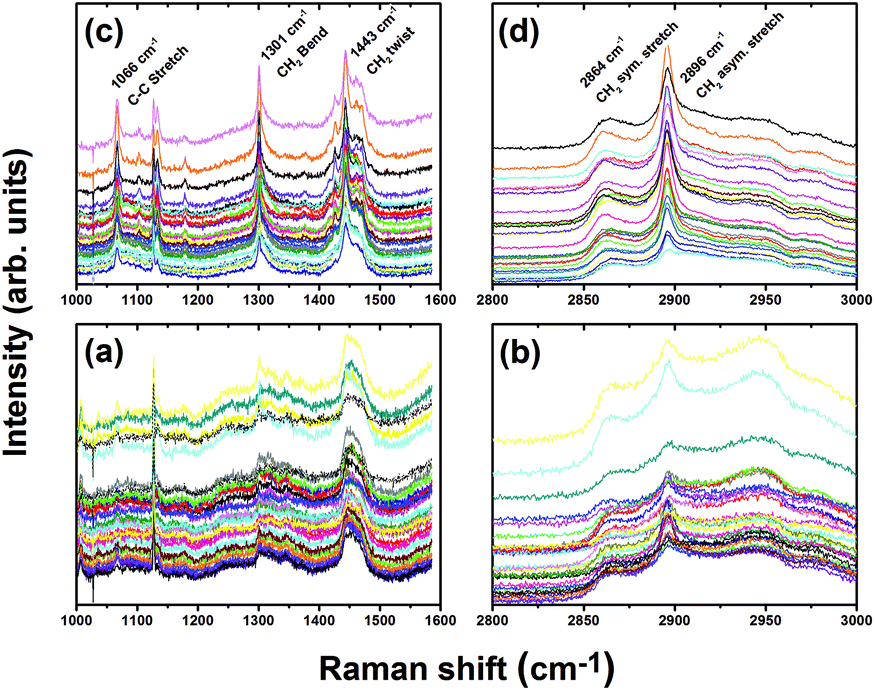
| Fig. 3 Raman spectra from control (a and b) and fatty (c and d) liver tissue sections in the low (a and c) and high (b and d) frequency spectral region using 458 nm excitation, a 100× objective resulting in a ∼1 μm spot diameter, 5 s collection time averaged over 5 scans using a laser power of 2.75 mW at the sample. Each spectrum corresponds to a different point on the liver section. | ||
 | ||
| Fig. 4 Raman spectra of the control (a and b) and fatty (c and d) liver tissue in the high (b and d) and low (a and c) spectral region using 514.5 nm excitation, 100× objective resulting in a ∼1 μm spot diameter, 10 s collection time averaged over 10 scans using a laser power of 3.65 mW at the sample. Each spectrum corresponds a different point on the chosen area on the liver slice. | ||
The same procedure was repeated using 514.5 nm excitation. The spectra shown in Fig. 4 exhibits modes at 2864 cm−1 and 2896 cm−1 due to C–H symmetric and asymmetric stretch vibrations, respectively, for both fatty and control livers. Our ability to observe Raman spectra in the latter case was likely due to a reduction in fluorescence when using lower energy 514.5 nm excitation. In the fingerprint region, spectra produced with 514.5 nm excitation also revealed three peaks due to the C–C stretching mode (1066 cm−1), CH2 twisting mode (1301 cm−1), and CH2 bending mode (1443 cm−1) for the fatty liver, with higher intensities compared to the control liver. The fact that vibrations associated with double-bonded carbon are absent, such as the ![[double bond, length as m-dash]](https://www.rsc.org/images/entities/char_e001.gif) C–H in-plane bend (∼1259 cm−1) and C–H stretch (∼3012 cm−1) modes implies that the lipids present in the illuminated volume (about 1 μm3) are fully saturated.19 Moreover, because the spectra are highly reproducible at random points in the cytoplasm of the hepatocytes, the majority of cells must contain saturated fats as seen in the H&E liver sections (Fig. 1(b)).
C–H in-plane bend (∼1259 cm−1) and C–H stretch (∼3012 cm−1) modes implies that the lipids present in the illuminated volume (about 1 μm3) are fully saturated.19 Moreover, because the spectra are highly reproducible at random points in the cytoplasm of the hepatocytes, the majority of cells must contain saturated fats as seen in the H&E liver sections (Fig. 1(b)).
We found the fluorescence background is too high in the low frequency (LF) range for the macro-Raman endoscopic probe to extract reliable Raman spectra. However, we were able to extract usable spectra in the high frequency (HF) regime (Fig. 5). The confocal micro-Raman system can discern features in the LF and HF range because the fluorescence background is reduced, possibly because the high local light intensity triggered photobleaching. Moreover, while the micro-Raman system probes volumes of the order of micron cubed, the macro-Raman system probes mm cubed volumes. Consequently, one cannot rule out endogenous extracellular components contributing to fluorescence when probing the bulk organ, as with the macro-Raman endoscope.
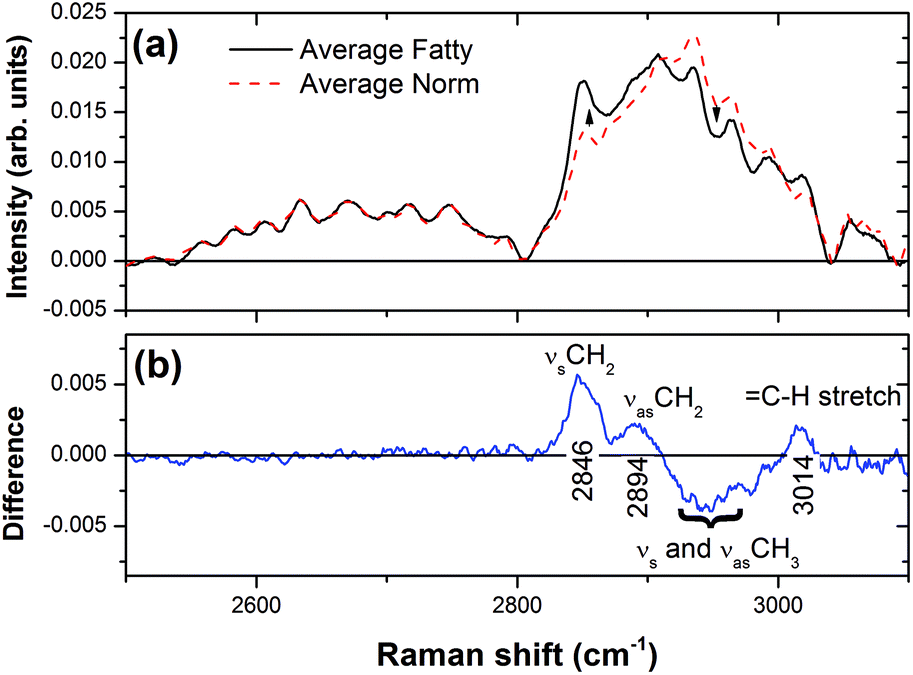 | ||
| Fig. 5 Raman Spectra of a normal (red spectrum) and fatty mice liver (black spectrum), using 785 nm excitation and an acquisition time of 1 second. Average spectra from three fatty liver and two normal liver spectra were preprocessed by removing the fluorescent background using a polynomial fit. (B) Difference spectra generated by subtraction of the control mice spectra from the fatty mice spectra, reveals the presence of signal at 2846 cm−1 due to symmetric stretching of C–H bonds in CH2, 2894 cm−1 due to symmetric stretching of C–H bonds in CH3, and 3014 cm−1 due to C–H asymmetric stretching. | ||
Fig. 5(a) presents background-corrected Raman spectra collected using the BCCARC endoscopic Raman system of intact mice livers, following excitation by a 785 nm laser. A large fluorescence background was observed, so a difference spectrum was generated (Fig. 5(b)) to extract the changes in the Raman spectra; by first fitting a polynomial by hand and subtracting the resulting spectra. The difference spectrum shows peaks at 2846 cm−1, 2891 cm−1, and 3014 cm−1, respectively, corresponding to CH2 symmetric stretch, CH2 asymmetric stretch and C–H stretch vibrations. The latter is present when using NIR and not visible (458 or 514.5 nm) light excitation. At the same time there is a reduction in vibrations due to CH3 symmetric and asymmetric stretch.
Having shown that the macro-Raman endoscope can effectively track the underlying biochemical changes in the high frequency range, we proceeded to conduct detailed studies of steatosis in rat models at several different histological stages.
3.2 Experiments using rats
 | ||
| Fig. 6 TLC-based determination of the concentration of triglycerides (g L−1) in the left liver lobe of rats fed a methionine/choline deficient diet. | ||
A blinded histological rating (Fig. 7) of the fat content in sections from the left lobe shows an increase followed by saturation over the course of the experiment.
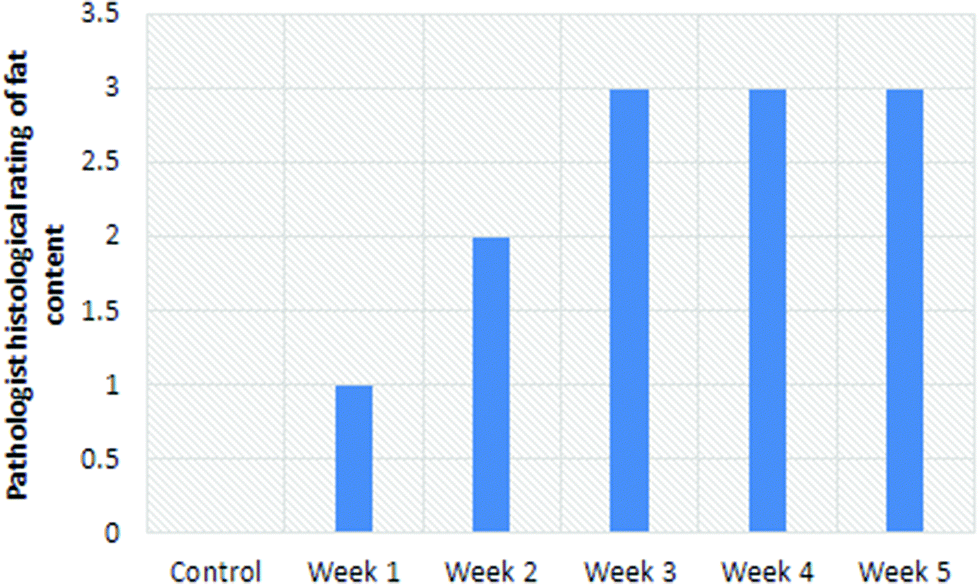 | ||
| Fig. 7 Blinded histological rating of the fat content in rat liver lobes. Scale: Severe = 3, moderate = 2, mild = 1, absent = 0. | ||
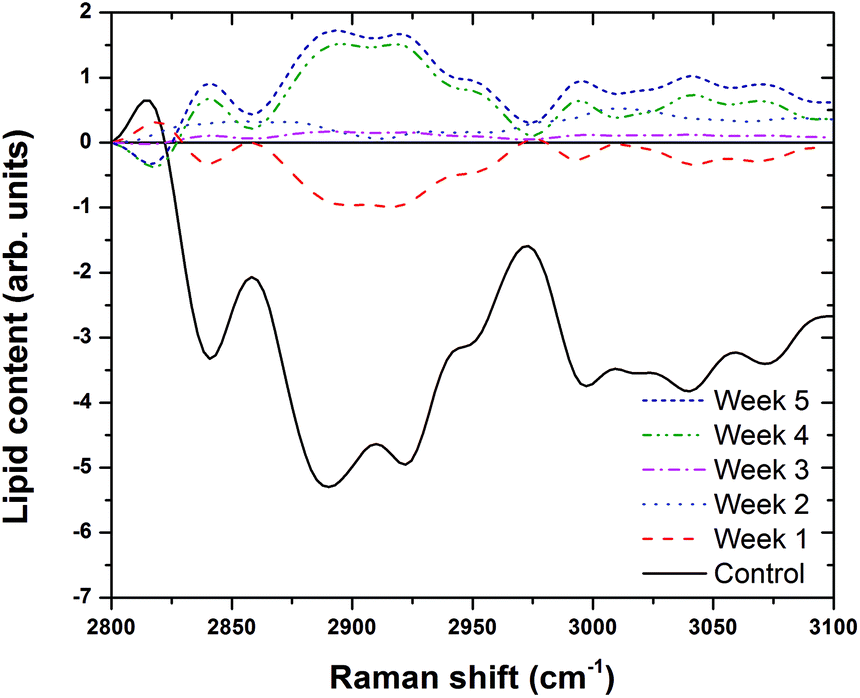 | ||
| Fig. 8 The contribution of factor one converted back into a spectrum for each week on the MCD diet. Spectra falling above the x-axis (average spectrum) have higher lipid content than the average and spectra falling below the x-axis have lower lipid content than the average. | ||
The spectra look similar to lipid spectra (Fig. 5), as expected if lipids are the principal source of the difference. Spectra from later weeks have more lipids than the average, earlier weeks have less lipid than the average. Spectra lying on the x-axis represents the average lipid signal for all six weeks. The spectra of earlier weeks fell below the x-axis, and therefore have a smaller amount of lipids than the average, and spectra from later weeks have more lipids than the average. The control is significantly lower than the rest of the spectra.
When the PC1 scores are plot as a function of weeks on the MCD diet, the left lobe showed a consistent increase (Fig. 9). These scores are consistent across the cut and uncut areas of the liver, implying a homogeneous lipid distribution. For an optical technique such as Raman spectroscopy which has limited penetration depth, this finding means the liver can be assessed in an intact state without the need for sectioning. Moreover, the assessment is obtained in real-time (i.e. within a few seconds), allowing the attending medical practitioner to make a rapid determination of the suitability of the organ.
 | ||
| Fig. 9 Scores from the factor 1 plot for the left lobe of rat livers. Error bars correspond to one-half the range of data. | ||
To understand the relationship between the biochemistry, blinded pathologist rating and spectroscopic measure of steatosis (PC1 scores), the corresponding quantities are plotted versus one another (Fig. 10).
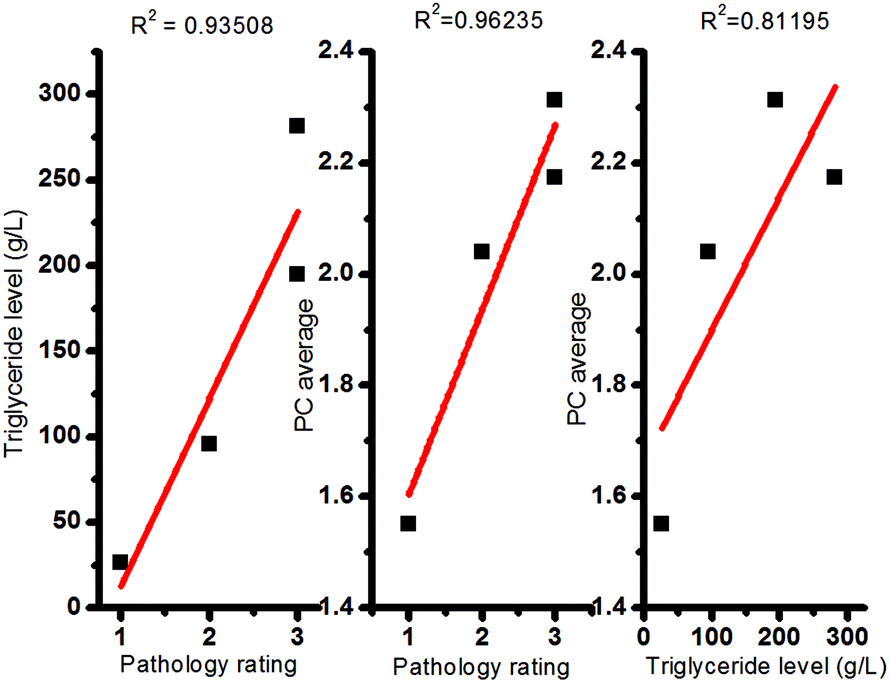 | ||
| Fig. 10 Plot of (a) PC score vs. Pathologist rating, (b) PC score versus triglyceride content and (c) triglyceride content vs. Pathologist rating, for the left lobe. | ||
Fig. 10 shows that hepatic steatosis levels based on Raman spectroscopic evidence (PC average) is highly correlated with blinded pathologist rating (R2 = 0.962) and triglyceride levels (R2 = 0.812). Additionally, the triglyceride levels are consistent with the pathologist rating (R2 = 0.935), the gold standard for assessment. These correlations imply that any of the techniques can be used to assess hepatic steatosis. Unfortunately, the hours and expertise required for sectioning, staining and scoring by a pathologist, or extraction and thin layer chromatography determination of triglyceride levels by a biochemist, renders these techniques obsolete in the time-sensitive decision making regarding the suitability of livers for transplantation. Our macro-Raman endoscopic probe is able to provide a result in real-time (1 second) on bulk tissue requiring no preparation. We propose that its adoption, through the use of a hand-held and portable device, would provide transplant specialists with a valuable tool to obtain real time information on the severity of hepatic steatosis to assess the likelihood of a successful transplant. Future experiments are planned to validate Raman spectroscopy in vivo in humans where intraoperative sampling of livers in situ will be compared to pre-operative imaging modalities and the current gold standard, liver biopsy.
4. Conclusions
It has been demonstrated that Raman spectroscopy, utilizing a high throughput fiber probe system developed by us, coupled with principal component analysis can provide an accurate and rapid assessment of the hepatic fat content of bulk liver, highly correlated with the gold standard – pathologist rating of stained liver sections. In the hands of the clinician this spectroscopic technique would provide an immediate, robust tool to assess, at the site of retrieval, the suitability of donor livers prior to transplantation.Acknowledgements
The authors wish to acknowledge the financial support of the Natural Science and Engineering Research Council of Canada, Canadian Institutes of Health Research, office of the Dean of Science – Dalhousie University, the Imhotep's Legacy Academy and Astellas Pharma Canada.References
- R. Vetelainen, A. van Vliet, D. J. Gouma and T. M. van Gulik, Ann. Surg., 2007, 245, 20–30 CrossRef PubMed.
- G. C. Farrell and C. Z. Larter, Hepatology, 2006, 43, S99–S112 CrossRef CAS PubMed.
- S. G. Sheth, F. D. Gordon and S. Chopra, Ann. Intern. Med., 1997, 126, 137–145 CrossRef CAS.
- C. J. Imber, S. D. St. Peter, A. Handa and P. J. Friend, Liver Transpl., 2002, 8, 415–423 CrossRef PubMed.
- L. McCormack, P. Dutkowski, A. M. El-Badry and P. A. Clavien, J. Hepatol., 2011, 54, 1055–1062 CrossRef PubMed.
- M. Angelico, Eur. Rev. Med. Pharmacol. Sci., 2005, 9, 295–297 CAS.
- A. M. El-Badry, W. Moritz, C. Contaldo, Y. Tian, R. Graf and P. A. Clavien, Hepatology, 2007, 45, 855–863 CrossRef CAS PubMed.
- J. P. Deroose, G. Kazemier, P. Zondervan, J. N. Ijzermans, H. J. Metselaar and I. P. Alwayn, HPB, 2011, 13, 417–425 CrossRef PubMed.
- A. Qayyum, D. M. Chen and R. S. Breiman, Clin. Imag., 2009, 33, 110–115 CrossRef PubMed.
- G. J. Cowin, J. R. Jonsson and J. D. Bauer, J. Magn. Reson. Imaging, 2008, 28, 937–945 CrossRef PubMed.
- J. De Gelder, K. De Gussem and P. Vandenabeele, J. Raman Spectrosc., 2007, 38, 1133–1147 CrossRef CAS PubMed.
- Z. Movasaghi, S. Rehman and I. U. Rehman, Appl. Spectrosc. Rev., 2007, 42, 493–541 CrossRef CAS PubMed.
- A. Raea, R. Stosch, P. Klapetek, A. R. H. Walker and D. Roy, Methods, 2014, 68, 338–347 CrossRef PubMed.
- V. Baeten, Lipid Technol., 2010, 22, 36–36 CrossRef CAS PubMed.
- Y. Y. Huang, C. M. Beal, W. W. Cai, R. S. Ruhoff and E. M. Terentjev, Biotechnol. Bioeng., 2010, 105, 889–898 CAS.
- R. M. El-Abassy, P. J. Eravuchira, P. Donfact, B. von der Kammer and A. Materny, Vib. Spectrosc., 2010, 56, 3–8 CrossRef PubMed.
- Y. M. Wu, H. C. Chen, W. T. Chang, J. W. Jhan, H. L. Lin and I. Liau, Anal. Chem., 2009, 81, 1496–1504 CrossRef CAS PubMed.
- Y. Adkins, I. W. Schie, D. Fedor, A. Reddy, S. Nguyen, P. Zhou, D. S. Kelly and J. Wu, Lab. Invest., 2013, 93, 1313–1322 CrossRef CAS PubMed.
- K. Majzner, K. Kochan, M. E. Kachamakova-Trojanowska, S. Chlopicki and M. Baranska, Anal. Chem., 2014, 86, 6666–6674 CrossRef CAS PubMed.
- Y. Yu, P. V. Ramachandran and M. C. Wang, Biochim. Biophys. Acta, 2014, 1841, 1120–1129 CrossRef CAS PubMed.
- R. B. Merriman, L. D. Ferrell, M. G. Patti, S. R. Weston, M. S. Pabst, B. E. Aouizerat and N. M. Bass, Hepatology, 2006, 44, 874–880 CrossRef PubMed.
- V. Ratziu, F. Charlotte, A. Heurtier, S. Gombert, P. Giral, E. Bruckert, A. Grimaldi, F. Capron and T. Poynard, Gastroenterology, 2005, 128, 1898–1906 CrossRef PubMed.
- Z. Huang, H. Zeng, I. Hamzavi, D. I. McLean and H. Lui, Opt. Lett., 2001, 26, 1782–1784 CrossRef CAS.
- M. Short, S. Lam, A. McWilliams, J. Zhao, H. Lui and H. Zeng, Opt. Lett., 2008, 33, 711–713 CrossRef CAS.
- A. Hildebrandt, I. Bickmeyer and R. P. Kühnlein, PLoS One, 2011, 6, e23796 CAS.
- D. Hutsebaut, P. Vandenabeele and L. Moens, Analyst, 2005, 130, 1204–1214 RSC.
- J. Zhao, H. Lui, D. I. McLean and H. Zeng, Appl. Spectrosc., 2007, 61, 1225–1232 CrossRef CAS PubMed.
- A. Savitzky and A. Golay, Anal. Chem., 1964, 36, 1627–1639 CrossRef CAS.
- T. L. Weis, Y. N. Jiang and E. R. Grant, J. Raman Spectrosc., 2004, 35, 813 CrossRef CAS PubMed.
- M. A. Short, S. Lam, A. M. McWilliams, D. N. Ionescu and H. Zeng, J. Thorac. Oncol., 2011, 6, 1206–1214 CrossRef PubMed.
- J. B. Cooper, Chemom. Intell. Lab. Syst., 1999, 46, 231 CrossRef CAS.
| This journal is © The Royal Society of Chemistry 2015 |