 Open Access Article
Creative Commons Attribution 3.0 Unported Licence
Screen-printed back-to-back electroanalytical sensors: heavy metal ion sensing†
Ana P.
Ruas de Souza
ab,
Christopher W.
Foster
a,
Athanasios V.
Kolliopoulos
a,
Mauro
Bertotti
b and
Craig E.
Banks
*b
aFaculty of Science and Engineering, School of Chemistry and the Environment, Division of Chemistry and Environmental Science, Manchester Metropolitan University, Chester Street, Manchester M15 GD, UK
bInstituto de Química – Universidade de São Paulo, 05508-900, São Paulo, SP, Brazil. E-mail: c.banks@mmu.ac.uk; Web: http://www.craigbanksresearch.com Fax: +(0)1612476831; Tel: +(0)1612471196
First published on 23rd April 2015
Abstract
Screen-printed back-to-back microband electroanalytical sensors are applied to the quantification of lead(II) ions for the first time. In this configuration the electrodes are positioned back-to-back with a common electrical connection to the two working electrodes with the counter and reference electrodes for each connected in the same manner as a normal “traditional” screen-printed sensor. Proof-of-concept is demonstrated for the electroanalytical sensing of lead(II) ions utilising square-wave anodic stripping voltammetry where an increase in the electroanalytical sensitivity is observed by a factor of 5 with the back-to-back microband configuration at a fixed lead(II) ion concentration of 5 μg L−1 utilising a deposition potential and time of −1.2 V and 30 seconds respectively, compared to a conventional (single) microband electrode. The back-to-back microband configuration allows for the sensing of lead(II) ions with a linear range from 5 to 110 μg L−1 with a limit of detection (based on 3σ) corresponding to 3.7 μg L−1. The back-to-back microband configuration is demonstrated to quantify the levels of lead(II) ions within drinking water corresponding to a level of 2.8 (±0.3) μg L−1. Independent validation was performed using ICP-OES with the levels of lead(II) ions found to correspond to 2.5 (±0.1) μg L−1; the excellent agreement between the two methods validates the electroanalytical procedure for the quantification of lead(II) ions in drinking water. This back-to-back configuration exhibits an excellent validated analytical performance for the determination of lead(II) ions within drinking water at World Health Organisation levels (limited to 10 μg L−1 within drinking water).
1. Introduction
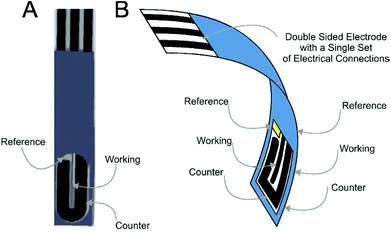
Screen-printed electrochemical derived sensors have revolutionised the field due to their capability to bridge the gap between laboratory experiments with in-field implementation.1–6 Furthermore the ability to mass produce screen-printed electrodes allows their use as highly reproducible, economic one-shot sensors, alleviating potential memory effects and contamination whilst eradicating the requirement for electrode pre-treatment and preparation, as is often the case for solid electrodes (such as glassy carbon and boron-doped diamond etc.) prior to their use.7–11Recently we introduced the concept of the screen-printed back-to-back electrode configuration where both sides of a plastic substrate are screen-printed upon utilizing the usually redundant back of the screen-printed sensor, converting this “dead-space” into a further electrochemical sensor which results in improvements in the analytical performance;12Fig. 1 depicts the concept where screen-printed microband electrodes are fabricated “back-to-back”.12
In this paper the exploration of the screen-printed back-to-back electrode configuration towards the sensing of the heavy metal lead(II) ions is considered for the first time. This target metal ion has received much attention owing to its high toxicity, as its accumulation in the body has serious deleterious effects on humans.13 In particular, lead strongly affects the mental and physical development of children, and can cause poisoning in adults, inducing severe damage to the liver, brain, kidneys, reproductive system and central nervous system.13 Since lead(II) ions are naturally found within drinking water, the World Health Organisation (WHO) recommends this is limited to 10 μg L−1.14 We demonstrate that screen-printed microband electrode back-to-back configurations exhibit analytically useful sensing capabilities with improvements in the electroanalytical sensitivity observed over that of traditionally employed single microband electrodes. Proof-of-concept is demonstrated for the sensing of lead(II) ions at analytically useful levels within model conditions and is demonstrated to successfully quantify lead(II) ions in drinking water which is independently validated with ICP-OES; the analytical utility of the proposed back-to-back microband electrode is demonstrated to quantify lead(II) ions in drinking water at WHO levels.
2. Experimental
All chemicals used were of analytical grade and were used as received without any further purification and were obtained from Sigma-Aldrich. The solutions were prepared with deionised water of resistivity not less than 18 MΩ cm. All measurements were performed with a Palmsens (Palm Instruments BV, The Netherlands) potentiostat.All measurements were conducted using a screen-printed graphite microband three electrode configuration (bSPE) consisting of a carbon–graphite geometric working electrode (100 μm diameter and 20 mm length), carbon–graphite counter electrode and Ag/AgCl reference.15 Such bSPEs were fabricated in-house with appropriate stencil designs using a microDEK 1760RS screen-printing machine (DEK, Weymouth, UK). A carbon–graphite ink formulation (Product Code: C2000802P2; Gwent Electronic Materials Ltd, UK) was first screen-printed onto a polyester flexible film (Autostat, 250 μm thickness). This layer was cured in a fan oven at 60 degrees for 30 minutes. This layer defines the graphite working electrodes for the configurations, as shown in Fig. 1, which tailors off onto a larger size graphite pad to enable ease of connection to an edge connector.16 Next a silver/silver chloride reference electrode was included by screen-printing a Ag/AgCl paste (Product Code: C2040308P2; Gwent Electronic Materials Ltd, UK) onto the plastic substrate. Last, a dielectric paste ink (Product Code: D2070423D5; Gwent Electronic Materials Ltd, UK) was printed to cover the connections and define the carbon–graphite working electrode. After curing at 60 degrees for 30 minutes the screen-printed electrode is ready to use.
In this configuration the sensor is printed only upon one side. There are two options to achieve the back-to-back configuration. The first is that the above approach is repeated on the back side of the polyester substrate12 or two electrode can be taken and placed back-to-back, herein the latter approach is utilised for simplicity. From this point onwards when the electrodes are back-to-back, a superscript “2” is introduced, such that in the case of a single microband electrode (bSPE) in the back-to-back configuration becomes denoted as b2SPE. Additional side-by-side experiments were performed with the microband electrodes printed in a side-by-side configuration as demonstrated in ESI Fig. 1.†
Square wave anodic stripping voltammetry (SWASV) was used throughout this work for the determination of lead(II) ions with a deposition potential of −1.2 V. The following buffer solutions were utilised and explored in this work: solution A: contained a combination of 2.50 M ammonium acetate, 1.55 M acetic acid and 0.02 M phenol in ethanol solution;17 solution B: contained a combination of 2.50 M ammonium acetate and 1.55 M acetic acid;17 solution C: 0.10 M sodium acetate buffer solution (pH 4.5) and solution D: 0.02 HCl solution (pH 1.7). Drinking water was obtained from a drinking water tap (Manchester City Centre, Manchester, UK) which was run for a minute before a sample being obtained. The sample was then stored at room temperature and used within a day of sampling. Prior to electroanalytical measurements the drinking water samples were simply modified to pH 1.7.
Inductively Coupled Plasma/Optical Emission Spectrometry (ICP-OES) experiments were carried out using a Thermo Scientific DUO iCAP 6300 ICP Spectrometer, exhibiting a relative standard deviation of 2.7%.
3. Results and discussion
First the optimised solution characteristics for the anodic stripping voltammetric determination of lead(II) ions are explored. Four solutions of differing compositions (see Experimental section) were utilised using the b2SPE with a fixed concentration of 2000 μg L−1 of lead(II) ions and a deposition potential and time of −1.2 V and 60 seconds respectively. In this approach the lead(II) ions are accumulated in the form of lead (0) through the application of the negative (deposition) potential at a selected time following which, the potential is swept positive. This process results in the electrochemically deposited lead metal upon the electrode surface to be stripped back to lead(II) ions giving rise to a voltammetric stripping peak, the analytical signal, where the peak height (and area) of the response is proportional to lead(II) ion concentrations.18 It was found that a distinctive stripping peak is observed at a peak potential of ∼−0.60 V (vs. Ag/AgCl); such responses are typical of that seen within literature.19–24 The average current density (taken from the peak current/electrode geometric area) for the lead stripping peak was found to correspond to 13.60 μA cm−2 (solution A), 417.5 μA cm−2 (solution B), 542.6 μA cm−2 (solution C) and 1037 μA cm−2 (solution D). These results show that the optimal solution for the electroanalysis of lead(II) ions is solution D (0.02 HCl solution; pH 1.7) which is used herein.Further optimisation was next performed in order to find the optimal deposition time utilising square wave anodic stripping voltammetry (SWASV) using 5 μg L−1 of lead(II) ions in a 0.02 M HCl solution (pH 1.7). This concentration is chosen since as it is below that indicated by the WHO where lead(II) levels within drinking water are recommended to be limited to 10 μg L−1.25 Optimisation of the deposition times were next explored using both the bSPE and b2SPE. It became apparent that the optimum results are obtained when a deposition time of 30 seconds is employed with further deposition times found to result in a plateauing of the observed current density response. Through the application of a deposition time of 30 seconds, the current density is found to correspond to 3.40 and 17.55 μA cm−2 utilising the bSPE and b2SPE configurations respectively. Such values indicate that the b2SPE exhibits a ∼5 times improvement over that of a single bSPE indicating the advantageous use of the back-to-back configuration.
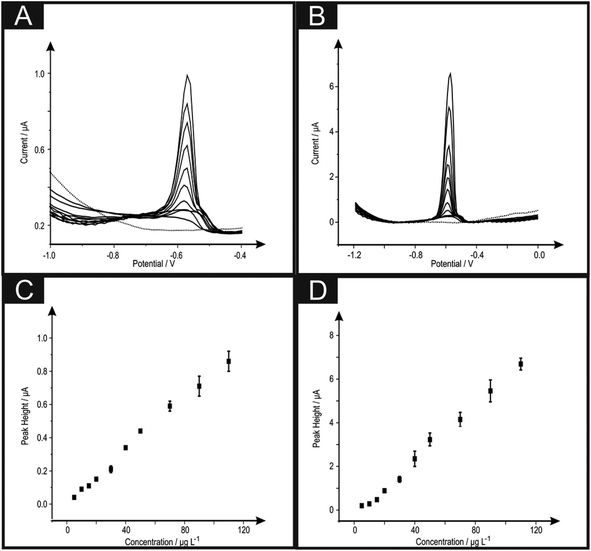
The analytical efficacy of the b2SPE configuration was next explored towards the sensing of lead(II) ions, utilising SWASV and compared to a single microband (bSPE). Fig. 2 depicts the response from additions of lead(II) ions made over the concentration range of 5–110 μg L−1 using both electrode configurations. Analysis of the SWASV profiles in the form of plots of peak height (IH) vs. concentration are found to be linear over the concentration range with the following linear regression: bSPE: IH/μA = 8.00 × 10⁻³ μA μg−1 L−1 + 2.90 × 10⁻³ μA; R2 = 0.99; N = 10; b2SPE: IH/μA = 0.06 μA μg−1 L−1 + 0.31 μA; R2 = 0.99; N = 10. Analysis of the current density using both electrode configurations are depicted in Fig. 3 where the b2SPE exhibits a greater analytical response over the bSPE towards the detection of lead(II) ions over the concentration range used. The limit of quantification (LOQ; 10σ) was found to correspond to 5.00 μg L−1 for both cases, with values for the limit of detection (LOD) (3σ) for the b2SPE showing a ∼3 times improvement in comparison to the bSPE, with values corresponding to 1.01 and 3.70 μg L−1 respectively.
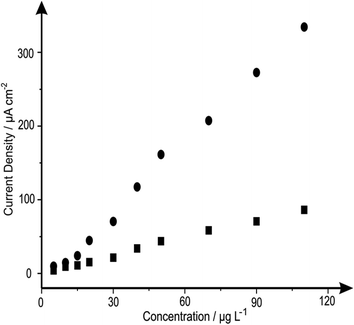 | ||
| Fig. 3 Analysis of the data presented in Fig. 2 in terms of plots of current density (of the peak heights) against increasing concentrations of lead(II) ions utilising the bSPEs (squares) and b2SPEs (circles). Deposition potential and time: −1.2 V and 30 seconds respectively. | ||
The improvement in the current density through the use of the back-to-back configuration is a key advantage of using this novel geometry. The reason for the improvement was thought that in the use of the back-to-back design, the electrode area is consequently doubled without resulting in any increase in unwanted capacitive currents, as would be observed if simply a larger electrode area was utilised, with improvements in the analytical performance observed with the analytical sensitivity (gradient of a plot of peak height/analytical signal against concentration) and the corresponding limit-of-detection being reduced.12 The microband electrodes are advantageous since due to their geometric shape, have an additional contribution from radial diffusion in addition to planar diffusion. This change results in enhanced mass transport of electroactive species to the electrode surface, reduced double-layer capacitance, and less susceptibility to ohmic losses.18 These characteristics make it possible to perform analysis with enhanced sensitivity on short time scales under time independent conditions. In the case of the back-to-back configuration, we are electrically wiring two microband electrodes back-to-back and hence this induces an additionally improvement in the sensitivity of the electrodes performance. Effectively our configuration acts akin to a microband array and this is exemplified earlier in this paper where a five times improvement in the current density is evident for the sensing of lead(II) ions using the back-to-back configuration over that of a single microband electrode. This results in improvements in the analytical performance with a greater sensitivity observed (see Fig. 3) with a lower limit of detection achievable for the case of the b2SPE over that of the bSPE.
It is also important to note that as previously mentioned by Metters et al.12 the back-to-back configuration allows for a perfect electrode configuration where diffusion zones do not overlap or interfere with each other which would be the case if two electrodes were wired in unison and placed in the solution side-by-side (see ESI Fig. 1†). To prove this insight for the sensing of lead(II) ions, a comparison between the side-by-side (see ESI Fig. 1†) and the back-to-back configuration (see Fig. 1) was explored. ESI Fig. 2A† shows comparative SWASV of both configurations at a concentration of lead(II) ions at 100 μg L−1, it is clear that the peak height in the case of the side-by-side configuration is significantly hindered compared to that of the back-to-back. Additionally shown in ESI Fig. 2B† are the resultant calibration curves for the side-by-side configuration over the lead(II) ion concentration range of 100–598 μg L−1, the range of which is limited by this configuration. These results are further verified by the vast difference within the LOD (3σ) for the side-by-side configuration compared to the back-to-back configuration, with values corresponding to 31 and 1.1 μg L−1 respectively. Note the high LOD and large error bars are a result of diffusional zones between the working electrodes of the side-by-side overlapping where the microbands electrode deplete the same region of solution.26–28 In the case of the back-to-back electrodes, diffusional zones will likely never interact which is an advantage of using this novel electrode configuration.
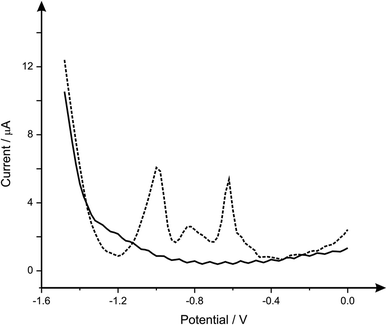
It is important when analysing heavy metals that the response you are obtaining is that of the metal you desire, therefore the analysis of common interferences of lead(II), cadmium(II) and zinc(II)) are next considered. Fig. 4 depicts the response obtained from a b2SPE sensor, for the simultaneous detection of lead(II), cadmium(II) and zinc(II) where it is clear that three separate peaks are observed at −0.6 V, −0.8 V and −1.0 V respectively. Such responses are in agreement with literature concerning the simultaneous detection of these analytes upon carbon electrode.29–31 Upon analytical analysis (ESI Fig. 3†) of the cadmium and zinc the lower linear range was utilised to calculate the LOD which was found to correspond to 0.3 and 32 μg L−1 respectively, which for cadmium is very competitive however this system is not ideal for zinc ion detection compared to many others;32 clearly the b2SPE configuration can potentially be used for the simultaneous sensing of lead(II), cadmium(II) and zinc(II), however in this case we solely examine the effect of interference not analytical competency. Returning to the analytical performance of the b2SPE sensor, its response is benchmarked against the current literature and against the WHO recommended limit, as presented in Table 1. It is clear that the b2SPE sensor is competitive against other electrochemical configurations. What is of interest is that in the majority of cases, lengthy deposition times are utilised and very few are applied or validated in real samples. It is this we next address.
| Electrode of choice | Limit of detection (3σ)/(μg L−1) | Linear range/(μg L−1) | Deposition time/s | Comments | Ref. |
|---|---|---|---|---|---|
| GC: glassy carbon; CPE: carbon paste electrode; SPE: screen-printed electrode; AAS: atomic absorption spectroscopy. | |||||
| WHO level in drinking water | N/A | 10 | N/A | WHO recommended level of lead in drinking water | 14 |
| GC | 18.0 | 100–400 | 120 | Simultaneous detection of lead(II) and cadmium(II) in a 0.1 M acetate buffer solution using a bismuth film electrode. | 33 |
| 11.0 | |||||
| 2.30 | 20–100 | 300 | Simultaneous detection of lead(II) and cadmium(II) with an introduction of K4[FeCN6] within a 0.1 M acetate buffer solution, using bismuth film electrode. | 34 | |
| 1.50 | Limits of detection revealed to be below that stated by WHO. | ||||
| 0.80 | 5–60 | 600 | Simultaneous detection of lead(II) and cadmium(II) using bismuth nanoparticles upon the working electrode, within a tap water solution, results were validated with ICP-MS. | 20 | |
| 2.30 | 1.5–450 | 240 | Simultaneous detection of lead(II), cadmium(II) and copper(II) with analytical applications within tap water. Results validated by AAS. | 35 | |
| CPE | 0.45 | 50–200 | 180 | Simultaneous detection of lead(II), cadmium(II) and copper(II) and zinc(II) in HCl. | 36 |
| Amino-functionalized metal–organic frameworks | 1.04 | 2–70 | 300 | Lead(II) detection using a NH2–Cu3(BTC)2 modified GCE, in a 0.1 M acetate buffer solution. | 19 |
| SPE | 0.03 | 0.05–30 | 300 | Modified porous bismuth SPE demonstrates simultaneous detection of lead(II) and cadmium(II), in real water samples, with the porous electrode offering higher sensitivity due to the increased surface area. | 37 |
| 5.00 | 16.8–62.6 | 120 | In situ modified antimony SPE showing detection of lead(II) in a 0.1 M acetate buffer solution. | 38 | |
| 2.00 | 10–100 | 120 | Detection of lead(II) within surface waters and validated with ICP-AES using a bismuth film SPE. | 39 | |
| 0.91 | 2.5–100 | 120 | Detection of lead(II) within a solution of HCl using acetamide phosphonic acid self-assembled monolayer on a mesoporous silica modified SPE. | 40 | |
| b 2 SPE | 1.10 | 5–110 | 30 | Detection of lead(II) within drinking water samples validated against ICP-OES, using an intelligent design which allows for a shorter deposition time compared to current literature. | This work |
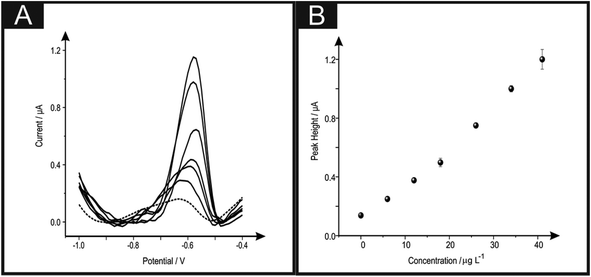
The detection of lead(II) ions within drinking water was next explored using the b2SPE; real sample analysis was undertaken to see if the proposed electroanalytical protocol has any potential interferents. Using SWASV the determination of lead(II) ions within drinking water via the standard addition protocol was performed. A typical standard addition plot and voltammograms are shown in Fig. 5. The fitting of the data in Fig. 5 revealed the following linear regression: IH/μA = 0.03 μA μg−1 L−1 + 0.08 μA; R2 = 0.99; N = 10. The concentration of lead(II) ions within the drinking water sample was calculated from the lower linear range resulting from the standard addition plot and was found to be 2.8 (±0.3) μg L−1. The obtained value was compared with Inductively Coupled Plasma-Optical Emission Spectrometry (ICP-OES) (further details can be found in the Experimental section). Results obtained via ICP-OES correspond to 2.5 (±0.1) μg L−1. The excellent agreement between the proposed electrochemical protocol and independent laboratory analysis indicates the usefulness of the proposed electrochemical sensing protocol.
4. Conclusions
We have reported the first example of using the back-to-back electrode configuration towards the sensing of heavy metal ions using SWASV. It is found that in comparison to a single commonly utilised microband electrode that the back-to-back configuration allows a five times improvement in the analytical sensitivity over that of a single microband, and thus create an excellent alternative to that of a standalone microband electrode setup. Proof-of-concept is demonstrated towards the sensing of an unknown concentration of lead(II) ions found within a sample of drinking water, which upon utilisation of the standard addition method presented a concentration which upon independently verification with ICP-OES, was found to be the same. This novel screen-printed back-to-back electrode configuration shows extreme promise for the generic sensing of heavy metal ions.Acknowledgements
The authors would like to thank the CAPES (Coordenação de Aperfeiçoamento de Pessoal de Nível Superior) foundation (number 4220/14-5) for their financial support.References
- J. P. Metters, R. O. Kadara and C. E. Banks, Analyst, 2011, 136, 1067 RSC.
- J. P. Hart and S. A. Wring, Electroanalysis, 1994, 6, 617 CrossRef CAS PubMed.
- M. Li, Y. Li, D. Li and Y. Long, Anal. Chim. Acta, 2011, 734, 31 CrossRef PubMed.
- A. S. Kumar and J. Zen, Electroanalysis, 2002, 14, 671 CrossRef CAS.
- K. C. Honeychurch and J. P. Hart, Trends Anal. Chem., 2003, 22, 456 CrossRef CAS.
- C. W. Foster, J. P. Metters and C. E. Banks, Electroanalysis, 2013, 25, 2275–2282 CAS.
- C. W. Foster, J. P. Metters, D. K. Kampouris and C. E. Banks, Electroanalysis, 2014, 26, 262–274 CrossRef CAS PubMed.
- J. P. Metters, R. O. Kadara and C. E. Banks, Sens. Actuators, B, 2012, 169, 136–143 CrossRef CAS PubMed.
- R. O. Kadara, N. Jenkinson and C. E. Banks, Electrochem. Commun., 2009, 11, 1377–1380 CrossRef CAS PubMed.
- F. Tan, J. P. Metters and C. E. Banks, Sens. Actuators, B, 2013, 181, 454–462 CrossRef CAS PubMed.
- J. P. Metters, R. O. Kadara and C. E. Banks, Analyst, 2012, 137, 896 RSC.
- J. P. Metters, E. P. Randviir and C. E. Banks, Analyst, 2014, 139, 5339–5349 RSC.
- R. A. Goyer, Toxicology of metals - biochemical aspects, Springer-Verlag, New York, 1995 Search PubMed.
- WHO, Guidance for Drinking Water Quality, Recommendations, Geneva, 2nd edn, 1993, vol. 1 Search PubMed.
- C. W. Foster, J. P. Metters, D. K. Kampouris and C. E. Banks, Electroanalysis, 2014, 26, 262 CrossRef CAS PubMed.
- F. E. Galdino, C. W. Foster, J. A. Bonacin and C. E. Banks, Anal. Methods, 2015, 7, 1208–1214 RSC.
- E. Ghali and M. Girgis, Metall. Trans. B, 1985, 16, 489–496 CrossRef.
- R. G. Compton and C. E. Banks, Understanding Voltammetry, Imperial College Press, 2007 Search PubMed.
- Y. Wang, H. L. Ge, Y. C. Wu, G. Q. Ye, H. H. Chen and X. Y. Hu, Talanta, 2014, 129, 100–105 CrossRef CAS PubMed.
- D. Yang, L. Wang, Z. L. Chen, M. Megharaj and R. Naidu, Microchim. Acta, 2014, 181, 1199–1206 CrossRef CAS.
- V. B. dos Santos, E. L. Fava, N. S. de Miranda Curi, R. C. Faria and O. Fatibello-Filho, Talanta, 2014, 126, 82–90 CrossRef CAS PubMed.
- N. Wang and X. D. Dong, Anal. Lett., 2008, 41, 1267–1278 CrossRef CAS.
- Y. Wu, N. B. Li and H. Q. Luo, Sens. Actuators, B, 2008, 133, 677–681 CrossRef CAS PubMed.
- D. Li, J. Jia and J. Wang, Talanta, 2010, 83, 332–336 CrossRef CAS PubMed.
- World Health Organisation, Exposure to Lead: A major public health concern, Public Health and Environment, WHO Document Production Services, Geneva, 2010 Search PubMed.
- S. J. Hood, R. O. Kadara, D. K. Kampouris and C. E. Banks, Analyst, 2010, 135, 76–79 RSC.
- S. J. Hood, D. K. Kampouris, R. O. Kadara, N. Jenkinson, F. J. del Campo, F. X. Munoz and C. E. Banks, Analyst, 2009, 134, 2301–2305 RSC.
- O. Ordeig, J. del Campo, F. X. Muñoz, C. E. Banks and R. G. Compton, Electroanalysis, 2007, 19, 1973–1986 CrossRef CAS PubMed.
- J. F. van Staden and M. C. Matoetoe, Anal. Chim. Acta, 2000, 411, 201–207 CrossRef CAS.
- J. Gardiner and M. J. Stiff, Water Res., 1975, 9, 517–523 CrossRef CAS.
- I. Rutyna and M. Korolczuk, Sens. Actuators, B, 2014, 204, 136–141 CrossRef CAS PubMed.
- M. Á. G. Rico, M. Olivares-Marín and E. P. Gil, Talanta, 2009, 80, 631–635 CrossRef PubMed.
- J. Saturno, D. Valera, H. Carrero and L. Fernandez, Sens. Actuators, B, 2011, 159, 92–96 CrossRef CAS PubMed.
- G.-H. Hwang, W.-K. Han, J.-S. Park and S.-G. Kang, Sens. Actuators, B, 2008, 135, 309–316 CrossRef CAS PubMed.
- H. Lin, M. Li and D. Mihailovič, Electrochim. Acta, 2015, 154, 184–189 CrossRef CAS PubMed.
- H. Devnani, D. S. Rajawat and S. P. Satsangee, Proc. Natl. Acad. Sci., India, Sect. A, 2014, 84, 361–370 CrossRef CAS.
- C. Chen, X. Niu, Y. Chai, H. Zhao and M. Lan, Sens. Actuators, B, 2013, 178, 339–342 CrossRef CAS PubMed.
- V. Sosa, C. Barceló, N. Serrano, C. Ariño, J. M. Díaz-Cruz and M. Esteban, Anal. Chim. Acta, 2015, 855, 34–40 CrossRef CAS PubMed.
- H.-L. Fang, H.-X. Zheng, M.-Y. Ou, Q. Meng, D.-H. Fan and W. Wang, Sens. Actuators, B, 2011, 153, 369–372 CrossRef CAS PubMed.
- W. Yantasee, L. A. Deibler, G. E. Fryxell, C. Timchalk and Y. Lin, Electrochem. Commun., 2005, 7, 1170–1176 CrossRef CAS PubMed.
Footnote |
| † Electronic supplementary information (ESI) available. See DOI: 10.1039/c5an00381d |
| This journal is © The Royal Society of Chemistry 2015 |

