
 Open Access Article
 This Open Access Article is licensed under a
 Creative Commons Attribution 3.0 Unported Licence
Topological events in single molecules of E. coli DNA confined in nanochannels†
Jeffrey G.
Reifenberger
*a,
Kevin D.
Dorfman
b and
Han
Cao
a
aBioNano Genomics, 9640 Towne Centre Drive, Ste 100, San Diego, CA 92121, USA. E-mail: jreifenberger@bionanogenomics.com
bDepartment of Chemical Engineering and Materials Science, University of Minnesota – Twin Cities, 421 Washington Ave. SE, Minneapolis, MN 55455, USA
First published on 15th May 2015
Abstract
We present experimental data concerning potential topological events such as folds, internal backfolds, and/or knots within long molecules of double-stranded DNA when they are stretched by confinement in a nanochannel. Genomic DNA from E. coli was labeled near the ‘GCTCTTC’ sequence with a fluorescently labeled dUTP analog and stained with the DNA intercalator YOYO. Individual long molecules of DNA were then linearized and imaged using methods based on the NanoChannel Array technology (Irys® System) available from BioNano Genomics. Data were collected on 189![[thin space (1/6-em)]](https://www.rsc.org/images/entities/char_2009.gif) 153 molecules of length greater than 50 kilobases. A custom code was developed to search for abnormal intensity spikes in the YOYO backbone profile along the length of individual molecules. By correlating the YOYO intensity spikes with the aligned barcode pattern to the reference, we were able to correlate the bright intensity regions of YOYO with abnormal stretching in the molecule, which suggests these events were either a knot or a region of internal backfolding within the DNA. We interpret the results of our experiments involving molecules exceeding 50 kilobases in the context of existing simulation data for relatively short DNA, typically several kilobases. The frequency of these events is lower than the predictions from simulations, while the size of the events is larger than simulation predictions and often exceeds the molecular weight of the simulated molecules. We also identified DNA molecules that exhibit large, single folds as they enter the nanochannels. Overall, topological events occur at a low frequency (∼7% of all molecules) and pose an easily surmountable obstacle for the practice of genome mapping in nanochannels.
153 molecules of length greater than 50 kilobases. A custom code was developed to search for abnormal intensity spikes in the YOYO backbone profile along the length of individual molecules. By correlating the YOYO intensity spikes with the aligned barcode pattern to the reference, we were able to correlate the bright intensity regions of YOYO with abnormal stretching in the molecule, which suggests these events were either a knot or a region of internal backfolding within the DNA. We interpret the results of our experiments involving molecules exceeding 50 kilobases in the context of existing simulation data for relatively short DNA, typically several kilobases. The frequency of these events is lower than the predictions from simulations, while the size of the events is larger than simulation predictions and often exceeds the molecular weight of the simulated molecules. We also identified DNA molecules that exhibit large, single folds as they enter the nanochannels. Overall, topological events occur at a low frequency (∼7% of all molecules) and pose an easily surmountable obstacle for the practice of genome mapping in nanochannels.
Introduction
Genomic mapping is a method for obtaining large-scale genomic information at a range of 100 kilobases or greater from single molecules of DNA.1–4 The Irys® platform, available from BioNano Genomics, is able to generate genomic maps through nicking long DNA with Nt·BspQI, which recognizes a unique seven base sequence, GCTCTTC.5 The nick sites are then filled with a modified dUTP analog with an attached fluorescent probe, thereby generating a unique barcode pattern that corresponds to a specific location within the genome of the organism. Once labeled, the DNA backbone is stained with YOYO and electrophoretically loaded onto a chip with an array of nanochannels that linearize the DNA for imaging.6 The nanochannels confine the DNA, allowing for uniform stretching so that the barcode pattern can be reliably mapped to a reference or de novo assembled.4,7,8 The Irys system works by inserting labels by a nick protocol, but it is also possible to obtain coarse-grained genomic data by modifying the binding affinity of YOYO.9,10The Irys platform is capable of imaging thousands of molecules per electrophoresis loading cycle, generating roughly 30× coverage for a human sized genome using the currently available V2 chip in a 24-hour period. Fig. 1a is a false-colored image of the combined YOYO-stained DNA (blue) and the Nt·BspQI-labeled nick sites (green) from a typical imaging scan after loading. For the present analysis, we collected and processed 189153 molecules of DNA greater than 50 kilobases from E. coli MG1655 genomic DNA on an older V1 chip, which has far fewer channels than the current V2 chip, but has the same channel sizes and pillar structures for loading DNA.
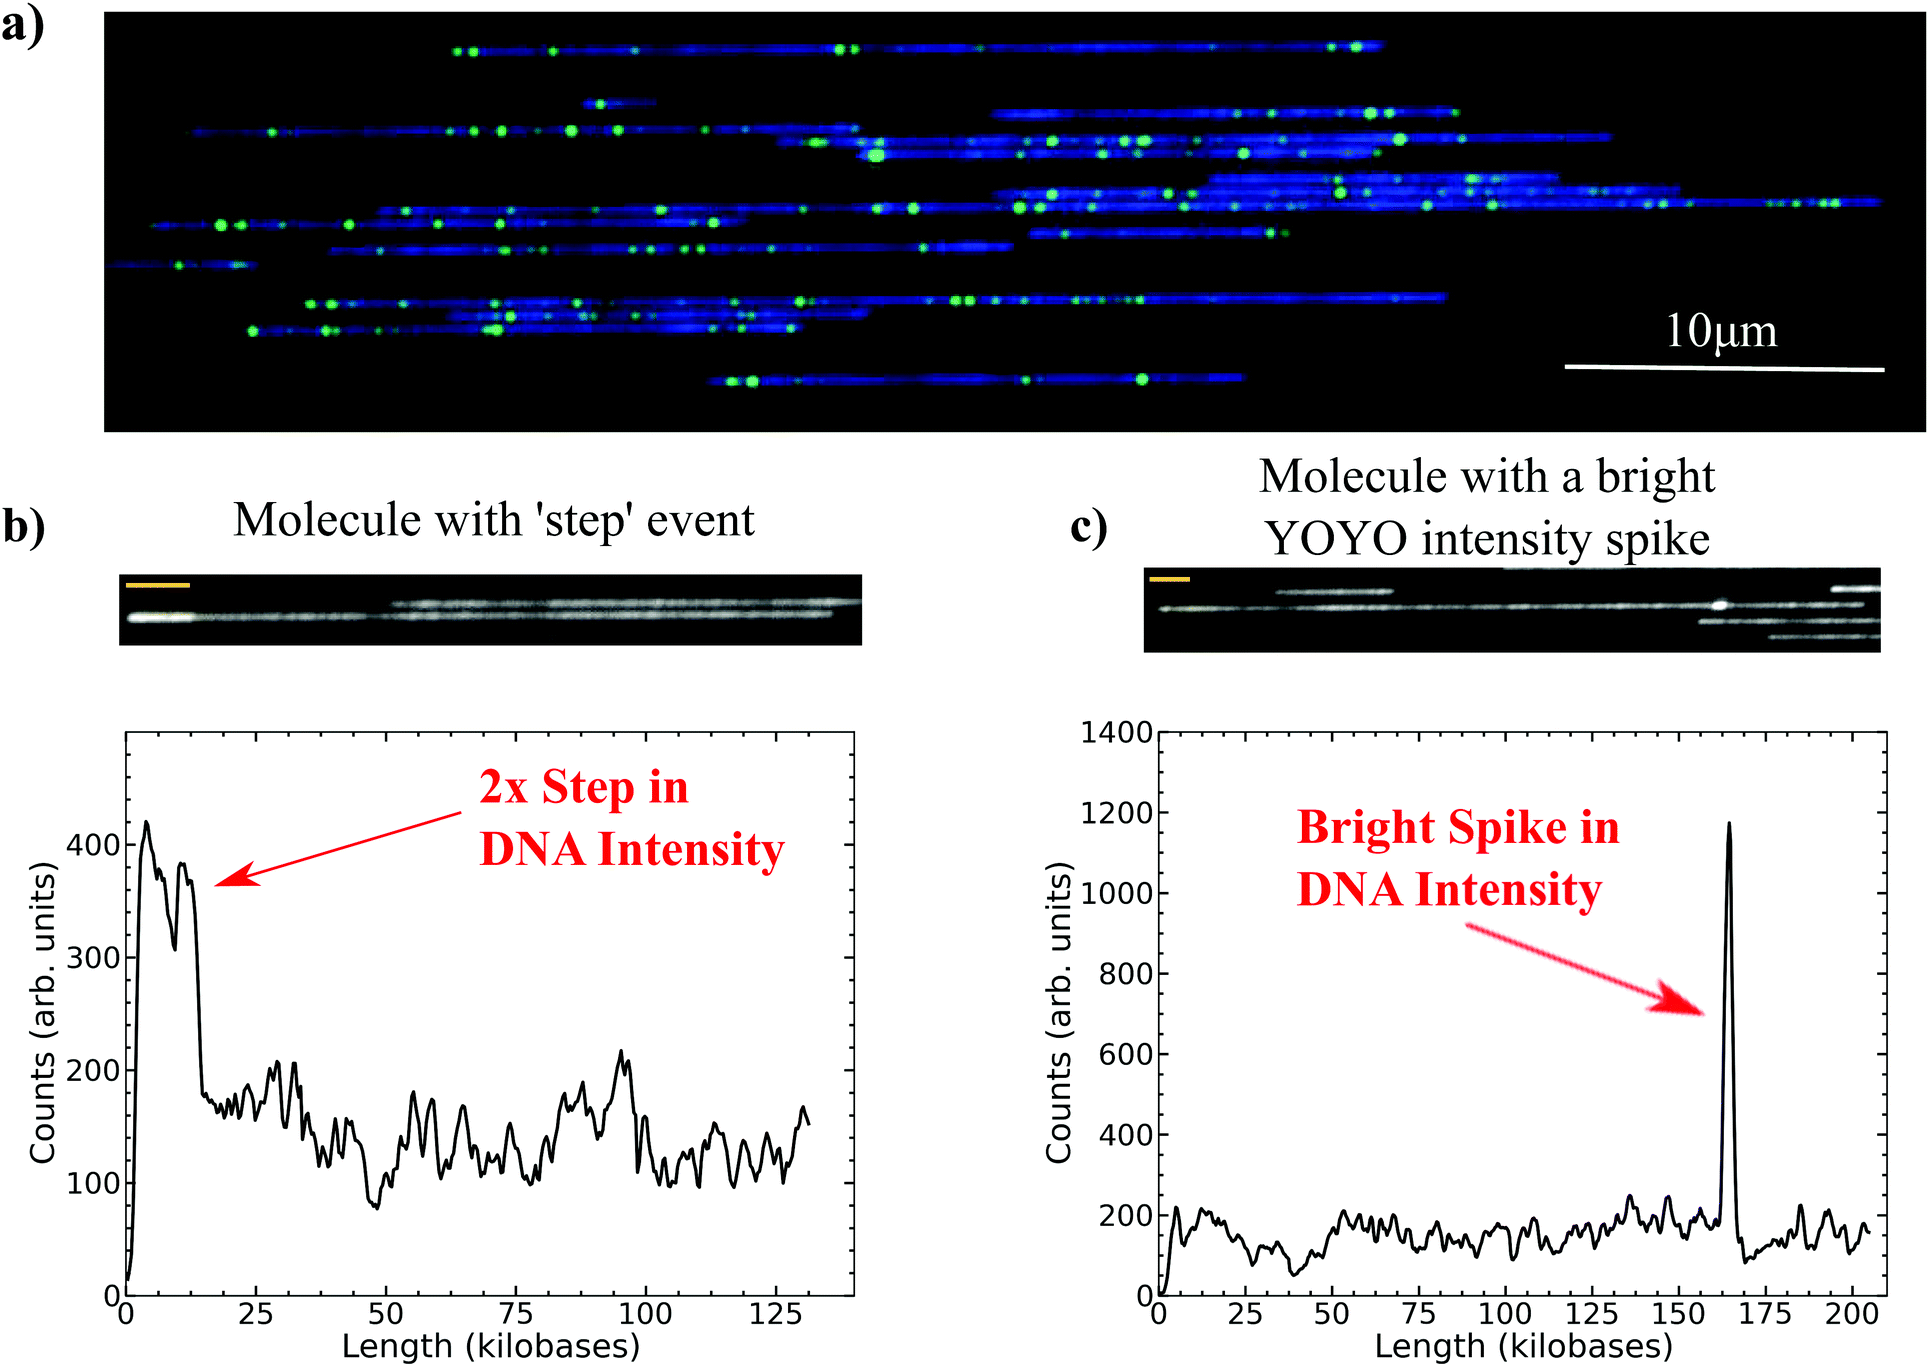 | ||
| Fig. 1 Example of long DNA stretched in nanochannels. (a) A composite image in false color with Nt·BspQI nicks in green, individual long DNA molecule backbones in blue. (b) An image with corresponding YOYO backbone intensity trace of a ‘step’ event. (c) An image and corresponding YOYO intensity trace of a molecule with a small but bright spike in the YOYO intensity. The yellow bars in the molecule images in (b) and (c) correspond to 4 μm. | ||
In the standard protocol for genome mapping in nanochannels the YOYO image is only used to correlate individual molecules with their respective barcode pattern.1,2,4 In the work presented here, the intensity profile for the YOYO signal along the length of the molecule was processed with a custom code to search for abnormal spikes or steps in the profile. Fig. 1b and c demonstrate two such examples of the types of intensity variations along the YOYO backbone that the code identified for further analysis. The first event, Fig. 1b, is a step with roughly 2× the brightness of the surrounding molecule and the second event, Fig. 1c, is a very bright spike that occurs over a relatively small distance. These anomalous intensity events, once flagged, were then correlated with the barcode alignment to the reference to identify particular regions of the genome that might be responsible for the anomalous YOYO intensity. By utilizing the information of the relative brightness of the YOYO intensity spike and then correlating the alignment of labels flanking the event with abnormal stretch in the molecule or extra insertions in the reference, we were able to categorize these events as folds and knots/backfolds. These are rare events, but the high throughput of the Irys system allowed us to analyze a large number of molecules, thereby obtaining statistics on the frequency and size of the YOYO intensity events as well.
Identifying and characterizing such instances of non-uniform stretching is useful in genomic mapping. The main focus of DNA mapping from a biological perspective is to generate long-range information for a particular genome to search for events such as deletions, insertions, duplications, inversions, etc. that next generation sequencing methods often struggle to identify.11–14 Topological events in individual molecules of DNA such as knots or backfolds could mimic a deletion in the reference, which would add an extra noise parameter to the data, potentially resulting in a false call. Folds in the DNA may also add extra labels in a particular region and therefore appear as an insertion event in the reference. If topological events are rare, then their effect will be reduced by higher coverage. However, the data on their frequency obtained here provide a needed boundary on the sensitivity of structural variation calls at low coverage or within heterogeneous population studies.
There has also been significant interest in the formation of knots and folds from a polymer physics perspective. It will prove illuminating to determine to what extent insights obtained from simulations of short DNA at equilibrium can be applied to the practical circumstances used in genome mapping, which necessitate high-throughput processing of very long DNA. Genome mapping takes place in channels with cross-sectional widths that are commensurate with the persistence length of DNA in a high ionic strength buffer. These channels thus lie between the blob regimes described by de Gennes and others15–19 and the linearly ordered deflection segments described by Odijk.20 Owing to the relatively strong excluded volume between deflection segments of double-stranded DNA, measured by the z-parameter for a hairpin,21 substantial backfolding is unlikely to occur.22,23 Nevertheless, there is certainly a possibility of occasional backfolding of the DNA,22,23 consistent with our recent experimental observations of a skew-left probability distribution for the distance between barcodes.24 Moreover, static25 and dynamic26 simulations suggest that knotting occurs in confined chains, and other simulations indicate the formation of S-loops for DNA in channels of this size.18 Thus, it behooves us to make a systematic experimental investigation of these phenomena in channels close to the persistence length. As our experimental approach takes advantage of the Irys genome mapping system, we are necessarily limited to channel sizes that can be used for genome mapping. Nevertheless, our data represent the first large-scale study of DNA knotting/folding in nanochannels and thus provide an important benchmark for evaluating theories and simulation data.
Materials and methods
Sample preparation and genomic mapping in nanochannels
Sample preparation is outlined in previously published work.1–4,24 Briefly, cells from the MG1655 strain of E. coli were cultured and embedded in gel plugs. DNA was extracted from the embedded cells through an incubation step in lysis buffer then treated with proteinase K at 50 °C for 4 hours followed by several wash steps to remove cell debris. The plugs were solubilized and the extracted DNA was subjected to four hours of drop dialysis. DNA was labeled according to commercial protocols using the IrysPrep Reagent Kit (BioNano Genomics, Inc.), which nicks the DNA with the endonuclease Nt·BspQI. Nick sites were labeled with a fluorescent-dUTP analog using Taq polymerase. The fluorophore has spectral characteristics similar to cy3. This procedure allows for the incorporation of more than one fluorophore per nick site. Once the labels are incorporated, the backbone of the DNA was stained with YOYO-1. Samples were stained overnight, typically longer than 12 hours at room temperature, with a ratio of 1 YOYO per 37 basepairs. After staining the sample was often stored at 4 °C for several days before data was collected. This ensured that the DNA was uniformly stained with YOYO as Life Technologies suggests complete staining at room temperature after 1 hour. Experiments by Nyberg et al.27 also indicate that the heterogeneity in staining at a similar dye ratio is greatly reduced at 24 hours.Data were collected on two systems. The first system was a custom-built epifluorescence microscope that is similar to the Irys system developed by BioNano Genomics and described in a publication by Reinhart et al.24 The second system was the commercial Irys system available from BioNano Genomics. The custom and commercial instrument are very similar in terms of lasers (both use a Sapphire 532 nm, 200 mW/300 mW and OBIS 488 nm, 150 mW laser from Coherent), emission filters (525/50 band pass filter for the YOYO and 579/34 band pass for the label from Semrock), filter wheel (Finger Lakes Instrumentation High Speed Filter Wheel), xy-stage (from Applied Scientific Instrumentation), but differ in several key areas. The custom-built research microscope uses an IX-71 microscope body, an Olympus 60× air objective with a numerical aperture of 0.9, and images are collected with a Zyla 5.5 sCMOS camera from Andor. Hardware control and data collection were performed with micromanager.28 The commercial system has a custom-built housing that supports an Olympus 100× NA 1.4 oil objective and images are collected with an iXON EMCCD from Andor. These differences result in the research system having slightly better resolution per pixel, 108.3 nm versus 160 nm with magnification, than the commercial system. Data collected on the custom built microscope and the Irys system yield similar results in terms of error rates, detection of features, size of features, map rates, etc., so all data shown in subsequent figures are the combination of data obtained in both systems.
A version 1 chip available from BioNano Genomics was used with the E. coli sample. DNA was loaded into the nanochannels with a custom electrophoresis script available on the commercial Irys platform. The nanochannels have a square profile and typically vary in size from 40 nm × 40 nm to 50 nm × 50 nm. Once DNA was loaded into the nanochannels it was imaged at each position within the nanochannel array with the 532 nm and 488 nm lasers for 150 ms to obtain the label pattern and individual molecule positions within the nanochannels. To obtain the conversion from pixels to basepairs, the interlabel distances measured in pixels from the aligned molecules are compared to the expected distance in base pairs allowing for the calculation of an average conversion factor of bp/pixel.
Individual reads were mapped to the MG1655 E. coli reference using a custom algorithm from BioNano Genomics that follows published procedures.29 A pre-alignment filter step was applied requiring molecules to be greater than 50 kilobases and have a minimum of 5 labeled nick sites. The alignments of molecules whose p-value was less than 10−4 were kept for further analysis. Each nick site often contains several fluorescently-labeled dUTP incorporation events, which emit roughly 1000–3000 photons during the 150 ms imaging time. This results in a localization of the point-spread function from the emitting fluorophores of roughly 4–9 nm depending on the brightness of the individual sites.30–32
Data processing: searching for intensity fluctuations
Images were processed with a custom image processing code, DM-static, written in C++ and available from BioNano Genomics. The code is capable of detecting molecules in the blue laser channel (YOYO-stained backbone) and labels in the green laser channel (barcode pattern). The code pairs detected labels with their respective molecules, resulting in a text file with (x, y) coordinates for each label along the molecule. DM-static also outputs the intensity profile along the backbone of the DNA molecule.A second custom code written in python stepped through the YOYO intensity profile in 3 pixels bins (roughly 1000 base pairs) and compared the previous 3 pixel intensity values with the subsequent 3 pixel intensity values with a standard T-test (see Fig. S1 in ESI†). The T-test determined if the intensity values in the neighboring bins were the same or different. If called different then the 3 pixels bins were kept separate. If called the same, then the 3 pixels bins were grouped together resulting in a new 6 pixel bin. The process continued along the length of the molecule dividing it into many different subgroups based on regions of similar intensity. Once this process was finished, the average intensity was calculated for each subgroup identified by the T-test and a new molecule intensity trace was generated based upon the average intensity values for each sub group of pixels. This smoothed out the backbone intensity, which was very noisy. After the T-test was finished and the new, smoother intensity trace was generated, a hierarchical clustering algorithm was applied to the new profile and searched for significant intensity variations. The molecules were flagged if a significant intensity fluctuation was identified and its position within the molecule tracked for future analysis.
The relative intensity of the flagged YOYO spike regions for each molecule was calculated as the ratio of the summed YOYO intensity over the size of the event to the summed YOYO intensity of the same-sized adjacent ‘normal’ region within the molecule, i.e. relative intensity of event = total counts of event/total counts of ‘normal’ region of the same size (see Fig. S2a within the ESI†). After molecules were flagged as having a YOYO intensity event, molecules were then aligned to the reference. The size of each YOYO event was measured after the alignment of the molecules to the reference. Once aligned to the reference the base pairs per pixel was calculated by comparing the distance between aligned labels in the reference to the measured values in pixels. This allowed for ‘step’ events to be sized by measuring the length in pixels of the step and converting to base pairs. Spike events were sized by measuring the distance between labels in pixels, converting to base pairs, and comparing to the expected distance based on their alignment to the reference (see ESI Fig. S3†).
Results
Types of features
The total data set consisted of 189153 molecules whose lengths were greater than 50 kilobases. The T-test search algorithm flagged 7.2% of these molecules as having an intensity fluctuation in the YOYO backbone of the DNA. Fig. 2a is a histogram of the relative position, i.e. the distance from the leading edge of the molecule relative to the total length of the molecule, of the identified YOYO intensity events (see Fig. S2b within the ESI†). The leading edge corresponds to the first edge of the molecule to enter into the nanochannel. Over 50% of the events (4644/9004) are detected in the first 5% of the total length of the leading edge of a molecule. The rest of the events are distributed fairly evenly throughout the molecule with a slight increase near the trailing edge of the molecule. As shown in Fig. 2b, the relative intensity of the YOYO backbone fluctuations depends on its location within the molecule. The relative intensity of events located near the leading edge of the molecule (blue dots) was roughly double the intensity of an adjacent region in the molecule of similar size. This suggests that the events near the leading edge of the molecule were small folds in the DNA.
 | ||
| Fig. 2 (a) The relative position histogram of a YOYO intensity event. Relative position is the location of the event from the leading edge of an individual molecule relative to the total length of the molecule. The bin size is 0.025. (b) A histogram of the probability density of the YOYO fluctuation events. The two populations shown are split based on the relative position of the event within the molecule, leading edge versus everywhere else. Due to the large number of events at the leading edge, each population (leading edge and elsewhere) was normalized to one so that they could be plotted together as probability densities. The bin size is 0.2. | ||
The features located elsewhere in the molecule (red dots in Fig. 2b) show a distribution of features with nearly 3.3× the intensity of an adjacent region in the molecule of similar size. These events are likely either a knot or a backfold within the DNA molecules. Unfortunately there is no way to determine the difference between a knot or a backfold based on the intensity; Fig. 3 demonstrates the difficulty in calling a knot or a backfold based solely on the relative intensity. Unfortunately, both events will lead to a spike in the YOYO intensity that is roughly triple the intensity of the surrounding normal region. It is possible that the tail in the intensity profile of Fig. 2b corresponds to complicated knots, which would give rise to a YOYO fluorescence per unit length within the knot that exceeds 3×.
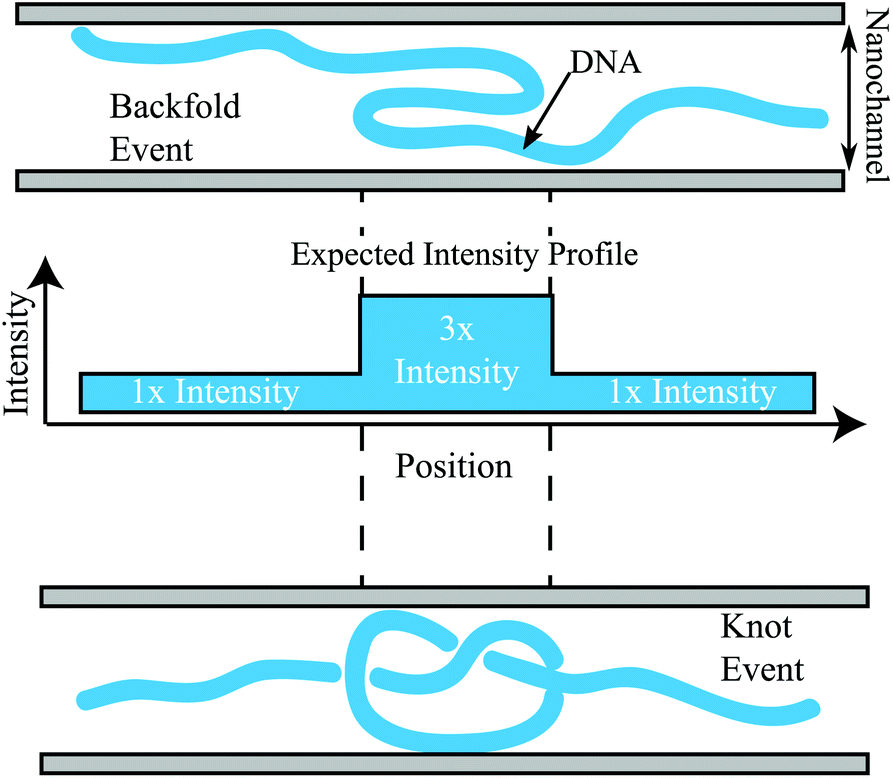 | ||
| Fig. 3 An illustration of a backfold (top), a trefoil knot event (bottom), and the corresponding YOYO intensity profile (middle). A DNA molecule is shown as a thick blue line and the boundary of the nanonchannel as the adjacent grey bars. The middle intensity profile demonstrates the YOYO intensity contributed by different parts of each DNA strand within either a knot or a backfold. Both events would be roughly 3× the intensity of the surrounding region. Note that a more complicated knot would give rise to a higher intensity profile. | ||
Folds and knots/backfolds can be further visualized with their DNA barcode by analyzing the alignment of the molecules to the reference. For example, Fig. 4a shows the alignment of a molecule with a knot/backfold present. The green top bar is the E. coli reference and bottom blue bar is an individual molecule that was identified as having a bright feature located at the red dot. The alignments of the labels after the feature are clearly shifted ∼13500 basepairs with regards to the reference. As a second example, Fig. 4b demonstrates that a folded region, identified with purple arrows, will generate insertions, highlighted in red, that do not align to nick sites of the reference. The molecule can be “unfolded” resulting in the labels appearing in the correct position upstream in the reference.
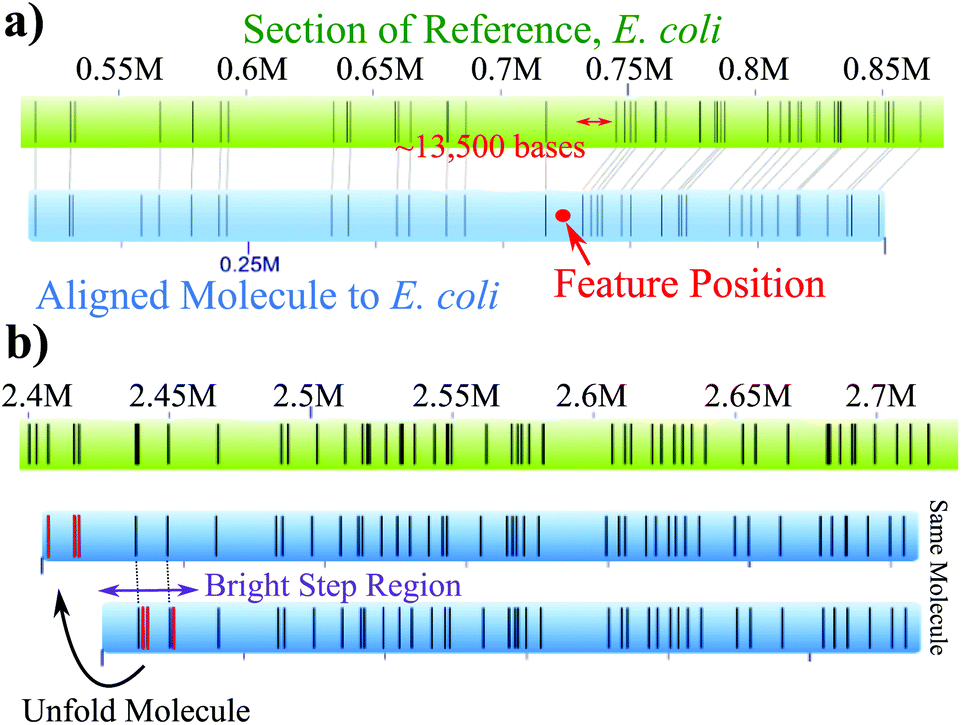 | ||
| Fig. 4 (a) An example of a knot/backfold in an aligned molecule, blue, to the E. coli reference, green. The labels are shifted roughly 13500 base pairs after the intensity spike (position in molecule shown in red). (b) An example of a folded region, highlighted by the purple arrow, within a molecule. The red insertion events do not align to the reference until the molecule is “unfolded”. | ||
Fig. 4 makes it clear that useful information about the anomalously bright features is obtained by aligning the molecules to the reference genome. However, it can be difficult to align molecules containing a bright YOYO feature; molecules with such features align to the reference genome 53% of the time compared to 80% of the time for molecules identified as having no YOYO intensity features present. To facilitate the use of the barcode information in our analysis, each molecule with an intensity feature was artificially split into two “pseudo-molecules” to remove the suspect feature from interfering with the alignment to the reference. Each of these pseudo-molecules was still required to be greater than 50 kB, contain at least 5 labels, and align to the reference with a p-value less than 10−4. See Fig. S3, in the ESI,† for a diagram of this procedure. As we might expect, the alignment rate for the pseudo-molecules (64%) is between that for molecules with bright features and those without such features.
The alignments of the pseudo-molecules could be categorized into four groups (see Table 1). The first group of pseudo-molecules aligned at a distance greater than 100 kilobases apart, while a second group aligned in the opposite orientation to each other when split. These first two groups suggest that while the automated image process in DM-static identified the DNA as one molecule in the nanochannel, in fact there were two separate molecules in the channel that slightly overlapped, creating what appeared to be one molecule with an intensity spike in the YOYO at the crossing point. The third group of molecules had only one of the split pseudo-molecules align to the reference. These are mostly from the molecules with a fold at their end; since the feature was at the leading edge, there was not a second molecule that met our pre-alignment filter for the size and number of labels to actually align to the reference. Some knots/backfolds less than 50 kilobases from either end of the molecule would also generate a single alignment, as the second piece of DNA would be too small to align. Finally, the fourth group of molecules had both ends align to the reference at a distance less than 100 kilobases apart in the same orientation. These are the events that were used to size the knots/backfolds. While the alignment rate increased for the pseudo-molecules, there were still 36% of them that did not align to the reference and these molecules were not used to size the folds or backfolds/knots.
| # of pairs aligned >100 kB apart | # of pairs aligned in opposite orientation | # pairs aligned with only one end | # pairs aligned with both ends, same orientation |
|---|---|---|---|
| 154 | 131 | 6794 | 1135 |
Sizing the features
The method for determining the size of the event depends on whether the feature was classified as a fold or a knot/backfold based on the relative YOYO intensity (see Fig. 2b). If the event was classified as a fold, then the size of the event was measured in pixels and converted to basepairs. The conversion of pixels to basepairs is calculated from the alignment of the molecules to the reference. Fig. 5a is a histogram of measured fold sizes with a bin size of 2 kilobases. There is a large peak at roughly 2.3 kilobases corresponding to 25% of the folded molecules, suggesting that a lot of the folds are quite small (i.e. less than 3 kB). After 6 kilobases there are a population of folds that are much bigger peaking around 10 kilobases, but rapidly decay in size at lengths greater than 10 kilobases.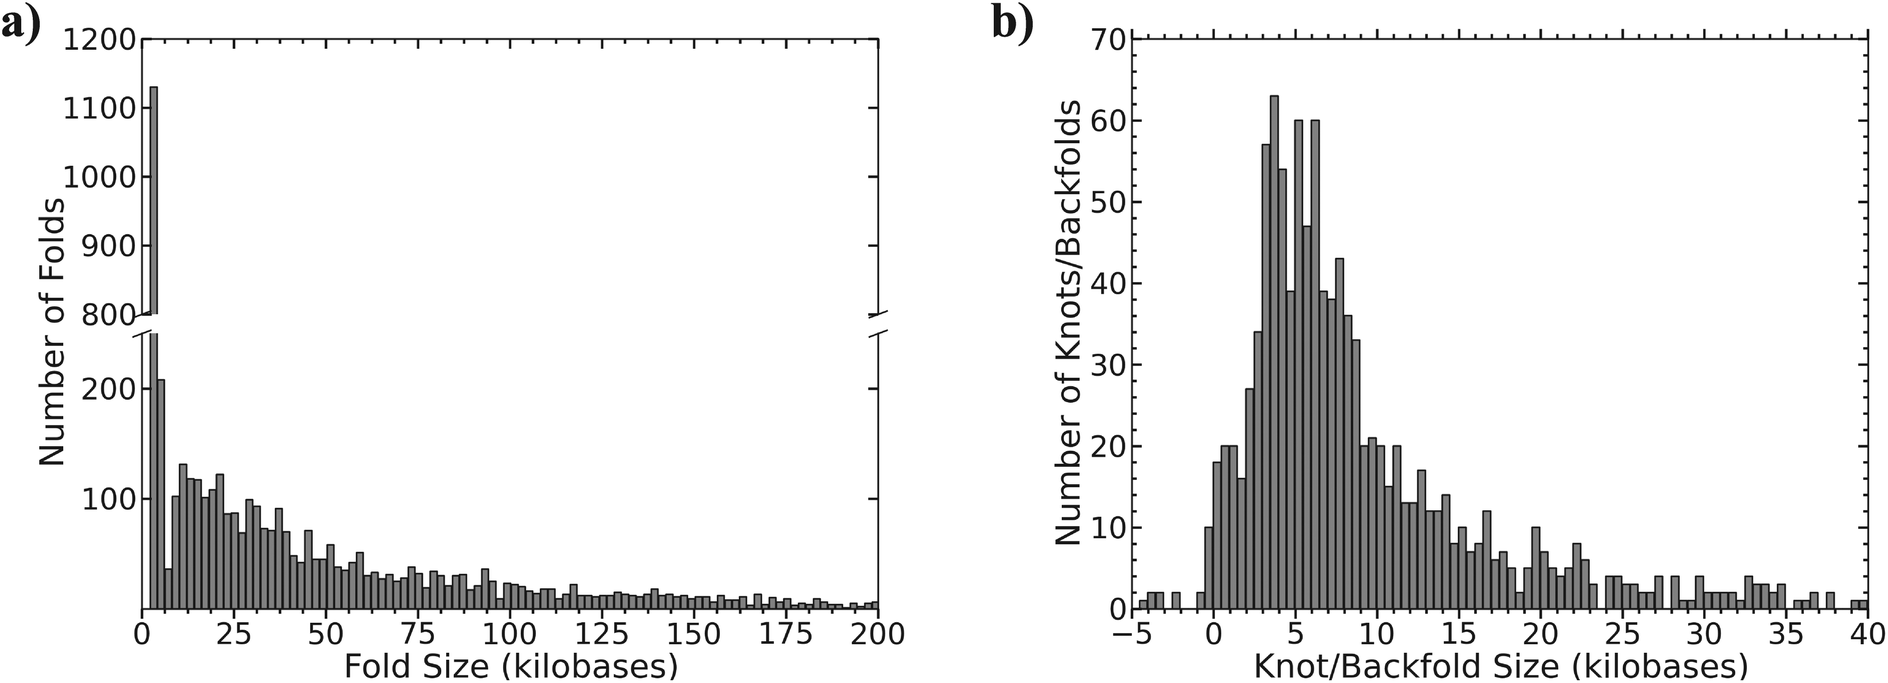 | ||
| Fig. 5 (a) Histogram of the size of the measured folds; bin size is 2 kilobases. (b) Histogram of the size of the measured knot/backfolds, bin size is 0.5 kilobases. | ||
The molecules identified as knots/backfolds based on a relative intensity of 3 were sized based on the pseudo-molecules that aligned to the reference (see ESI Fig. S3†). Once each pseudo-molecule was independently aligned, the distance between the labels flanking the feature was measured in pixels and compared to the expected distance based on the reference. Fig. 5b is a histogram of the size of the identified knot/backfold events based on the difference between the expected and measured distances. The distribution is broad with a peak centered near 5 kilobases. Sizes that are negative are most likely due to misalignments of the flanking labels and are fortunately very rare.
Discussion
Our data support the existence of two distinct types of topological events: (i) small folds at the end of the molecule, typically less than 10 kB, with a YOYO intensity profile roughly double that of the stretched DNA and (ii) knots or backfolds in the interior of the molecule, with a broad distribution of sizes centered around 5 kB and a YOYO intensity profile more than triple that of stretched DNA. The knot/backfold distribution also exhibits a relatively fat tail towards high relative intensities, which may reflect the formation of complicated knots.It is clear that a substantial number of events that are classified as folds are generated as the DNA is inserted into the nanochannels. This effect has been observed by J.T. Mannion et al.33 and S. Levy et al.34 in larger channels without the use of a pillar structure at the inlet, and we are clearly witnessing the same event in a somewhat different system. One of the key results of the previous studies33,34 concerns the dynamics of unfolding of DNA in nanochannels. We do not have equivalent data from our experiments. The high-throughput operation of the Irys system is based on raster-scanning the chip to obtain nearly simultaneous images of the barcode labels and the backbone at each position in the device.2 The tradeoff for such high-throughput operation, which yielded almost 200000 molecules for the present study, is the absence of the temporal data used by others33,34 to observe unfolding events.
Since we do not have dynamic data, the frequency of the folds in our experiments needs to be understood in context of the measurement time. In particular, it is extremely unlikely that the number of folds is measured at thermodynamic equilibrium, and it is also unlikely that the number of folds is measured in a kinetically trapped state. Since the rate of folding inside the channel is extremely slow compared to the rate of unfolding, many of these folds could be removed simply by waiting longer. Indeed, if we waited long enough, we would expect the system to be kinetically trapped in a state where the number of folds is much lower than observed in Fig. 2a. Likewise, it is likely that there were more folds immediately after loading the DNA than the number reported in Fig. 2. Moreover, DNA with longer residence time in the channel before imaging will have fewer folds. From a practical standpoint for genome mapping, there is little gained by waiting for DNA to unfold since the reduced throughput (molecules analyzed per unit time) is not offset by the increased amount of useful data obtained by letting the DNA unfold. Thus, we should view the data obtained here as the number of folds in the practical situation where DNA injection into nanochannels is used for genome mapping.
While the folded DNA data seem easily explained and consistent with previous results for DNA injection into larger nanochannels, the situation surrounding knotting and backfolding is less clear. Unfortunately we are unable to separate backfolds from knots in the DNA, as both events will have similar relative intensity profiles and abnormal stretching between flanking labels if the knots are trefoil, which seems the most likely case.25,26 We suspect that we are likely seeing both knots and backfolds. Fig. 2a shows that the position of these events is fairly uniform along the molecule with a slight increase near the trailing edge. It is likely that the slight pile up near the trailing edge are mostly knots, as a knot could diffuse down the length of the molecule as it is moving in the nanochannel but may have a kinetic trap at the end of the molecule to remove the knot.26 While the distribution of events in the middle of the molecule are probably backfolds,23 this cannot be confirmed from our data.
It is illuminating to consider our results in the context of simulation data supporting the presence of knots or S-loops for DNA in nanochannels.23,25,26 Our aim here is not to provide a definitive test of these simulation results, which correspond to relatively small molecules (a few kB) at equilibrium. Rather, we are simply interested to see if these equilibrium simulation results are applicable to the practical situation of genome mapping, which requires high-throughput analysis. With this point in mind, there appear to be substantial differences between the frequency and size of knots/backfolds in our experimental data and the predictions from various types of simulations. The frequency of knots/backfolds observed in our experiments exceeds the predictions from recent dynamic simulations of DNA knotting in 50 nm nanochannels26 but appears to be substantially less than the circa 30% value predicted by Monte Carlo simulations of a 4.8 μm long DNA molecule.25 The typical size of our events in Fig. 5b is around 5 kB, which would correspond to 1.7 μm if we neglect any additional extension due to intercalation. The latter value is around 3 times larger than that predicted for trefoil knots in nanochannels.25 It is not easy to compare the frequency of knots/backfolds in our experiments to the frequency of S-loops predicted by Monte Carlo simulations of DNA in nanochannels.23 If we use a persistence length lp = 58 nm24 for DNA in the IrysPrep buffer, an effective width w = 10 nm24,35,36 and a channel size D = 50 nm, the ratio (D − w)/lp = 0.69 is below the minimum value studied in these Monte Carlo simulations. Inasmuch as the frequency of S-loops appears to be approaching a small (and possibly zero) value for small values of (D − w)/lp in the simulations, extrapolating the simulation data for these small molecules to lower (D − w)/lp and then scaling up to our circa 100 kB molecules is difficult. However, we can compare the size of the S-loop events in simulations23 to our data. The simulation data predict that the size of the S-loop events decreases with channel size, with a value of around 200 nm at the smallest values (D − w)/lp = 0.8 reported from the simulations. As was the case with knots, the amount of contour length stored inside of the topological events in our experiments again exceeds the predictions from simulations23 for S-loops.
Given the differences between genome mapping, where high-throughput using very large molecules is a necessity, and polymer simulations, which focus solely on the equilibrium behavior of relatively small chains, it should be unsurprising that our measurements of the size of the knots/backfolds differ from the predicted sizes from simulations. Whether simulations of larger molecules would increase the agreement with our experiments remains an open question. Indeed, it is not obvious a priori whether our experimental data, obtained under the conditions required for efficient genome mapping, will be in agreement with equilibrium simulations. In our experiments, the DNA are forced through a pillar array to pre-stretch them, which may reduce the number of knots/backfolds since the formation of S-loops and knots may be kinetically limited by the high friction in the channel and intramolecular repulsion. The simulations also assume that hard-core repulsion between the DNA and the walls, which may not be the case in experiments. In such small channels, the finite size of the double layers may necessitate using soft DNA-wall interaction potentials that account for the gradually increasing electrostatic repulsion as a segment of DNA approaches the walls.
Conclusion
We have presented a method to identify potential topological events in DNA based on intensity fluctuations along the YOYO backbone. These events, once flagged, were further analyzed by alignment to the reference genome, which confirmed either extra insertions at the site or abnormal under-stretching of the labels flanking the event. Overall, the results for folds at the end of the molecule are consistent with previous observations of DNA folding upon injection into a nanochannel,33,34 and the data for internal bright spots suggests the presence of both knots26 and backfolds.23The good news from a mapping perspective is that the topological events occur in about 7% of the observed molecules. Furthermore, due to the fact that many are small folds less than 3 kilobases near the leading edge of the molecule, they are likely to have no effect on mapping data from most genomes. The targeted label density is often near 10 labels per 100 kilobases and hence it is very unlikely for there to be more than one label in the folded region. Due to the lower mapping rate of suspect molecules, it is clear that the algorithms developed here are capable of filtering out any suspicious molecules containing topological events, thereby reducing the likelihood of them interfering in a de novo assembly.
Acknowledgements
This work was supported by the NIH (R01-HG006851). Jeffrey G. Reifenberger and Han Cao are employees of BioNano Genomics, which is commercializing the Irys platform for genome mapping.Notes and references
- A. R. Hastie, L. Dong, A. Smith, J. Finklestein, E. T. Lam, N. Huo, H. Cao, P.-Y. Kwok, K. R. Deal, J. Dvorak, M.-C. Luo, Y. Gu and M. Xiao, PLoS one, 2013, 8, e55864 CAS.
- E. T. Lam, A. Hastie, C. Lin, D. Ehrlich, S. K. Das, M. D. Austin, P. Deshpande, H. Cao, N. Nagarajan, M. Xiao and P.-Y. Kwok, Nat. Biotechnol., 2012, 30, 771–776 CrossRef CAS PubMed.
- M. O'Bleness, V. B. Searles, C. M. Dickens, D. Astling, D. Albracht, A. C. Y. Mak, Y. Y. Y. Lai, C. Lin, C. Chu, T. Graves, P.-Y. Kwok, R. K. Wilson and J. M. Sikela, BMC Genomics, 2014, 15, 387 CrossRef PubMed.
- H. Cao, A. R. Hastie, D. Cao, E. T. Lam, Y. Sun, H. Huang, X. Liu, L. Lin, W. Andrews, S. Chan, S. Huang, X. Tong, M. Requa, T. Anantharaman, A. Krogh, H. Yang, H. Cao and X. Xu, GigaScience, 2014, 3, 34 CrossRef PubMed.
- K. Jo, D. M. Dhingra, T. Odijk, J. J. de Pablo, M. D. Graham, R. Runnheim, D. Forrest and D. C. Schwartz, Proc. Natl. Acad. Sci. U. S. A., 2007, 104, 2673–2678 CrossRef CAS PubMed.
- S. K. Das, M. D. Austin, M. C. Akana, P. Deshpande, H. Cao and M. Xiao, Nucleic Acids Res., 2010, 38, e177 CrossRef PubMed.
- W. Reisner, J. N. Pedersen and R. H. Austin, Rep. Prog. Phys., 2012, 75, 106601 CrossRef PubMed.
- D. R. Tree, Y. Wang and K. D. Dorfman, Phys. Rev. Lett., 2013, 110, 208103 CrossRef.
- P. F. Østergaard, M. Matteucci, W. Reisner and R. Taboryski, Analyst, 2013, 138, 1249–1255 RSC.
- A. N. Nilsson, G. Emilsson, L. K. Nyberg, C. Noble, L. S. Stadler, J. Fritzsche, E. R. B. Moore, J. O. Tegenfeldt, T. Ambjörnsson and F. Westerlund, Nucleic Acids Res., 2014, 42, e118 CrossRef PubMed.
- J. M. Kidd, T. Graves, T. L. Newman, R. Fulton, H. S. Hayden, M. Malig, J. Kallicki, R. Kaul, R. K. Wilson and E. E. Eichler, Cell, 2010, 143, 837–847 CrossRef CAS PubMed.
- E. E. Eichler, R. A. Clark and X. She, Nat. Rev. Genet., 2004, 5, 345–354 CrossRef CAS PubMed.
- R. E. Mills, K. Walter, C. Stewart, R. E. Handsaker, K. Chen, C. Alkan, A. Abyzov, S. C. Yoon, K. Ye, R. K. Cheetham, A. Chinwalla, D. F. Conrad, Y. Fu, F. Grubert, I. Hajirasouliha, F. Hormozdiari, L. M. Iakoucheva, Z. Iqbal, S. Kang, J. M. Kidd, M. K. Konkel, J. Korn, E. Khurana, D. Kural, H. Y. K. Lam, J. Leng, R. Li, Y. Li, C.-Y. Lin, R. Luo, X. J. Mu, J. Nemesh, H. E. Peckham, T. Rausch, A. Scally, X. Shi, M. P. Stromberg, A. M. Stütz, A. E. Urban, J. A. Walker, J. Wu, Y. Zhang, Z. D. Zhang, M. A. Batzer, L. Ding, G. T. Marth, G. McVean, J. Sebat, M. Snyder, J. Wang, K. Ye, E. E. Eichler, M. B. Gerstein, M. E. Hurles, C. Lee, S. A. McCarroll and J. O. Korbel, 1000 Genomes Project, Nature, 2011, 470, 59–65 CrossRef CAS PubMed.
- E. R. Mardis, Nature, 2011, 470, 198–203 CrossRef CAS PubMed.
- M. Daoud and P. G. de Gennes, J. Phys., 1977, 38, 85–93 CAS.
- F. Brochard-Wyart, T. Tanaka, N. Borghi and P. G. de Gennes, Langmuir, 2005, 21, 4144–4148 CrossRef CAS PubMed.
- Y. Wang, D. R. Tree and K. D. Dorfman, Macromolecules, 2011, 44, 6594–6604 CrossRef CAS PubMed.
- L. Dai, C. B. Renner and P. S. Doyle, Macromolecules, 2014, 47, 6135–6140 CrossRef CAS.
- E. Werner and B. Mehlig, Phys. Rev. E: Stat., Nonlinear, Soft Matter Phys., 2014, 90, 062602 CrossRef CAS.
- T. Odijk, Macromolecules, 1983, 16, 1340–1344 CrossRef CAS.
- T. Odijk, Phys. Rev. E: Stat., Nonlinear, Soft Matter Phys., 2008, 77, 060901 CrossRef.
- A. Muralidhar, D. R. Tree, Y. Wang and K. D. Dorfman, J. Chem. Phys., 2014, 140, 084905 CrossRef PubMed.
- L. Dai, S. Y. Ng, P. S. Doyle and J. R. C. van der Maarel, ACS Macro Lett., 2012, 1, 1046–1050 CrossRef CAS.
- W. F. Reinhart, J. G. Reifenberger, D. Gupta, A. Muralidhar, J. Sheats, H. Cao and K. D. Dorfman, J. Chem. Phys., 2015, 142, 064902 CrossRef PubMed.
- C. Micheletti and E. Orlandini, Soft Matter, 2012, 8, 10959–10968 RSC.
- C. Micheletti and E. Orlandini, ACS Macro Lett., 2014, 3, 876–880 CrossRef CAS.
- L. Nyberg, F. Persson, B. Åkerman and F. Westerlund, Nucleic Acids Res., 2013, 41, e184 CrossRef CAS PubMed.
- A. Edelstein, N. Amodaj, K. Hoover, R. Vale and N. Stuurman, Computer Control of Microscopes Using μManager, John Wiley & Sons, Inc., Hoboken, NJ, USA, 2010 Search PubMed.
- A. Valouev, Shotgun optical mapping: a comprehensive statistical and computational analysis, University of Southern California, 2006 Search PubMed.
- R. E. Thompson, D. R. Larson and W. W. Webb, Biophys. J., 2002, 82, 2775–2783 CrossRef CAS.
- N. Bobroff, Rev. Sci. Instrum., 1986, 57, 1152–1157 CrossRef PubMed.
- A. Yildiz, J. N. Forkey, S. A. McKinney, T. Ha, Y. E. Goldman and P. R. Selvin, Science, 2003, 300, 2061–2065 CrossRef CAS PubMed.
- J. T. Mannion, C. H. Reccius, J. D. Cross and H. G. Craighead, Biophys. J., 2006, 90, 4538–4545 CrossRef CAS PubMed.
- S. L. Levy, J. T. Mannion, J. Cheng, C. H. Reccius and H. G. Craighead, Nano Lett., 2008, 8, 3839–3844 CrossRef CAS PubMed.
- D. Stigter, Biopolymers, 1977, 16, 1435–1448 CrossRef CAS PubMed.
- C.-C. Hsieh, A. Balducci and P. S. Doyle, Nano Lett., 2008, 8, 1683–1688 CrossRef CAS PubMed.
Footnote |
| † Electronic supplementary information (ESI) available. See DOI: 10.1039/c5an00343a |
| This journal is © The Royal Society of Chemistry 2015 |