
Selective electrochemical determination of cysteine with a cyclotricatechylene modified carbon electrode
Patricia T.
Lee
a,
James E.
Thomson
b,
Athanasia
Karina
b,
Chris
Salter
c,
Colin
Johnston
c,
Stephen G.
Davies
b and
Richard G.
Compton
*a
aDepartment of Chemistry, Physical and Theoretical Chemistry Laboratory, University of Oxford, South Parks Road, Oxford, OX1 3QZ, UK. E-mail: richard.compton@chem.ox.ac.uk
bDepartment of Chemistry, Chemistry Research Laboratory, University of Oxford, Mansfield Road, Oxford, OX1 3TA, UK
cDepartment of Materials, University of Oxford, Begbroke Science Park, Begbroke Hill, Woodstock Road, Oxford, OX5 1PF, UK
First published on 14th November 2014
Abstract
We report the selective electrochemical detection of cysteine in the presence of homocysteine and glutathione with the use of an electrode modified with cyclotricatechylene (CTC). A carbon electrode was first modified with cyclotriveratrylene (CTV) and then electrochemically converted into CTC. Using cyclic voltammetry, the redox activity of CTC was investigated along with its electrochemical response to cysteine and the closely related compounds, glutathione and homocysteine which are commonly found in biological media alongside cysteine. The selective detection of cysteine was achieved with the use of the electrocatalytic oxidation reaction and exploiting the different rates of reaction of each thiol with the oxidized CTC via variable scan rate studies. The analytical parameters consisting of sensitivity, range of linear detection, and limit of detection were determined for selective cysteine detection in phosphate buffer solution and tissue culture media where the sensitivity of the system is ca. 0.023 μA μM−1 and ca. 0.031 μA μM−1 with a limit of detection of ca. 0.6 μM and ca. 0.9 μM for buffer solution and tissue culture media respectively. Practical assessment of this analytical method was carried out in mixed solutions containing a combination of cysteine, homocysteine and glutathione in both media. The determined results agree well with the added cysteine content. This work presents a novel way of utilizing CTC into detecting cysteine, and is well-suited for bio-marker sensing.
1. Introduction
Cysteine (Cys), Fig. 1a, is a thiol-containing molecule that has an important role in cellular metabolism and antioxidation protection.1,2 Changes in cysteine levels have been recognized to have biological importance as they may have implications for arteriosclerosis,1,3 leukemia,2 and cancer.4–14 Therefore, careful monitoring of cysteine concentration in physiological samples such as plasma, urine, and saliva can serve as a valuable biomarker in clinical applications, as cysteine can be is typically seen ranging from 5 μM to 30 μM in these fluids.1,2,4–6,15,16 There are many methods developed for cysteine determination which include high performance liquid chromatography (HPLC),6,17–19 spectrophotometry,13,19,20 gas chromatography paired with mass spectrometry,21 and electrochemistry.3,7,17,22–28 From the methods listed, electrochemistry offers many potential advantages in a form of point-of-care sensor system, as it can be fast, cheap, and easy to use.29,30 However, reports have shown that selective detection of cysteine becomes a challenging task as the direct oxidation of cysteine at a bare solid electrode gives a poor voltammetric response22 or with the use of redox mediators, it is difficult to differentiate between similarly structured thiols.2,31 Therefore, a selective detection of cysteine in samples containing its homologue compounds such as homocysteine and glutathione would be advantageous. To have value in biomarker studies concentrations at the order of 1–10 μM need to be sensed.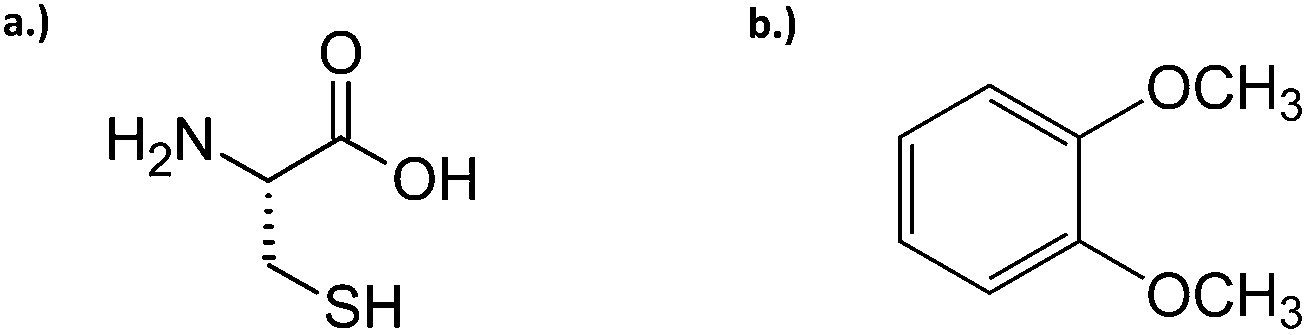 | ||
| Fig. 1 Chemical structures of (a) L-cysteine and (b) veratrole. | ||
Cyclotriveratrylene (CTV), shown in Scheme 1, is a cyclic trimer of veratrole (Fig. 1b) which consists of three aromatic rings, each bearing two methoxyl substituents that are separately fused to a cyclononatriene ring.32,33 CTV itself has newly gained attention in recent years in the field of supramolecular chemistry, as the number of analogues grows with potential applications in sensors, soft materials, and separations.32,34 One related species in particular is cyclotricatechylene (CTC) (also depicted in Scheme 1). As CTV can undergo an electrochemical activation to form CTC, the tris-catechol analogue is potentially interesting to the electrochemical community as the catechol groups are redox active and the quinone/hydroquinone system is well placed to mediated electron transfer and engage in potentially selective reaction.35,36 There is limited literature on the electrochemistry of CTC based derivatives,36in situ generation of CTC from CTV modified electrode and no literature on the redox chemistry of CTC alone. The present paper reports on the novel use of CTC in the selective detection of cysteine in the presence of other thiols using electrochemical methods.
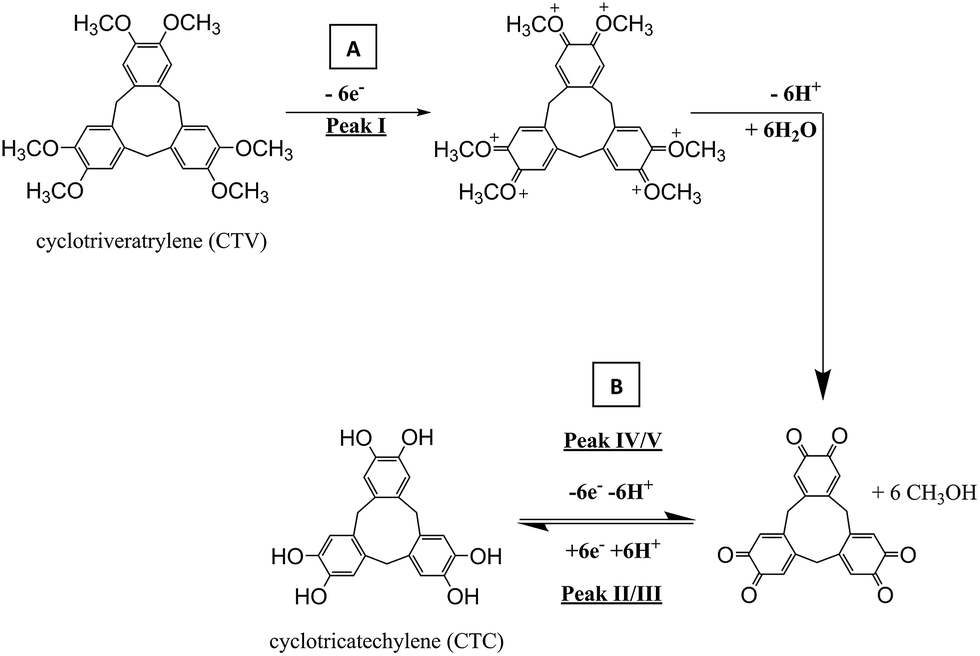 | ||
| Scheme 1 Demethylation of cyclotriveratrylene (CTV) to form cyclotricatechylene (CTC). | ||
The basis of cysteine detection with CTC is essentially a quinone–thiol interaction via electrocatalytic oxidation reaction which has been widely studied.2,15,25,37–40 Shown in Scheme 2, an electrocatalytic oxidation reaction is where the 1,2-dihydroxyquinone is oxidized forming an o-benzoquinone which then can mediate the oxidation of the thiol compound to produce a disulfide.23,37,41 Afterwards, the o-benzoquinone can then be electrochemically regenerated by electrons from the electrode, where the catalytic amperometric current can be monitored.15,37 Due to the continual involvement of a two-electron process, a typical voltammogram for this type reaction will show an increase in the forward peak and a decrease in backward peak as the concentration of thiol increases (Scheme 2).
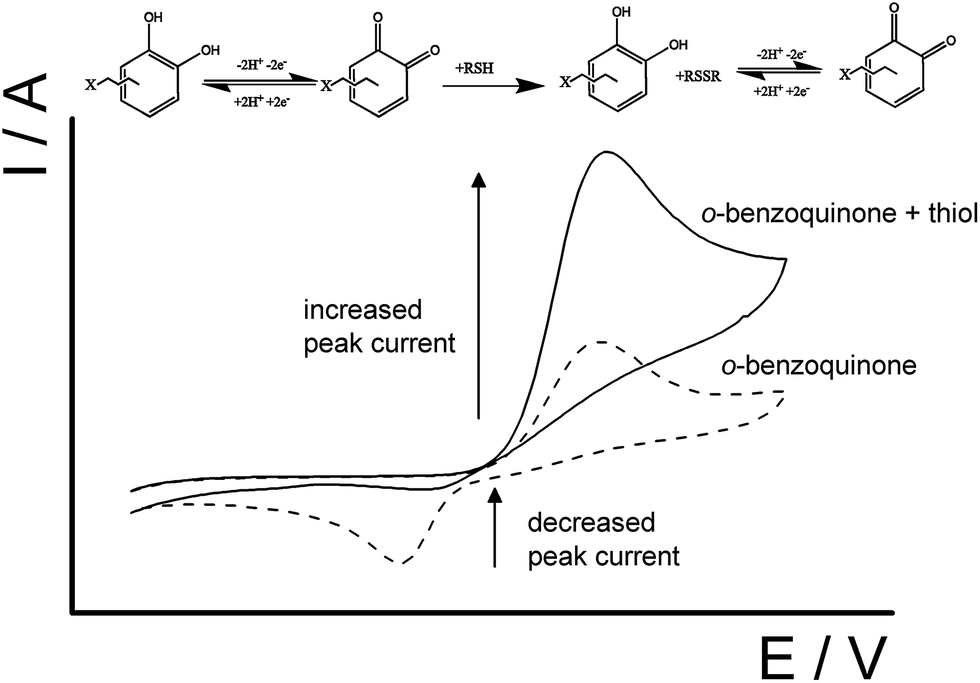 | ||
| Scheme 2 Schematic representation of the electrocatalytic reaction between an o-benzoquinone unit with a thiol-containing molecule. | ||
Not only does this advocated methodology rely on the electrocatalytic oxidation reaction, but the different reaction rates between surface immobilized o-benzoquinone moieties and the different thiol-containing molecules facilitate selective measurement such that it will be seen that cysteine reacts usefully faster than glutathione or homocysteine. Application of a fast scan rate to a CTC modified electrode in the sample solution containing cysteine and the thiols, homocysteine and glutathione, excludes the unwanted thiol reactions with the o-benzoquinone moieties and allows only reaction with cysteine to take place, thus establishing selective cysteine detection. This novel system approach for cysteine selectivity was investigated by practical assessment of solutions containing all three thiols (cysteine, homocysteine and glutathione) in both phosphate buffer solution and cell tissue culture media. This methodology thus establishes new diagnostic pathway for selective cysteine detection by the biomedical community.
2. Experimental procedure
2.1. Reagents
L-cysteine (97%, Lancaster synthesis), D,L-homocysteine (≥95%, Sigma), glutathione (98%, Sigma-Aldrich), Dulbecco's Modified Eagle's Media (Sigma-Aldrich) were all purchased at their highest purity and were used as received without any further purification steps. CTV was synthesized according to that reported by Lindsey.33 Veratrole, Fig. 1b, (10.0 g, 72.4 mmol) was added portionwise to a stirred mixture of 38% aqueous formaldehyde (40 mL) and concentrated aqueous HCl (54 mL) at 0 °C, and the resultant mixture was stirred at 0 °C for 30 minutes, then allowed to warm to room temperature and stirred at room temperature for 4 hours. The reaction mixture was then filtered and the solid residue was washed with ice-cold water (50 mL). The residue was purified by recrystallisation (toluene) and dried under high vacuum to give CTV as a white solid (8.22 g, 76%). Further purification of an aliquot via flash column chromatography on silica gel (eluent hexane–EtOAc, 1![[thin space (1/6-em)]](https://www.rsc.org/images/entities/char_2009.gif) :1) gave an analytically pure sample of CTV;42δH (400 MHz, CDCl3) 3.87 (18H, s, OMe), 3.60 (3H, d, J 14.0, CHAHB), 4.82 (3H, d, J 14.0, CHAHB), 6.86 (6H, s, Ar); m/z (ESI+) 473 ([M + Na]+, 100%).
:1) gave an analytically pure sample of CTV;42δH (400 MHz, CDCl3) 3.87 (18H, s, OMe), 3.60 (3H, d, J 14.0, CHAHB), 4.82 (3H, d, J 14.0, CHAHB), 6.86 (6H, s, Ar); m/z (ESI+) 473 ([M + Na]+, 100%).
All solutions were prepared with deionized water at a resistivity of no less than 18.2 MΩ cm−1 at 25 °C (Millipore, UK). Buffer solutions, 0.15 M, were prepared using potassium monohydrogen phosphate (≥98%, Sigma-Aldrich), potassium dihydrogen phosphate (≥99%, Sigma-Aldrich), and potassium hydroxide (≥85%, Sigma-Aldrich) was used accordingly to give the required pH range. All buffer solutions were made up with supporting electrolyte of 0.10 M potassium chloride (99%, Sigma-Aldrich).
2.2. Apparatus
Electrochemical experiments were performed in a three-electrode system consisting of a glassy carbon (CH Instruments, USA) working electrode, a saturated calomel electrode, SCE, reference electrode (Hach Lange, UK) and a platinum mesh 99.999% (Goodfellow Cambridge Ltd, UK) counter electrode. The surface area of the glassy carbon electrode was 0.071 cm2. All experiments were conducted using a computer-controlled potentiostat, PGSTAT 101 (ECO-chemie, NL). A temperature controlled water bath was also used to ensure that all electrochemical experiments were carried out at 20 ± 2 °C in a Faraday cage. All pH measurements were conducted using a pH213 Microprocessor pH meter from Hanna Instruments, UK. The pH meter was calibrated using Duracal buffer of pH 4.01 ± 0.01, pH 7.00 ± 0.01, and pH 10.01 ± 0.01 (Hamilton, CH).2.3. Electrode modification with CTV and conversion into cyclotricatechylene (CTC)
The glassy carbon electrode was initially polished with sequentially 3.0, 1.0, and 0.1 μM diamond spray (Kemet, UK) on a polishing pad followed by a deionized water rinse and careful drying. CTV was immobilized onto the surface of the carbon electrode via drop cast method. This method is to drop approximately 20 μL of a 100 μM CTV–chloroform solution onto the surface of the carbon electrode and allow the volatile solvent to dry under flowing nitrogen atmosphere.To form CTC electrochemically, the optimal parameters were determined where the CTV modified carbon electrode is placed in a 0.05 M Britton–Robinson buffer solution (pH 1.0) and a potential sweep was applied from +1.16 V to −0.40 V (vs. SCE) at a sweep rate of 100 mV s−1. Then the electrode was carefully rinsed with deionized water before proceeding with all electrochemical experiments. The preparation of the CTC modified electrode was done prior to each experiment due to the solubility of CTC in aqueous systems.
2.4. Characterization of cyclotriveratrylene (CTV)
Scanning electron microscopy (SEM) was used to characterize the CTV modified carbon electrode. Secondary electron images were taken of CTV on glassy carbon substrate using a Merlin scanning electron microscope (Zeiss, UK) at an acceleration voltage of 5.0 kV. Shown in Fig. 2, prism-like crystalline structures averaging ca. 1.0 μm × 0.15 μm, ranging from 0.3 μm × 0.05 μm to 2.2 μm × 0.4 μm, are seen scattered throughout the carbon substrate which is consistent with observations made by Steed et al. when CTV structures of crystalline inclusion complexes are investigated with chloroform.43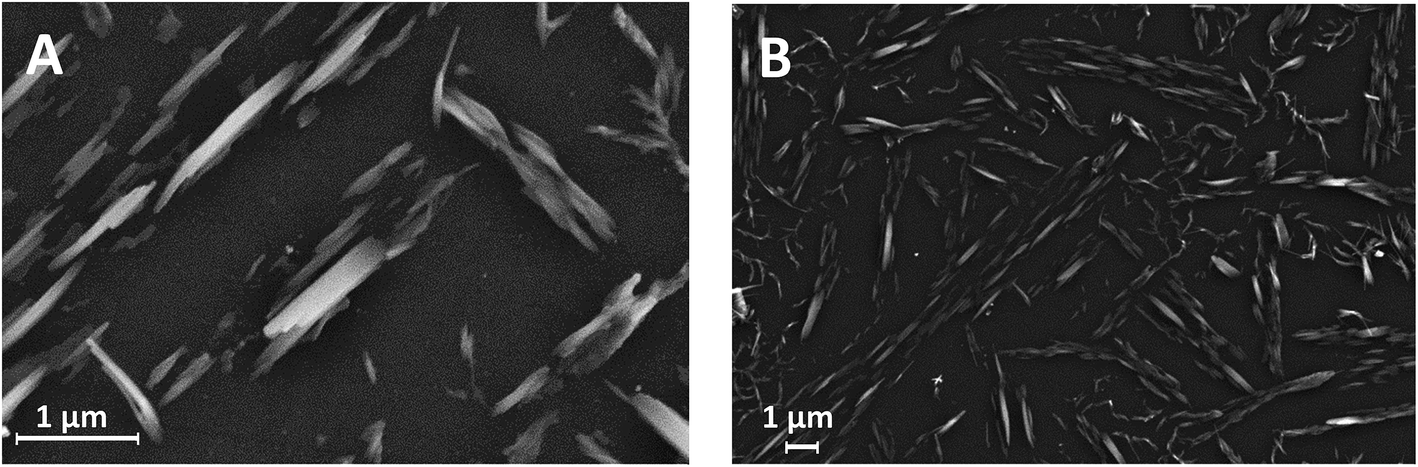 | ||
| Fig. 2 Secondary electron images of modified carbon electrode with cyclotriveratrylene (CTV) at (a) high magnification and (b) low magnification. | ||
3. Results and discussion
3.1. Electrochemical characterization of cyclotricatechylene (CTC)
Cyclic voltammetry was utilized to explore the electrochemical activation of immobilized CTV to form CTC on the surface of a glassy carbon electrode. Fig. 3 shows two successive scans of the oxidation of CTV at the glassy carbon electrode in 0.05 M Britton–Robinson buffer (pH 1.0) with a scan rate of 100 mV s−1. In the first scan (dotted line) starting at −0.4 V (vs. SCE), a small oxidative peak (Peak I) at ca. +1.12 V (vs. SCE) is observed followed on the reverse scan, by two reduction peaks (Peak II and Peak III) ca. +0.4 V (vs. SCE) and ca. +0.2 V (vs. SCE) respectively after reversed at +1.16 V (vs. SCE). On the second scan (solid line), two new oxidation peaks (Peak IV and Peak V) emerge corresponding to the reduction peaks (Peak III and Peak II) respectively while the oxidative peak at ca. +1.12 V (vs. SCE) is no longer observable.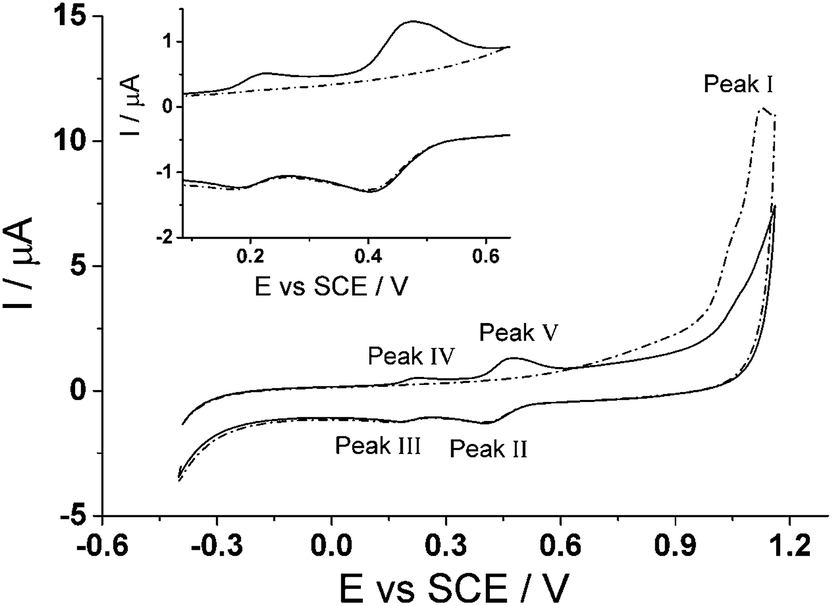 | ||
| Fig. 3 The first (dotted line) and second (solid line) scans for the de-methylation of cyclotriveratrylene (CTV) on the glassy carbon electrode in 0.05 M Britton–Robinson buffer solution (pH 1.0) to form cyclotricatechylene (CTC). Scan rate = 100 mV s−1. Inset: enlarged view of CTC. | ||
The proposed reaction for the electrochemical derivatization of CTV to form CTC is depicted in Scheme 1. During the first scan, the CTV undergoes a sequence of electrochemical reduction/oxidation steps with an intermediate hydrolysis of the methoxy groups forming the o-benzoquinone moieties.44–46 Then the o-benzoquinone species can undergo an electrochemical redox cycle (scheme 1B), which can be observed in peaks III/IV and peaks II/V in Fig. 3.
To determine this optimal condition, a range of different holding time (0–60 seconds) at +1.16 V (vs. SCE) was carried out in pH 1.0 buffer where the charge at each peak was used for comparison. It was determined that the charge remained consistent for all holding times at each peak. Therefore, there is no need for longer holding time as it is fully converted to CTC once the potential of +1.16 V (vs. SCE) was applied. The optimal condition for the conversion to CTC is at a potential sweep, +1.16 V to −0.40 V (vs. SCE), in 0.05 M Britton–Robinson buffer (pH 1.0) at a scan rate of 100 mV s−1. The surface coverage (Γ) of CTC under the optimal condition was determined to be ca. 6.4 × 10⁻¹² mol cm−2; using Γ = Q/nFA, where the charge (Q) was determined by integrating the anodic peak current, n is the number of electrons (n = 6), F is the Faraday constant and A is the surface area of the glassy carbon electrode. The CTC surface coverage observed electrochemically is estimated as ca. 1% of the total theoretical coverage. This was estimated knowing that a 20 μL aliquot of 100 μM CTV solution was drop cast onto the electrode. It is likely that not all of the CTV drop casted onto the electrode was electrochemically converted to CTC and therefore the crystals, observed in the secondary electron images, may contain a mixture of CTV and CTC.
Cyclic voltammetry (100 mV s−1) was next performed on the activated modified carbon electrode in 0.15 M phosphate buffer solution (pH 7.0) to observe the voltammetric response of the o-benzoquinone species. Fig. 4 shows two redox process occurring at E1/2 = −0.11 V and at E1/2 = +0.13 V (vs. SCE) which can be attributed to a total of six electron and six proton oxidation of the three o-benzoquinone species (scheme 1B). Note that the peak current at ca. +0.10 V (vs. SCE) is ca. two times larger than the peak current at ca. −0.10 V (vs. SCE). With a net total of six electrons and six proton redox process, it is proposed that a four electron, four proton process occurs at the larger peak while the other smaller peak undergoes a two electron, two proton process. It is suspected that this may be attributed to the crystalline structure formed during the electrode preparation step with chloroform. Steed et al. reports that CTV can self-assemble accordingly with different solvents.43 When mixed with chloroform, it can form a weak hydrogen bond to the methoxy oxygen atoms on the CTV molecule therefore exhibiting channel structures where these molecules pack within the other along an axis to form a distinct crystalline phase.43 Therefore it is speculated that when the solvent evaporates during the electrode preparation step, the CTV self-packs so that two rings overlap with others (shown in Scheme 3).
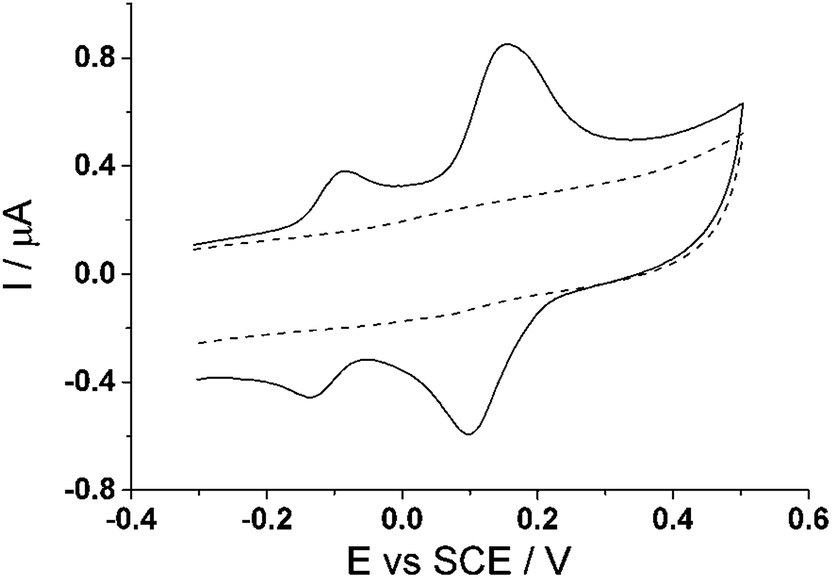 | ||
| Fig. 4 Cyclic voltammogram (100 mV s−1) at a bare glassy carbon electrode (dashed line) and cyclotricatechylene (CTC) modified carbon electrode (solid line) in PBS (pH 7.0). | ||
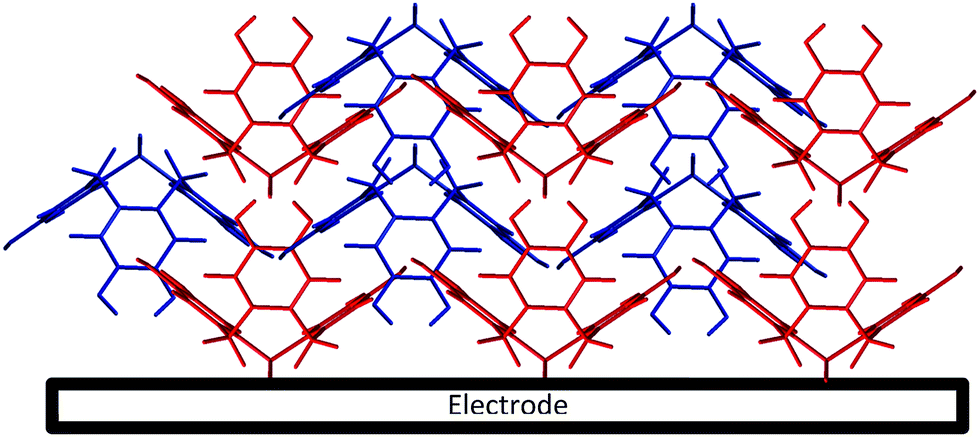 | ||
| Scheme 3 Schematic possible representation of cyclotriveratrylene (CTV) on the electrode surface. | ||
Lastly, a scan rate study was also carried out on the CTC modified glassy carbon electrode to show the voltammetric behaviour. Scan rates varying from 50 mV s−1 to 500 mV s−1 were run in 0.15 M phosphate buffer (pH 7.0) (Fig. 5) on the modified electrode. The inset to Fig. 5 shows a proportional relationship when peak current, Ip, is plotted against scan rate, ν, thus showing that the redox process is surface bound.
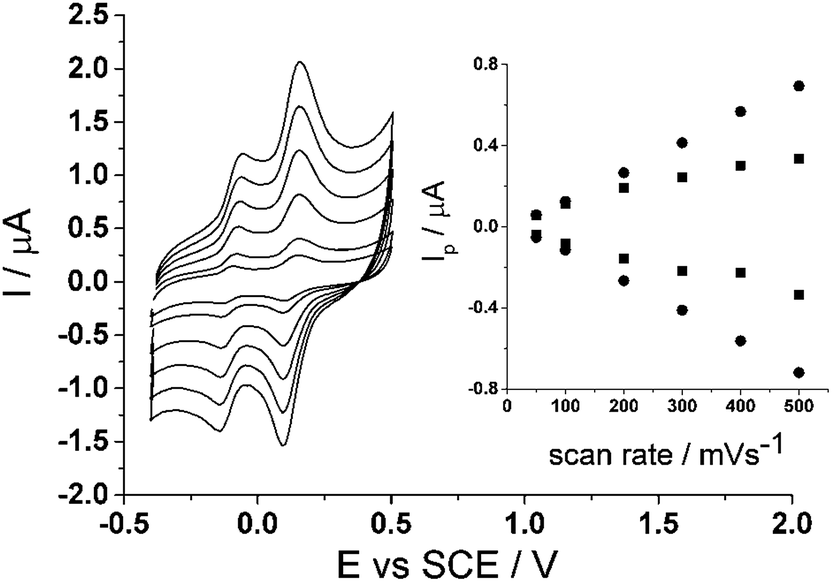 | ||
| Fig. 5 Scan rate study of cyclotricatechylene (CTC) in PBS (pH 7.0) at 20 °C. Inset: peak current, Ip, vs. scan rate, ν. | ||
3.2. Selective cysteine detection with cyclotricatechylene (CTC)
Fig. 6 shows the cyclic voltammograms (100 mV s−1) of the CTC modified carbon electrode response to solutions containing 20 μM of each cysteine, homocysteine, and glutathione (pH 7.0). The voltammogram shows the smaller peak ca. −0.10 V (vs. SCE) appears to be unaffected by any added thiol-containing molecule whilst the larger peak ca. +0.10 V (vs. SCE) changes with added thiol. Upon a closer look at the larger peak ca. +0.10 V (vs. SCE), the voltammogram show an increase in the forward anodic peak current, Ipa, while the backward cathodic peak, Ipc, decreases when the thiol is added to the solution thus indicating that it is an electrocatalytic oxidation reaction (Scheme 2); which can be analytically useful. Therefore for the purpose of quantitative analysis, the analytical parameters presented will be primarily focused on peak ca. +0.10 V (vs. SCE).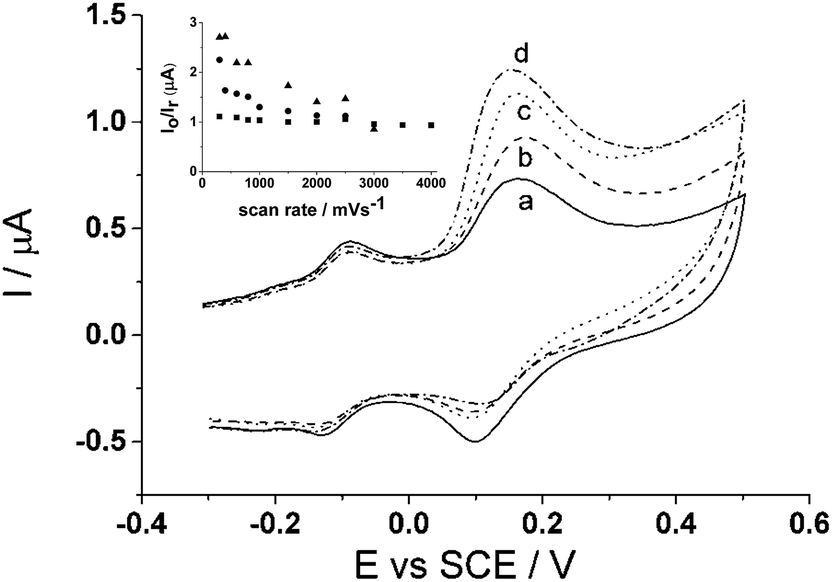 | ||
| Fig. 6 Cyclic voltammograms (100 mV s−1) of cyclotricatechylene (CTC) response to (a) no thiol (b) 20 μM glutathione (c) 20 μM homocysteine and (d) 20 μM cysteine. Inset: plot of anodic and cathodic peak current ratio, Io/Ir, as a function of scan rate of homocysteine (▲), glutathione (●), and no thiol analyte (■). | ||
However, selective cysteine detection becomes an issue when all three thiols are present in the same solution as is typical in biological media. To get around this issue, increasing scan rate was applied to solutions containing 80 μM each homocysteine and glutathione (pH 7.0) where the peak current ratio, Ipa/Ipc, is calculated and then compared to the peak current ratio taken in the absence (Fig. 6 inset). It was determined that 3.0 V s−1 is the optimum scan rate where the peak current ratio taken in the absence and presence 80 μM of each homocysteine and glutathione are equal to one another. This suggests that it is possible to ‘outrun’ the homocysteine and glutathione reaction with the o-benzoquinone species but allow sufficient time for cysteine to react thus having cysteine selectivity when all three thiols are present in the solution.
Next, cyclic voltammetry (3.0 V s−1) was utilized to observe the voltammetric behaviour of CTC with varying concentrations of cysteine, from 0 μm to 100 μM (Fig. 7). The figure shows that as the concentration of cysteine increases, the forward peak increases while the backward peak decreases thus further indicating that it is an electrocatalytic oxidation reaction, as described earlier. An analytical curve was determined for cysteine at this scan rate when the peak current ratio, Ipa/Ipc, of the peak ca. +0.10 V (vs. SCE), is plotted with respect to cysteine concentration. The analytical parameters for cysteine detection in PBS (pH 7.0) at 3.0 V s−1 are tabulated in Table 1. The linear relationship is [Ipa/Ipc] (μA) = 0.966 + (0.023 ± 0.001) [Cys/μM] (n = 3) for concentrations up to 40 μM and the limit of detection is determined to be ca. (0.6 ± 0.02) μM.
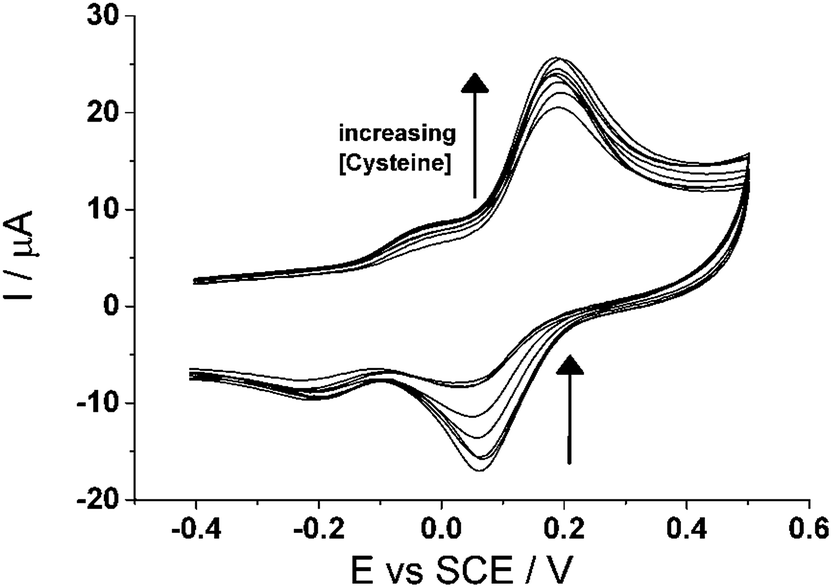 | ||
| Fig. 7 Cyclic voltammogram (3.0 V s−1) of cyclotricatechylene (CTC) modified carbon electrode in varying concentrations of cysteine (pH 7.0). | ||
| Medium | Scan rate (V s−1) | Slope (μA μM−1) | y-intercept | R 2 | LOD (μM) | Linear range (μm) |
|---|---|---|---|---|---|---|
| PBS (pH 7.0) | 3.0 | (0.023 ± 0.001) | 0.966 | 0.994 | 0.6 | 0–40 |
| Dulbecco's Modified Eagles Media (pH 8.0) | 3.1 | (0.031 ± 0.001) | 1.09 | 0.987 | 0.9 | 0–20 |
Preliminary testing of several mixed solutions containing different concentrations of cysteine, homocysteine and glutathione were carried out using the CTC modified carbon electrode in PBS (pH 7.0). Concentrations in the mixed solutions are values typically seen in physiological samples.5,10,13,14,47 Using cyclic voltammetry (3.0 V s−1), the peak current ratio at ca. +0.10 V (vs. SCE) was calculated for each mixed solution and the cysteine content can be determined through the analytical curve, mentioned above. Table 2 summarizes the results obtained for cysteine at each mixed solution with the CTC modified electrode. The results are well within reasonable deviation, ca. 15%, from the cysteine quantity present in the solution. This indicates that the selective detection of cysteine in the presence of other homologues thiols such as homocysteine and glutathione is possible.
| Mixed solution | Determined [cysteine]a (μM) in | |||
|---|---|---|---|---|
| Homocysteine (μM) | Glutathione (μM) | Cysteine (μM) | PBS (pH 7.0) | Dulbecco's Modified Eagle's Media (pH 8.0) |
| a Average value ± relative error (n = 3). | ||||
| 10 | 10 | 10 | 10.1 ± 0.15 | 9.1 ± 0.05 |
| 10 | 5 | 5 | 5.4 ± 0.09 | 6.7 ± 0.25 |
| 10 | 3 | 15 | 13.1 ± 0.15 | 14.1 ± 0.30 |
| 10 | 1 | 20 | 18.4 ± 0.15 | 19.0 ± 0.12 |
| 5 | 10 | 5 | 6.7 ± 0.25 | 5.6 ± 0.28 |
| 3 | 10 | 15 | 14.7 ± 0.13 | 14.1 ± 0.18 |
| 1 | 10 | 30 | 30.2 ± 0.14 | 26.3 ± 0.16 |
3.3. Application of selective cysteine detection in tissue culture media
A practical assessment of the proposed method was next applied to the cell tissue culture media, Dulbecco's Modified Eagle's media (DMEM), as it contains a diverse variety of amino acids and vitamins which help facilitate cell growth.48,49 It is thus a challenging medium for selective electroanalysis. Using the optimal parameters established above, cyclic voltammetry (3.0 V s−1) was utilized and run in 100% cell tissue culture media (pH 8.0) with and without the modification of CTC at the carbon electrode to ensure the window of interest for analysis is free of possible interferences from the media. Fig. 8 shows no introduction of any new signal from the tissue culture media alone at the bare carbon electrode, which suggests that the media itself will not interfere with our analytical measurements. When the CTC modified carbon electrode is applied to the tissue culture media, two redox peaks, ca. −0.17 V (vs. SCE) and ca. +0.08 V (vs. SCE), are observed again corresponding to the two redox process of the o-benzoquinones. This observation is consistent with the modified electrode in PBS (pH 7.0) at the same scan rate (Fig. 7).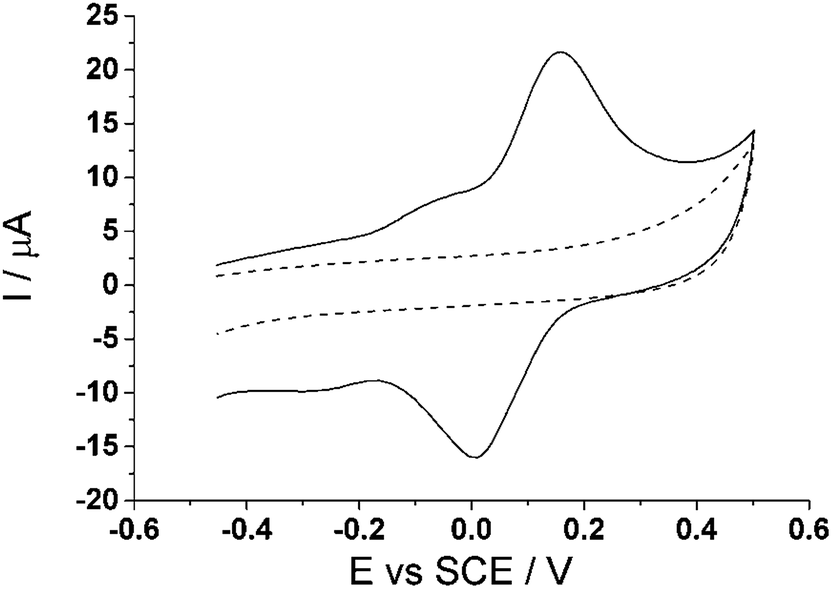 | ||
| Fig. 8 Cyclic voltammogram (3.0 V s−1) at a bare glassy carbon electrode (dashed line) and cyclotricatechylene (CTC) modified carbon electrode (solid line) in tissue culture media (pH 8.0). | ||
To make certain that either homocysteine or glutathione will not interfere, the media was spiked with 80 μM of each homocysteine and glutathione and the appropriate scan rate to ‘outrun’ these reactions were found (as described earlier). It was determined that an optimum scan rate of 3.1 V s−1 was sufficient enough to ‘outrun’ both glutathione and homocysteine in tissue culture media. From there, an analytical curve was determined when different concentrations of cysteine, ranging from 5–60 μM, were added to the media and measured at the CTC modified electrode. The linear relationship was determined to be [Ipa/Ipc] (μA) = 1.09 + (0.031 ± 0.001) [Cys/μM] (n = 3) for concentrations up to 20 μM and the limit of detection is determined to be ca. (0.9 ± 0.02) μM (Table 1).
To test the selective cysteine detection method in this medium, the cell tissue media was spiked with various amounts of cysteine, homocysteine and glutathione and the optimum condition described above was carried out at the modified electrode. For each spiked sample, the peak current ratio was taken at the peak ca. +0.08 V (vs. SCE) where the cysteine content was determined by the analytical curve (mentioned above). The results are summarized in Table 2, which shows the determined cysteine value is consistent with the spiked cysteine content and is well within reasonable deviation of ca. 19% thus showing that this method for cysteine detection is reliable in the complex cell tissue media.
4. Conclusions
We have established the formation of CTC from electrode surface immobilized CTV using only electrochemical methods at a carbon electrode. The CTC generated allows selective cysteine detection in the presence of homocysteine and glutathione, at concentrations typically seen in biological samples, in both buffer solution and tissue culture media. The sensitivity is ca. 0.023 μA μM−1 and ca. 0.031 μA μM−1 with a limit of detection of ca. 0.6 μM and ca. 0.9 μM for buffer solution and tissue culture media respectively. The detection was successfully applied to several spiked sample solutions where determined values were consistent with the spiked cysteine content with an average error acceptable for bio-medical marker applications. This method presents a potentially useful and novel way for selective detection of cysteine and opens up the use of CTC modified electrodes for electroanalysis.References
- Y. M. Go and D. P. Jones, Free Radical Biol. Med., 2011, 50, 495–509 CrossRef CAS PubMed.
- G. Hignett, S. Threlfell, A. J. Wain, N. S. Lawrence, S. J. Wilkins, J. Davis, R. G. Compton and M. F. Cardosi, Analyst, 2001, 126, 353–357 RSC.
- S. Fei, J. Chen, S. Yao, G. Deng, D. He and Y. Kuang, Anal. Biochem., 2005, 339, 29–35 CrossRef CAS PubMed.
- T. Fiskerstrand, H. Refsum, G. Kvalheim and P. M. Ueland, Clin. Chem., 1993, 39, 263–271 CAS.
- A. Pastore, R. Massoud, C. Motti, A. L. Russo, G. Fucci, C. Cortese and G. Federici, Clin. Chim. Acta, 1998, 44, 825–832 CAS.
- R. Saetre and D. L. Rabenstein, Anal. Biochem., 1978, 90, 684–692 CrossRef CAS.
- J. L. D'Erarno, A. E. Finkelstein, F. O. Boccazzi and O. Fridman, J. Chromatogr. B: Biomed. Sci. Appl., 1998, 720, 205–210 CrossRef.
- D. P. Jones, J. L. Carlson, J. V. C. Mody, J. Cai, M. J. Lynn and J. P. Sternberg, Free Radical Biol. Med., 2000, 28, 625–635 CrossRef CAS.
- W. A. Kleinman and J. P. Richie, Biochem. Pharmacol., 2000, 60, 19–29 CrossRef CAS.
- M. A. Mansoor, A. M. Svardal and P. M. Ueland, Anal. Biochem., 1992, 200, 218–229 CrossRef CAS.
- H. Refsum, F. Wesenberg and P. M. Ueland, Cancer Res., 1991, 51, 828–835 CAS.
- P. M. Ueland, H. Refrum, S. P. Stabler, M. R. Malinow, A. Andersson and R. H. Allen, Clin. Chem., 1993, 39, 1764–1779 CAS.
- E. Bald and R. Glowacki, Amino Acids, 2005, 28, 431–433 CrossRef CAS PubMed.
- B. Zappacosta, A. Manni, S. Persichilli, S. Scribano, A. Minucci, D. Lazzaro, P. D. Sole and B. Giardina, Clin. Chim. Acta, 2003, 338, 57–60 CrossRef CAS PubMed.
- J. C. Harfield, C. Batchelor-McAuley and R. G. Compton, Analyst, 2012, 137, 2285–2296 RSC.
- O. Nekrassova, N. S. Larence and R. G. Compton, Talanta, 2003, 60, 1085–1095 CrossRef CAS.
- F. D. Carvalho, F. Remião, P. Valet, J. A. Timbrell, M. L. Bastos and M. A. Ferreira, Biomed. Chromatogr., 2005, 8, 134–136 CrossRef PubMed.
- D. E. Cole, D. C. Lehotay and J. Evrovski, Clin. Chem., 1998, 44, 188–190 CAS.
- K. Kusmierek, G. Chwatko, R. Glowacki and E. Bald, J. Chromatogr. B: Anal. Technol. Biomed. Life Sci., 2009, 877, 3300–3308 CrossRef CAS PubMed.
- W. Leesutthiphonchai, W. Dungchai, W. Siangproh, N. Ngamrojnavanich and O. Chailapakul, Talanta, 2011, 85, 870–876 CrossRef CAS PubMed.
- S. P. Stabler, P. D. Marcell, E. R. Rodell, R. H. Allen, D. G. Savage and J. Lindenbaum, J. Clin. Invest., 1988, 81, 466–474 CrossRef CAS PubMed.
- X. Chen, Y. Yang and M. Ding, Anal. Chim. Acta, 2006, 557, 52–56 CrossRef CAS PubMed.
- P. T. Lee and R. G. Compton, Electroanalysis, 2013, 25, 1613–1620 CrossRef CAS.
- P. T. Lee, D. Lowinsohn and R. G. Compton, Analyst, 2014, 139, 3755–3762 RSC.
- P. T. Lee, D. Lowinsohn and R. G. Compton, Sensors, 2014, 14, 10395–10411 CrossRef PubMed.
- X. Liu, H. Lv, Q. Sun, Y. Zhong, J. Zhao, J. Fu, M. Lin and J. Wang, Anal. Lett., 2012, 45, 2246–2256 CrossRef CAS.
- J. C. Ndamanisha, J. Bai, B. Qi and L. Guo, Anal. Biochem., 2009, 386, 79–84 CrossRef CAS PubMed.
- P. J. Vandeberg and D. C. Johnson, Anal. Chem., 1993, 65, 2713–2718 CrossRef CAS.
- R. W. Murray, A. G. Ewing and R. A. Durst, Anal. Chem., 1987, 59, 379A–390A CAS.
- J. Wang, J. Pharm. Biomed. Anal., 1999, 19, 49–53 Search PubMed.
- H. Salehzadeh, B. Mokhtari and D. Nematollahi, Electrochim. Acta, 2014, 123, 353–361 CrossRef CAS PubMed.
- M. J. Hardie, R. M. Mills and C. J. Sumby, Org. Biomol. Chem., 2004, 2, 2958–2964 CAS.
- A. S. Lindsey, J. Chem. Soc., 1965, 1685–1692 RSC.
- M. J. Hardie, Chem. Soc. Rev., 2010, 39, 516–527 RSC.
- J. J. Loughrey, C. A. Kilner, M. J. Hardie and M. A. Halcrow, Supramol. Chem., 2012, 24, 2–13 CrossRef CAS.
- D. S. Bohle and D. Stasko, Chem. Commun., 1998, 567–568 RSC.
- P. T. Lee, K. R. Ward, K. Tschulik, G. Chapman and R. G. Compton, Electroanalysis, 2014, 26, 366–373 CrossRef CAS.
- P. C. White, N. S. Lawrence, J. Davis and R. G. Compton, Electroanalysis, 2002, 14, 89–98 CrossRef CAS.
- P. C. White, N. S. Lawrence, J. Davis and R. G. Compton, Anal. Chim. Acta, 2001, 447, 1–10 CrossRef CAS.
- N. S. Lawrence, E. L. Beckett, J. Davis and R. G. Compton, Anal. Biochem., 2002, 303, 1–16 CrossRef CAS PubMed.
- D. Lowinsohn, P. T. Lee and R. G. Compton, Int. J. Electrochem. Sci., 2014, 9, 3458–3472 CAS.
- A. Warshawsky and N. Shoef, J. Inclusion Phenom., 1988, 6, 647–651 CrossRef CAS.
- J. W. Steed, H. Zhang and J. L. Atwood, Supramol. Chem., 1994, 7, 37–45 CrossRef.
- R. T. Kachoosangi, G. G. Wildgoose and R. G. Compton, Analyst, 2008, 133, 888–895 RSC.
- L. Papouchado, J. Bacon and R. N. Adams, J. Electroanal. Chem., 1969, 24, A1–A5 CrossRef.
- M. Jonsson, J. Lind, T. Reitberger, T. E. Eriksen and G. Merényi, J. Phys. Chem., 1993, 97, 11278–11282 CrossRef CAS.
- H. Refsum, P. D. Ueland, P. Nygård and S. E. Vollset, Annu. Rev. Med., 1998, 49, 31–62 CrossRef CAS PubMed.
- N. S. Lawrence, J. Davies and R. G. Compton, Talanta, 2001, 53, 1089–1094 CrossRef CAS.
- J. Kruid, R. Fogel and J. Limson, Electrochim. Acta, 2014, 128, 41–47 CrossRef CAS PubMed.
| This journal is © The Royal Society of Chemistry 2015 |