Supramolecular interaction of labetalol with cucurbit[7]uril for its sensitive fluorescence detection
Changfeng
Li
ab,
Jianxia
Feng
b and
Huangxian
Ju
*a
aState Key Laboratory of Analytical Chemistry for Life Science, Department of Chemistry, Nanjing University, Nanjing 210093, P. R. China. E-mail: hxju@nju.edu.cn
bSchool of Chemistry and Materials Science, Shanxi Normal University, Linfen 041004, P.R. China
First published on 23rd October 2014
Abstract
This work studied the host–guest interaction between cucurbit[7]uril (CB[7]) and labetalol in acidic aqueous solution and proposed a simple competitive method for fluorescence detection of labetalol. The binding constant of labetalol–CB[7] was (1.83 ± 0.22) × 106 M−1, which was greater than those of palmatine–CB[7], berberine–CB[7], and coptisine–CB[7] complexes. The fluorescence intensity of palmatine–CB[7], berberine–CB[7], and coptisine–CB[7] complexes decreased linearly with increasing concentration of labetalol ranging from 0.014 to 2.06, 0.014 to 1.15, and 0.034 to 1.23 μM, respectively. Based on the competitive interaction, the proposed detection method for labetalol showed limits of detection of 4.9 nM, 4.9 nM, and 12.0 nM, respectively, and was successfully applied for the determination of labetalol in human urine samples with good precision and recoveries from 95.4% to 102.5%. Moreover, it could be employed to monitor the time-dependent concentration of labetalol in urine from a healthy volunteer after oral medication. The superstructure-based competitive mode provided a promising fluorescence assay strategy for various potential applications.
Introduction
Labetalol hydrochloride (LBT), 5-[1-hydroxy-2-(1-methyl-3-phenylpropylamino)ethyl] salicylamide hydrochloride, as a non-cardiovascular β-blocker, is reported to possess some intrinsic sympathomimetic and membrane stabilizing activity. It can reduce heart rate and tremor.1 Hence, it has been added to the list of forbidden substances issued by the International Olympic Committee.2 Many methods have been reported for the determination of LBT in biological and pharmaceutical samples, including solid phase extraction-high performance liquid chromatography,3 liquid chromatography-tandem mass spectrometry,4,5 capillary electrophoresis,6 fluorescence optosensing,7 spectrophotometry,8,9 and resonance light-scattering methods.10 However, the reported liquid chromatographic analysis requires a complicated extraction process and time-consuming operation steps.3–5 Though easier to operate, the low sensitivity of the reported spectrofluorometric method limits its practical application8 due to the low levels of LBT in urine. Therefore, a sensitive and simple detection method is an urgent need for the detection of LBT in real samples.Over the past decade, the cucurbit[n]uril (CB[n], n = 5, 6, 7, 8, 10) family of molecular containers has emerged as a premier platform for basic and applied studies of molecular recognition in water.11–13 The CB[n] hosts feature two symmetry-equivalent uridylcarbonyl portals, which are electrostatically negative and guard the entrance to a hydrophobic cavity. Among these hosts, CB[7] displays a favorable combination of a sufficient cavity size and water solubility (ca. 5 mM), which renders it the most promising CB[n] host for the binding of organic molecules.14–18 This work studied the host–guest interaction between CB[7] and labetalol in acidic aqueous solution and proposed a simple method for the sensitive fluorescence detection of labetalol through the competitive inclusion of CB[7] with labetalol and three other molecules to change the fluorescent emission.
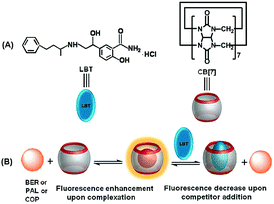
In order to achieve the fluorescence detection of LBT, palmatine (PAL), berberine (BER) and coptisine (COP), a series of very weakly fluorescent molecules that can form inclusion complexes with CB[7] to greatly enhance their fluorescence emission, were used as signal probes (Scheme 1). Due to the stronger binding ability of LBT–CB[7] compared with PAL–CB[7], BER–CB[7], and COP–CB[7] complexes, the presence of LBT significantly decreased the fluorescence intensity of these complexes, which led to a fluorescence method for the detection of LBT. The proposed method could be successfully utilized to detect LBT in pharmaceutical dosage forms and urine samples, and exhibited a promising application in practice.
Experimental
Materials and reagents
PAL hydrochloride, BER hydrochloride, COP, and LBT hydrochloride were obtained from the Chinese National Institute for the Control of Pharmaceutical and Biological Products (Beijing). CB[7] was prepared and characterized according to the reported procedure.19,20 The stock standard solutions of CB[7] are stable for several weeks at room temperature. Britton–Robinson buffer solutions were prepared using 0.01 M boric acid, acetic acid and phosphoric acid, and their pH values were adjusted using 0.05 M sodium hydroxide or hydrochloric acid. All other chemicals were of analytical grade, and doubly distilled water was used thoroughout.Instrumentation
The fluorescence measurements were performed on a F97XP spectrofluorometer (Shanghai, China) equipped with a xenon lamp in the fluorescence mode at the slit widths of 10.0 nm and 5.0 nm for excitation and emission in a standard 10 × 1 mm path-length quartz cell at 25.0 ± 0.5 °C. Calorimetric experiments were performed using a thermostated and fully computer operated ITC-200 calorimeter purchased from GE Instruments Corporation. 1H NMR spectra were obtained using a Bruker AV-600 MHz spectrometer (Switzerland) in D2O. Molecular modeling calculations were optimized at the B3LYP/6-31G(d) level of density functional theory with the Gaussian 03 program.Analysis of human urine
The fluorescence measurements of PAL, BER and COP and their complexes were carried out using the excitation wavelengths of 344, 348, or 356 nm in the absence or presence of LBT or sample, respectively. Urine samples were handled according to the previous protocol.21 Briefly, the urine samples were collected from healthy volunteers at certain periods over 12 h to monitor the time dependent concentration of LBT in the urine after the oral administration of 80 mg of LBT medication, and immediately frozen and stored at −20 °C until analysis. The collection and usage of urine samples followed the ethical standards. Prior to detection, the amino acids in the urine samples were firstly eliminated by adding 0.5 mL of 4 M sodium hydroxide and 5.0 mL dichloromethane to 1.0 mL urine, followed by vortex-extraction for 3 min and centrifugation at 4000 rpm for 10 min. A total of 4.0 mL of the dichloromethane layer was then evaporated to dryness under N2, and the residue was dissolved in 1.0 mL water for fluorescence detection.Results and discussion
Spectral characteristics
In acidic aqueous solution, PAL, BER, and COP showed undetectable or very weak fluorescence emission, while LBT exhibited a weak native fluorescence (Fig. 1). In the presence of CB[7], the fluorescence emission of LBT did not show an obvious change. However, a dramatic increase in fluorescence intensity was observed upon addition of CB[7] in PAL, BER, and COP solutions. This could be attributed to the inclusion of PAL, BER and COP into CB[7] and the change in their structure or conformation to produce fluorescent complexes. Interestingly, the addition of LBT to the mixture of CB[7] and PAL, BER, or COP led to a significant decrease of fluorescence intensity, which suggested a fluorescence method for detection of LBT.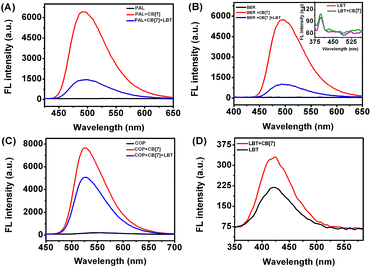 | ||
| Fig. 1 Fluorescence spectra of different marked solutions (pH 2) with excitation wavelengths of 344 (A), 348 (B), 356 (C) and 301 nm (D) at 2.50 μM. | ||
Influence of pH
The influence of pH on the fluorescence intensity of the formed inclusion complex in the absence or presence of LBT was examined in pH 1.0–7.0 Britton–Robinson buffer solutions. Upon the addition of LBT, all inclusion complexes showed the maximum change at pH 2.0 (Fig. 2). Therefore, the Britton–Robinson buffer of pH 2.0 was used for all subsequent experiments.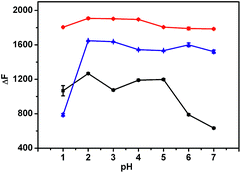 | ||
| Fig. 2 Influence of pH on fluorescence intensity change of 2.5 μM BER–CB[7] (red), PAL–CB[7] (blue), and COP–CB[7] (black) upon addition of 0.685 μM LBT. | ||
Mechanism of interaction of CB[7] with PAL, BER, COP, and LBT
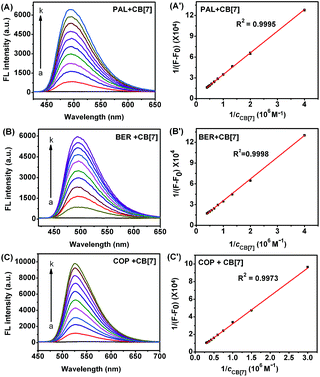
Although the fluorescence emission of pure PAL, BER, and COP was very weak, the fluorescence intensity greatly enhanced after they entered the hydrophobic cavity of CB[7], and a good linear relationship was found between 1/(F − F0) and 1/cCB[7] (Fig. 3), indicating the existence of a 1![[thin space (1/6-em)]](https://www.rsc.org/images/entities/char_2009.gif) :
:![[thin space (1/6-em)]](https://www.rsc.org/images/entities/char_2009.gif) 1 complex.22 From the plots the binding constants (K) for these complexes could be determined to be 1.10 × 10⁵, 1.77 × 10⁵, and 1.28 × 10⁴ M−1, respectively.
1 complex.22 From the plots the binding constants (K) for these complexes could be determined to be 1.10 × 10⁵, 1.77 × 10⁵, and 1.28 × 10⁴ M−1, respectively.
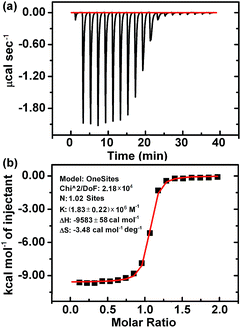
According to the above results, the interaction of CB[7] with LBT formed a inclusion complex, which decreased the amount of formed PAL–CB[7], BER–CB[7] and COP–CB[7], thus decreasing the fluorescence intensity of these complexes. However, it was difficult to obtain the K value of this complex using the same method as for the other three complexes due to the negligible change of fluorescence intensity upon addition of CB[7] to LBT solution (Fig. 1D). Thus the isothermal titration calorimetric (ITC) method, which is a powerful tool for investigating host–guest complex interactions, was applied to determine the binding constant (K) and the thermodynamic parameters (enthalpy and entropy changes ΔH° and ΔS°) of the LBT–CB[7] complex.23 From the ITC data (Fig. 4), the K value for the formation of the 1![[thin space (1/6-em)]](https://www.rsc.org/images/entities/char_2009.gif) :
:![[thin space (1/6-em)]](https://www.rsc.org/images/entities/char_2009.gif) 1 LBT–CB[7] complex was calculated to be (1.83 ± 0.22) × 106 M−1 with an “N” value of 1.02 by the curve fitting. The KLBT–CB[7] value was more than 10 times greater than those of PAL–CB[7], BER–CB[7] and COP–CB[7], which demonstrated the stronger binding of LBT with CB[7].
1 LBT–CB[7] complex was calculated to be (1.83 ± 0.22) × 106 M−1 with an “N” value of 1.02 by the curve fitting. The KLBT–CB[7] value was more than 10 times greater than those of PAL–CB[7], BER–CB[7] and COP–CB[7], which demonstrated the stronger binding of LBT with CB[7].
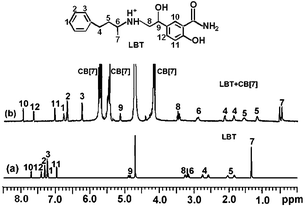
The formation of the LBT–CB[7] inclusion complex could be confirmed using 1H NMR spectroscopy (Fig. 5). Compared with the proton resonance of the unbound LBT molecule (Fig. 5a), the resonance of protons H1, H2, H3, H4, H5, H6 and H7 of the bound LBT in the 1H NMR spectrum of LBT–CB[7] complex shifted progressively up-field (Fig. 5b), indicating that CB[7] selectively bound the protonated phenylpropylamino residues due to cooperative hydrophobic and ion–dipole interactions and the well-matched size and morphology. The resonance of protons H8, H9, H10, H11 and H12 of LBT experienced a slight down-field shift, indicating this part of the molecule was located just outside the carbonyl portal of the CB[7] host.13
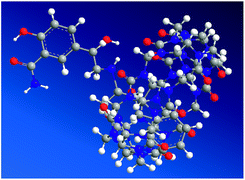
Molecular modeling calculations were optimized at a B3LYP/6-31G(d) level of density functional theory24–26 using the Gaussian 03 program. The results confirmed partial inclusion of LBT in the hydrophobic cavity of CB[7] (Fig. 6). It can be seen from molecular simulations that the phenylpropylamino group was protonated in acidic solution, giving the cationic form of LBT. This indicated that, in the energy-minimized structure, the phenylpropylamino group of the molecule located inside the host, however, the salicylamide part of the molecule located just outside the carbonyl portal of the CB[7] host.
Analytical performance
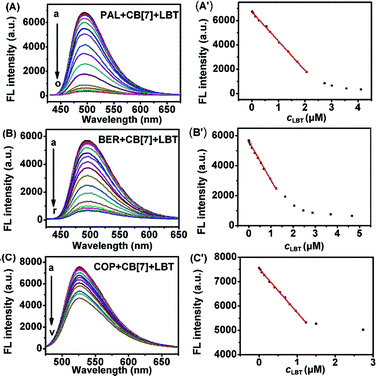
As shown in Fig. 7, with increasing concentration of LBT, the fluorescence intensities of PAL–CB[7], BER–CB[7] and COP–CB[7] linearly decreased, and then trended to minimum values at 2.64, 1.62 and 1.50 μM LBT, respectively. The linear ranges were 0.014–2.06 μM, 0.014–1.15 μM, and 0.034–1.23 μM, respectively. The linear regression equations were F = −2409.3c + 6732.4, F = −2408.8c + 5593.6, and F = −1761.9c + 7523.0 (c denotes the concentration of LBT in μM) with correlation coefficients of 0.9989, 0.9914, and 0.9963, and detection limits of 4.9 nM, 4.9 nM, and 12.0 nM at 3σ, respectively. The proposed method proved to have higher sensitivity and selectivity than other spectrofluorimetric methods for the detection of LBT reported in the literature, as presented in Table 1.| Technique | Linear range (μM) | Limit of detection (μM) | Detection wavelength (nm) | Reference |
|---|---|---|---|---|
| SPE-HPLC | 0.027–2.74 | 0.0033 | 220 | 3 |
| LC-MS-MS | — | 0.55 | — | 4 |
| SPME-LC-ESI-MS | 0.003–0.27 | 0.0003 | — | 5 |
| CE | 63.6–318.5 | 0.33 | — | 6 |
| Fluorescence optosensing | 0.027–0.68 | 0.009 | 435 | 7 |
| Spectrofluorimetry | 2.74–41.1 | 2.16 | 432 | 8 |
| Spectrophotometry | 2.74–27.4 | 2.13 | 410 or 456 | 9 |
| Resonance light scattering | 0.4–240.0 | 0.21 | 356 | 10 |
![[thin space (1/6-em)]](https://www.rsc.org/images/entities/char_2009.gif) |
||||
| Spectrofluorimetry | ||||
| PAL–CB[7] | 0.014–2.06 | 0.0049 | 495 | This work |
| BER–CB[7] | 0.014–1.15 | 0.0049 | 497 | |
| COP–CB[7] | 0.034–1.23 | 0.012 | 527 | |
Analytical application
Prior to the application of the proposed fluorescence method in drug analysis of human urine samples, the effects of commonly used tablet excipients and common ingredients in human urine on the determination of LBT were examined. The criterion for interference was fixed at a ±5% variation in the average fluorescence intensity calculated for the established level of LBT. Because PAL, BER and COP showed the same trends, the following examination used BER as an example (Table 2). The results did not show any interference of the common ingredients in tablet and urine samples. However, the components in urine samples, such as cysteine, alanine, phenylalanine and valine, could change the fluorescence intensity to a certain degree. Hence, they should be separated prior to the determination. Accordingly, the separation of LBT from the interfering substances could be achieved through an extraction method with an organic solvent such as dichloromethane.| Tolerance ratio in mass | Interferents |
|---|---|
| 3000 | Starch, glucose, sucrose, lactose, sorbitol, mannitol, boracic acid, hexane diacid, urea |
| 2000 | Methyl cellulose, Cl−, I−, CO32−, NO3−, SO42− |
| 1500 | Gelatin, glycin, uric acid |
| 1000 | Sodium hydroxymethyl cellulose, gum acacia power, tryptophan |
| 500 | Sodium carboxymethyl cellulose |
| 100 | NH4+, Na+, K+ |
| 50 | Mg2+, Zn2+, Ca2+, Fe3+, Mn2+ |
| 6 | Atenolol, bopindolol, acebutolol, metoprolol |
| 0.5 | Alanine, cysteine, cystine, phenylalanine, valine |
The results of the determination of LBT with the proposed fluorescent method were listed in Table 3. The standard deviations for commercial tablets were less than 0.73%, and the recoveries examined with a standard addition method were in the range of 98.2–99.7%. The detection of LBT in urine samples showed satisfactory recoveries, from 95.4 to 102.5%.
| Samples | Amount added or spiked | Amount found | Recovery (%) ± S.D |
|---|---|---|---|
| Drug 1 | 80 mg per grain | 79.78 mg | 99.7 ± 0.52 |
| Drug 2 | 80 mg per grain | 78.56 mg | 98.2 ± 0.73 |
| Urine 1 | 0.8 μg mL−1 | 0.82 μg mL−1 | 102.5 ± 0.17 |
| Urine 2 | 1.60 μg mL−1 | 1.57 μg mL−1 | 98.1 ± 0.25 |
| Urine 3 | 2.40 μg mL−1 | 2.29 μg mL−1 | 95.4 ± 0.30 |
This method could be employed to monitor the time-dependent concentration of LBT in the urine of healthy volunteers after the oral administration of the LBT medication. The volunteers were premedicated with 80 mg of LBT, and the urine was collected over 12 h at various times. The concentration of LBT in the urine increased with the metabolic time from 0 to 4 h, and reached a maximum in a period of 4.0–4.5 h. Subsequently, the concentration of LBT in the urine decreased. The result indicated that this method was promising as a cost-effective, sensitive, and selective technique for study of the pharmacokinetics of LBT.
Conclusions
This work designs a novel method for the determination of LBT through the supramolecular interaction of CB[7] with LBT and PAL, BER, or COP and their fluorescence characterization. The formation of PAL–CB[7], BER–CB[7], and COP–CB[7] complexes greatly enhances the fluorescence emission of PAL, BER, and COP due to their strong coplanar and rigid character. The LBT–CB[7] complex possesses a higher binding constant than PAL–CB[7], BER–CB[7], and COP–CB[7] complexes, thus the PAL, BER, or COP in the CB[7] cavity can be replaced by LBT to decrease the fluorescence emission of PAL–CB[7], BER–CB[7], and COP–CB[7]. Based on the competitive mode, the fluorescence method for the determination of LBT shows high sensitivity and good selectivity, and has successfully been applied in the analysis of LBT in pharmaceutical preparations and biological fluids. The CB[7]-based fluorescence method provides a robust tool for monitoring the drug metabolism in pharmaceutical treatment.Acknowledgements
We gratefully acknowledge the National Basic Research Program (2010CB732400) and the National Natural Science Foundation of China (21135002, 21121091). We are grateful to Dr Jiahuang Li from Nanjing University for her kind help in the ITC experiments.References
- P. Hemmersbach and R. De La Torre, J. Chromatogr. B, 1996, 687, 221–238 CrossRef CAS.
- H. Maurer, O. Tenberken, C. Kratzsch, A. Weber and F. T. Peters, J. Chromatogr. A, 2004, 1058, 169–181 CrossRef CAS PubMed.
- W. Boonjob, H. Sklenářová, F. J. Lara, A. M. García-Campaña and P. Solich, Anal. Bioanal. Chem., 2014, 406, 4207–4215 CrossRef CAS PubMed.
- M. Gergov, J. N. Robson, E. Duchoslav and I. Ojanperä, J. Mass Spectrom., 2000, 35, 912–918 CrossRef CAS.
- J. C. Whoq, H. L. Lord, J. Pawliszyn and H. Kataoka, J. Microcolumn Sep., 2000, 12, 255–266 CrossRef.
- R. Nehmé, A. Lascaux, R. Delépée, B. Claude and P. Morin, Anal. Chim. Acta, 2010, 663, 190–197 CrossRef PubMed.
- E. J. Llorent-Martínez, D. Šatínský and P. Solich, Anal. Bioanal. Chem., 2007, 387, 2065–2069 CrossRef PubMed.
- F. Belal, S. Al-Shaboury and A. S. Al-Tamrah, J. Pharm. Biomed. Anal., 2002, 30, 1191–1196 CrossRef CAS.
- F. Belal, S. Al-Shaboury and A. S. Al-Tamrah, Il Farmaco, 2003, 58, 293–299 CrossRef CAS.
- Q. Sun, X. C. Jing, J. Ma, J. Anzai, B. Z. Wang and X. Y. Du, Mater. Sci. Eng., C, 2009, 29, 271–274 CrossRef CAS PubMed.
- J. Lagona, P. Mukhopadhyay, S. Chakrabarti and L. Isaacs, Angew. Chem., Int. Ed., 2005, 44, 4844–4870 CrossRef CAS PubMed.
- S. Moghaddam, C. Yang, M. Rekharsky, Y. H. Ko, K. Kim, Y. Inoue and M. K. Gilson, J. Am. Chem. Soc., 2011, 133, 3570–3581 CrossRef CAS PubMed.
- L. P. Cao, M. Šekutor, P. Y. Zavalij, K. Mlinarić-Majerski, R. Glaser and L. Isaacs, Angew. Chem., Int. Ed., 2014, 53, 988–993 CrossRef CAS PubMed.
- V. N. Sueldo Occello and A. V. Veglia, Anal. Chim. Acta, 2011, 689, 97–102 CrossRef CAS PubMed.
- H. Tootoonchi, S. Yi and A. E. Kaifer, J. Am. Chem. Soc., 2013, 135, 10804–10809 CrossRef PubMed.
- C. F. Li, L. M. Du, W. Y. Wu and A. Z. Sheng, Talanta, 2010, 80, 1939–1944 CrossRef CAS PubMed.
- C. J. Li, J. Li and X. S. Jia, Org. Biomol. Chem., 2009, 7, 2699–2703 CAS.
- Y. X. Chang, Y. Q. Qiu, L. M. Du, C. F. Li and M. Guo, Analyst, 2011, 136, 4168–4173 RSC.
- J. Kim, I. S. Jung, S. Y. Kim, E. Lee, J. K. Kang, S. Sakamoto, K. Yamaguchi and K. Kim, J. Am. Chem. Soc., 2000, 122, 540–541 CrossRef CAS.
- A. Day, A. P. Arnold, R. J. Blanch and B. Snushall, J. Org. Chem., 2001, 66, 8094–8100 CrossRef CAS PubMed.
- G. Q. Wang, Y. F. Qin, L. M. Du a, J. F. Li, X. Jing, Y. X. Chang and H. Wu, Spectrochim. Acta, Part A, 2012, 98, 275–281 CrossRef CAS PubMed.
- M. Megyesi, L. Biczók and I. Jablonkai, J. Phys. Chem. C, 2008, 112, 3410–3416 CAS.
- Q. Li, D. S. Guo, H. Qian and Y. Liu, Eur. J. Org. Chem., 2012, 962–3971 Search PubMed.
- C. Lee, W. Yang and R. G. Parr, Phys. Rev. B: Condens. Matter Mater. Phys., 1988, 37, 785–789 CrossRef CAS.
- A. D. Becke, J. Chem. Phys., 1988, 88, 2547–2553 CrossRef CAS PubMed.
- A. D. Becke, Phys. Rev. A, 1988, 38, 3098–3100 CrossRef CAS.
| This journal is © The Royal Society of Chemistry 2015 |

