
Separation of small metabolites and lipids in spectra from biopsies by diffusion-weighted HR-MAS NMR: a feasibility study†
G.
Diserens
a,
M.
Vermathen
b,
C.
Precht
c,
N. T.
Broskey
d,
C.
Boesch
a,
F.
Amati
ad,
J.-F.
Dufour
e and
P.
Vermathen
*a
aDepts. Clinical Research and Radiology, University of Bern, Bern, Switzerland. E-mail: peter.vermathen@insel.ch
bDept. of Chemistry & Biochemistry, University of Bern, Bern, Switzerland
cDept. of Clinical Veterinary Medicine, Clinical Radiology, Vetsuisse-Faculty, University of Bern, Bern, Switzerland
dDept. of Physiology, University of Lausanne, Lausanne, Switzerland
eHepatology, Dept. Clinical Research and University Clinic for Visceral Surgery and Medicine, Inselspital, University of Bern, Bern, Switzerland
First published on 6th October 2014
Abstract
High Resolution Magic Angle Spinning (HR-MAS) NMR allows metabolic characterization of biopsies. HR-MAS spectra from tissues of most organs show strong lipid contributions that are overlapping metabolite regions, which hamper metabolite estimation. Metabolite quantification and analysis would benefit from a separation of lipids and small metabolites. Generally, a relaxation filter is used to reduce lipid contributions. However, the strong relaxation filter required to eliminate most of the lipids also reduces the signals for small metabolites. The aim of our study was therefore to investigate different diffusion editing techniques in order to employ diffusion differences for separating lipid and small metabolite contributions in the spectra from different organs for unbiased metabonomic analysis. Thus, 1D and 2D diffusion measurements were performed, and pure lipid spectra that were obtained at strong diffusion weighting (DW) were subtracted from those obtained at low DW, which include both small metabolites and lipids. This subtraction yielded almost lipid free small metabolite spectra from muscle tissue. Further improved separation was obtained by combining a 1D diffusion sequence with a T2-filter, with the subtraction method eliminating residual lipids from the spectra. Similar results obtained for biopsies of different organs suggest that this method is applicable in various tissue types. The elimination of lipids from HR-MAS spectra and the resulting less biased assessment of small metabolites have potential to remove ambiguities in the interpretation of metabonomic results. This is demonstrated in a reproducibility study on biopsies from human muscle.
1. Introduction
It has been shown that high resolution magic angle spinning (HR-MAS) NMR allows metabolic characterization of biopsies from different tissues like brain, prostate, liver, or muscle.1 Fast spinning around an axis inclined at the magic angle (54.7°) averages orientation dependent effects, thereby reducing the spectral line width.However, HR-MAS spectra from tissues of most organs show strong contributions from broad lipid signals. Although these may convey important information themselves,2 they are overlapping metabolite regions. This could hamper metabolite estimation and may lead to misinterpretation. Metabolite quantification and metabonomic analysis would therefore benefit from a separation of lipid resonances from those of small metabolites.
Spectral fitting may be applied for separating lipids from small metabolites.3 However, solely fitting the lipid contribution in spectra that contain also small metabolites is prone to artificial inclusion of metabolite contributions into the lipid fit. Fitting small metabolites and lipids simultaneously has many advantages, but it also introduces bias as to which metabolites to include and also on the included metabolites themselves, which is avoided in metabonomic analysis.
The Carr–Purcell–Meiboom–Gill (CPMG) sequence is commonly used as a T2-filter to reduce broad components and therefore also fat contributions from spectra, taking advantage of the short T2 relaxation times of lipids.2,4 However, long echo times would be required to eliminate most of the lipids,5 with consequently (A) reduced signal to noise also for small metabolites, (B) a T2 dependency of peak intensities impeding metabolite quantification, (C) heating of the sample, (D) J-evolution of spins, and (E) losing all information on lipids.
Besides shorter T2, lipids differ also from small metabolites in terms of much slower diffusion. Fast diffusing small metabolites may therefore be separated from slow diffusing lipids by NMR diffusion measurements. It has previously been shown that subtracting a strong diffusion weighted (DW) spectrum from a low DW spectrum can lead to a strong reduction or even elimination of spectral contributions from lipids. This was applied in high resolution liquid state NMR measurements of proteins,6 carbohydrates,7 as well as in rats8 and human blood plasma,9 and in in vivo measurements of the brain.10 HR-MAS NMR diffusion editing was also applied in heterogeneous mixtures containing liquid-, gel- and solid-like phases,11 as well as in different seeds.12
Moreover, an almost complete separation of small molecules and lipids may be obtained by a combination of both physical differences, i.e. combining diffusion gradient editing and the T2-filter.13 The two effects have been combined in oil–water samples14 for separate measurements of individual T2 attenuations of the two components, and conversely in vegetables for improved separated determination of diffusion constants.15 In liver biopsies, the two effects have been combined for distinguishing lipid and low molecular weight resonances for both improved relaxation and diffusion constant estimations, as this can provide information of metabolite changes inside the tissue.5 Liu et al. showed the possibility to separate the high molecular weight molecules by diffusion editing, the low molecular weight molecules by relaxation editing and applied a combined editing method (combined diffusion and T2-filter sequence) in human blood plasma for better lipoprotein analysis.9
However, to the best of our knowledge, diffusion gradient editing alone or its combination with a T2-filter has not yet been applied in HR-MAS spectra of biopsies for obtaining lipid-free small metabolite spectra.
The aim of our study was therefore to investigate different diffusion editing techniques in order to employ diffusion differences for separating lipid from small metabolite contributions in the spectra of various tissues for unbiased metabonomic analysis. Thus NMR-diffusion measurements applying different gradient strengths were performed on biopsies of human muscle. Spectra obtained at strong DW solely consisting of lipid signals were subtracted from those obtained at low DW including both small metabolites and lipids. In addition, the study aimed at simultaneously utilizing diffusion and T2 differences15 between small metabolites and lipids for an efficient separation. Therefore additional measurements were performed on biopsies from different organs and animals combining both effects.
In order to probe the impact of this editing method, it was applied in a reproducibility study of muscle spectra including chemometric analyses. The metabolite variability of two specimens of the same muscle was investigated before and after removing the lipid peaks. The secondary aim was to determine to what extent the metabolite profile of a single muscle specimen can be considered representative for the tissue.
2. Experimental
2.1 Biopsies
In order to test the lipid removal method under very different conditions, biopsies from different organs and animals were analyzed. The diffusion editing technique was tested and improved in human and pork muscle, sheep brain, and human liver biopsies. The method was then applied in a reproducibility study on human muscle. For all measurements on human and animal biopsies an ethical approval was obtained.2.2 1H high resolution magic angle spinning (HR-MAS) NMR
1H HR-MAS NMR experiments were performed on a Bruker Avance II spectrometer (Bruker Karlsruhe, Germany) operating at a resonance frequency of 500.13 MHz using a 4 mm HR MAS dual inverse 1H/13C probe equipped with a deuterium lock channel and with a magic angle gradient. The measurements were performed between 277 and 282 Kelvin according to the tissue type. In a preceding experiment the temperature control was calibrated under the same MAS conditions using a sample of 4% MeOH in MeOD-d4. Bruker TOPSPIN software (version 2.1, patch level 5) was used to acquire and process the NMR data. For all measurements the tissue was washed and placed together with D2O-based phosphate buffered saline (PBS, pH = 7, 50 mM) into the zirconium MAS rotor using a 12 μl insert.Additional CPMG measurements were performed on pork biopsies for parameter optimization, modifying the TE, the number of loops and the interpulse delay time for each loop. The four following combinations were used: (1) a TE of 76.8 ms with 192 loops of 0.4 ms; (2) a TE of 152 ms with 380 loops of 0.4 ms; (3) a TE of 152 ms with 38 loops of 4 ms; (4) a TE of 760 ms with 380 individual loops of 2 ms each.
2.2.2.1 2D-diffusion for investigating diffusion properties and for “internal” lipid removal. Diffusion measurements were first performed using a modified 2D stimulated echo experiment with bipolar gradient pulses and a longitudinal eddy current delay (“ledbpgp2s2d” from the Bruker pulse-program library), at a magic angle spinning speed of 8 kHz. The higher spinning speed was selected, because preceding measurements demonstrated a higher stability of the 2D-diffusion data. Diffusion times Δ were 50 ms and 200 ms and the gradient pulse length δ was 6 ms. Linear ramps of 64 different values of sinusoidal gradient pulses, varying from 0.6 to 32 G cm−1, were used. 16 scans were acquired at every gradient-strength with a recycle delay of 2 s.
The 2D-diffusion measurements were processed using Bruker Dynamics Center 2.0.8. The peaks were fitted using a bi-exponential model, taking all 64 points in F2 into account. In addition the individual spectra of the 64 different DWs were investigated. Spectra at stronger gradients, which exhibited purely lipid signals, were added, yielding a pure lipid spectrum with a good SNR. Depending on the number of added spectra, the weightings of different lipid components vary, if the diffusion constants are different. It turned out that for Δ = 50 ms ideally the last 20 spectra could be added to yield a pure lipid spectrum [see Results section 3.2.2]. This summed spectrum was then subtracted from the summed spectrum at low gradient strength (the first 20 individual spectra of the series were selected for the best SNR).
2.2.2.2 2D-diffusion for lipid removal from CPMG spectra for a reproducibility study. The 2D-diffusion sequence and the described add/subtract procedure were applied in spectra from human muscle biopsies. For the same needle biopsy samples, the lipid spectrum from 2D-diffusion was obtained on only one biopsy of each pair and then subtracted from the CPMG measurements of both biopsies after individual scaling of each lipid peak.
2.3 Muscle data analysis
Using literature ref. 18–24 and our own additional 2D correlation spectroscopy (1H1H-TOCSY) measurements, an overall of 18 metabolites and 11 lipid resonances were assigned.For chemometric analysis of the muscle biopsies for the reproducibility study, a total of 63 buckets (between 0.95 and 8.62 ppm) were selected, with a variable size according to the peak width. Spectral regions comprising only noise and pure lipid regions were excluded from all analyses to facilitate a comparison of the small metabolite content from the original and lipid-subtracted CPMG spectra (see ESI†, Fig. S1). In addition, some spectra were contaminated by lidocaine, the anaesthetic agent. Five spectral regions with potential contributions from lidocaine resonances (peaks at 1.37, 2.2, 3.37, 4.45, 7.21, 7.26 ppm) were also excluded from the analysis. The buckets were normalized by probabilistic quotient normalization (PQN)25 and scaled with Pareto scaling, which keeps the influence of noise low, while decreasing contributions from intense peaks and increasing the weight of intermediate peaks.26 MatLab (R2011b, The MathsWorks Inc.) was used for statistical analysis.
The whole muscle analysis (bucketing, normalization, scaling and statistical analysis) was first done on the pure CPMG spectra, and then repeated with the lipid-subtracted CPMG spectra [see 2.2.2.2], to evaluate the influence of the lipid removal on the reproducibility metabonomic study.
3. Results and discussion
The lipid removal edited method was first applied with 2D-diffusion measurements in human muscle biopsies to investigate and account for the impact of differences in diffusion times. The lipid removal was then improved by combining a 1D diffusion sequence with a CPMG train as a T2 filter and tested in several organs. Finally, the applicability and potential value of the lipid removal procedure were tested in a small reproducibility study on the same-needle biopsies.3.1 2D-diffusion of human muscle
The conventional analysis of the 2D-diffusion measurements demonstrated – as expected – clear differences between small metabolites, which diffuse faster, and lipid resonances (see Fig. 1). The results also show additional smaller differences between lipid resonances, which may lead to slightly varying lipid contributions in high DW spectra, depending on the diffusion weighting, or depending on the number of summed spectra from 2D measurements (see the next paragraph).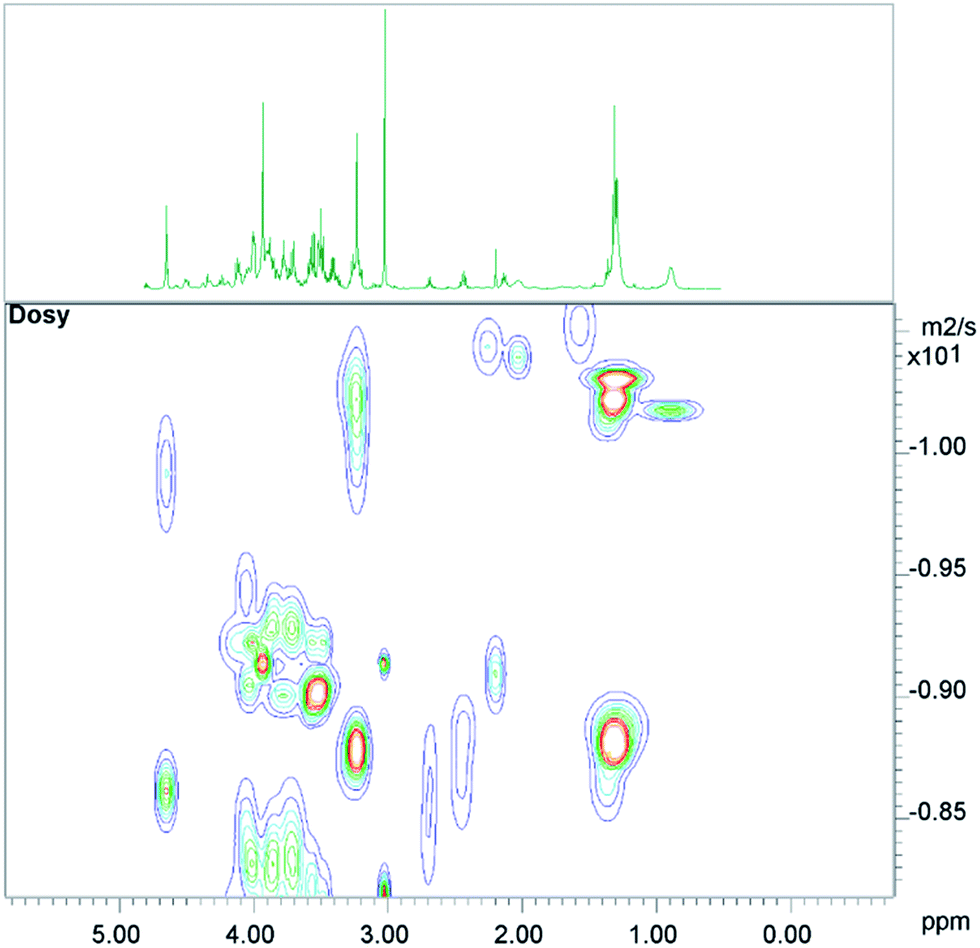 | ||
| Fig. 1 A 2D-DOSY plot of human muscle, with the corresponding 1D-CPMG spectrum shown above. | ||
3.2 2D-diffusion lipid removal
Different numbers of spectra with strong and weak DW, respectively, were added from the pseudo-2D data, (A) to obtain a sufficient SNR, (B) to determine and potentially adjust for slightly different spectral contributions of lipid moieties due to different diffusion constants. It turned out that the number of added spectra had only a minor influence on the spectral lipid contributions.
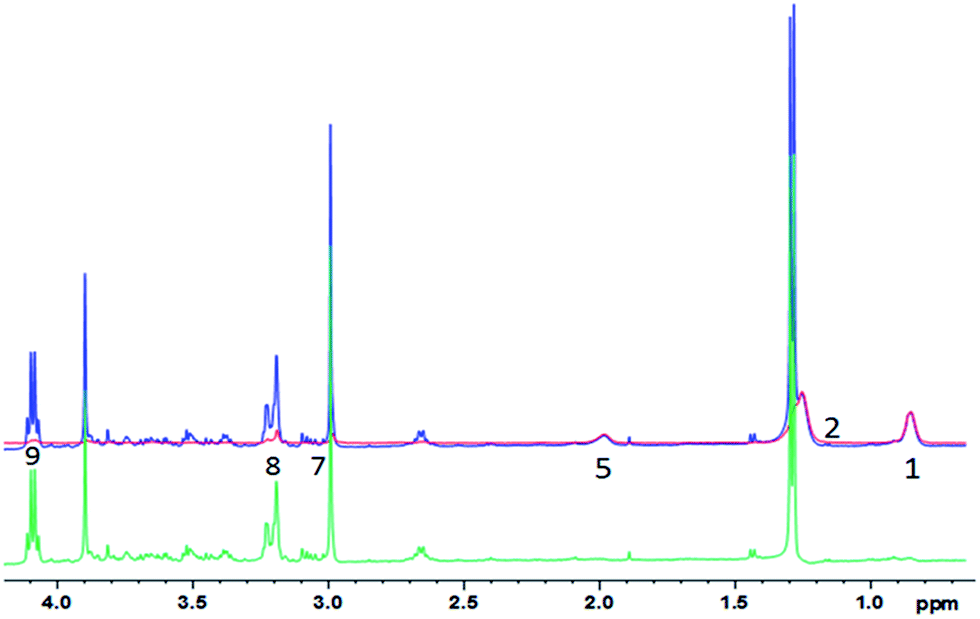
An example for the subtraction is shown in Fig. 2 (see Table 1 for lipid assignments). The lipid spectrum subtraction removes the shoulder from the creatine peak at 3.0 ppm, and effectively suppresses the lipid broad component underneath the choline, taurine and glycerophosphocholine (GPC) peaks (Fig. 2, inset). The strong overlap of the lactate peak at 1.3 ppm or leucine, isoleucine and valine at ∼1.0 ppm with lipids is similarly strongly reduced. The lipid peaks at 0.9 and 2.0 ppm are well suppressed, but small lipid residues remain, which are – besides residual artefacts – probably partly due to mobile lipids.22 Nevertheless, the residues still impede metabolite quantification or inclusion in chemometric methods. Therefore, for a chemometric analysis of small metabolites, the pure lipid regions (0.9 and 1.2 ppm) need to be omitted. However, the procedure yields clearly reduced lipid contributions for several metabolites like lactate at 1.33 ppm, choline, GPC, taurine, or creatine and may thus lead to more reliable metabolite estimations, while at the same time maintaining the maximum signal strength without relaxation damping, which also hampers metabolite quantification. Furthermore, the pure lipid spectrum from the 2D diffusion data can be analyzed separately, besides the possibility to perform a regular diffusion analysis.
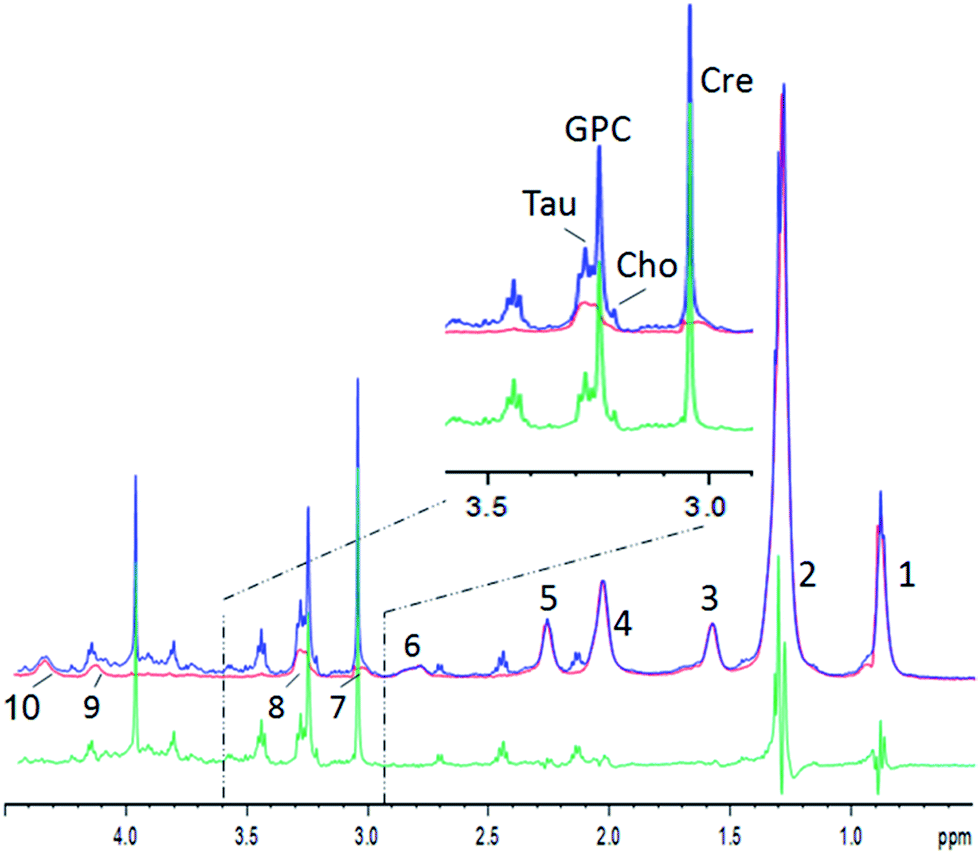 | ||
| Fig. 2 Example of human muscle diffusion spectra between 0.5 and 4.5 ppm. Blue: the summed spectrum with low DW showing small metabolites and strong lipid resonances; red: the summed spectrum with strong DW showing lipids only; green: the difference spectrum. Inset: the zoomed region. Lipid resonances are assigned according to Table 1. | ||
| # | Lipid part | ppm |
|---|---|---|
| 1 | ω-CH3 | 0.91 |
| 2 | –(CH2)n | 1.3 |
| 3 | β-CH2 | 1.59 |
| 4 | –CH2–CH![[double bond, length as m-dash]](https://www.rsc.org/images/entities/char_e001.gif) |
2.03 |
| 5 | α-CH2 | 2.26 |
| 6 | CH–CH2–CH |
2.78 |
| 7 | Tentatively assigned to CH2 lysyl protein | 3.03 |
| 8 | (–N+(CH3)3)phosphatidylcholine | 3.25 |
| 9 | CH2-glyceryl | 4.15 |
| 10 | Cho–a–CH2; CH2-glyceryl | 4.35 |
| 11 | –CHCH– |
5.32 |
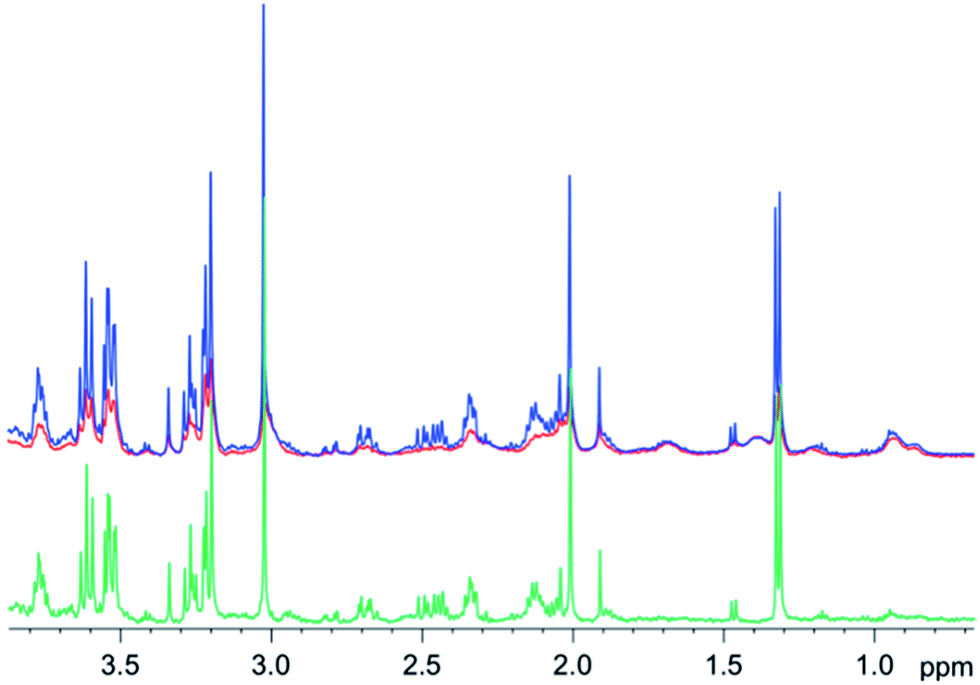
T2 differences between lipid resonances5 result in different signal intensities in CPMG spectra compared to those in standard 2D diffusion measurements. Therefore, a subtraction of the entire lipid spectrum after scaling with a single factor would leave remaining lipid signals, depending on their respective T2 differences. Instead, a specific intensity scaling for each resonance in the high DW spectra was chosen to minimize the residue (but retaining frequency and line width). This procedure allows for an effective lipid removal (Fig. 3) and is similar to fitting the lipid resonances, however, without the problem to include resonances from small metabolites into the fit. The figure demonstrates that the lipid contributions underlying some of the small metabolites are removed to a large extent. However, as for the subtraction of the high from the low DW spectra, residual artefacts remain at 0.9 and 1.2 ppm.
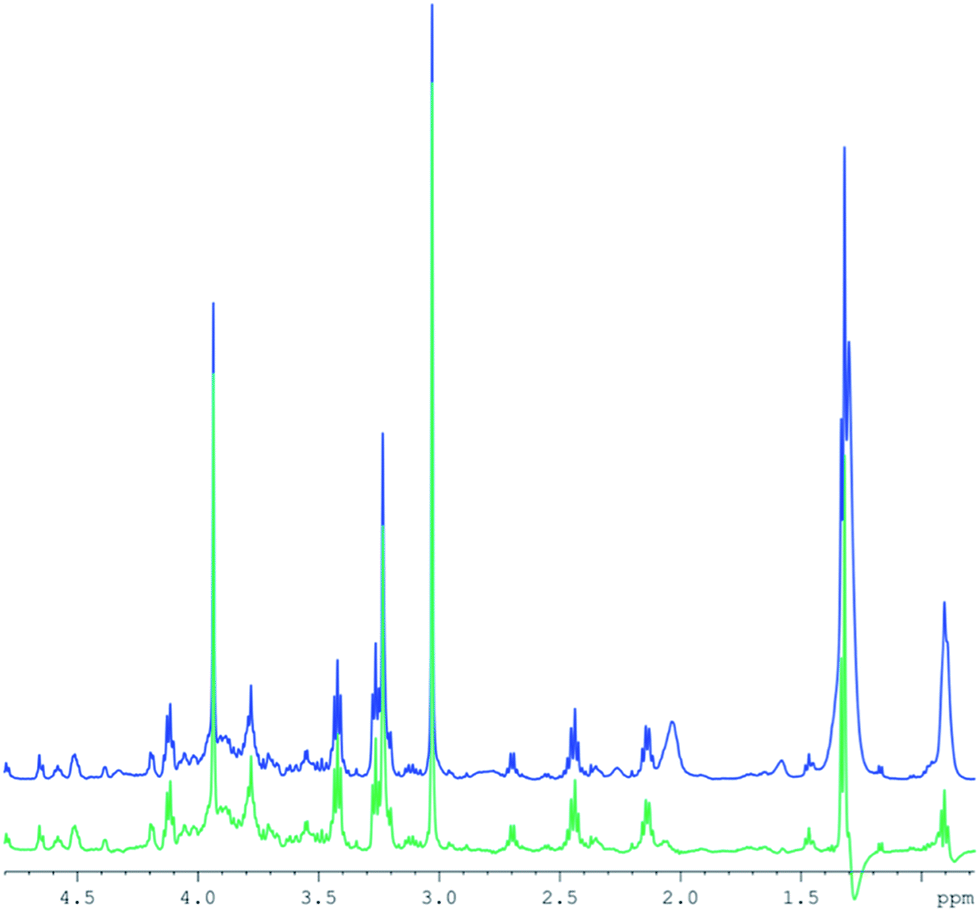 | ||
| Fig. 3 Example of human muscle spectra subtraction combining separate CPMG spectra and diffusion weighted spectra, using variable scaling of the lipid resonances. Blue: the CPMG spectrum (512 transients). Green: the difference spectrum. | ||
3.3 1D diffusion-T2 filter measurements for lipid removal
| Spectrum in Fig. 4 | TE [ms] | Number of loops | Interpulse delay [ms] | Comment on spectra |
|---|---|---|---|---|
| 1 – red | 76.8 | 192 | 0.4 | No visual J-modulation, good SNR |
| 2 – green | 152 | 380 | 0.4 | No visual J-modulation, slightly decreased intensities, stronger decreased lipids |
| 3 – cyan | 152 | 38 | 4 | Strong J-modulation |
| 4 – blue | 760 | 380 | 2 | Lipids entirely suppressed, but J-modulation and strong reduction of metabolite intensities |
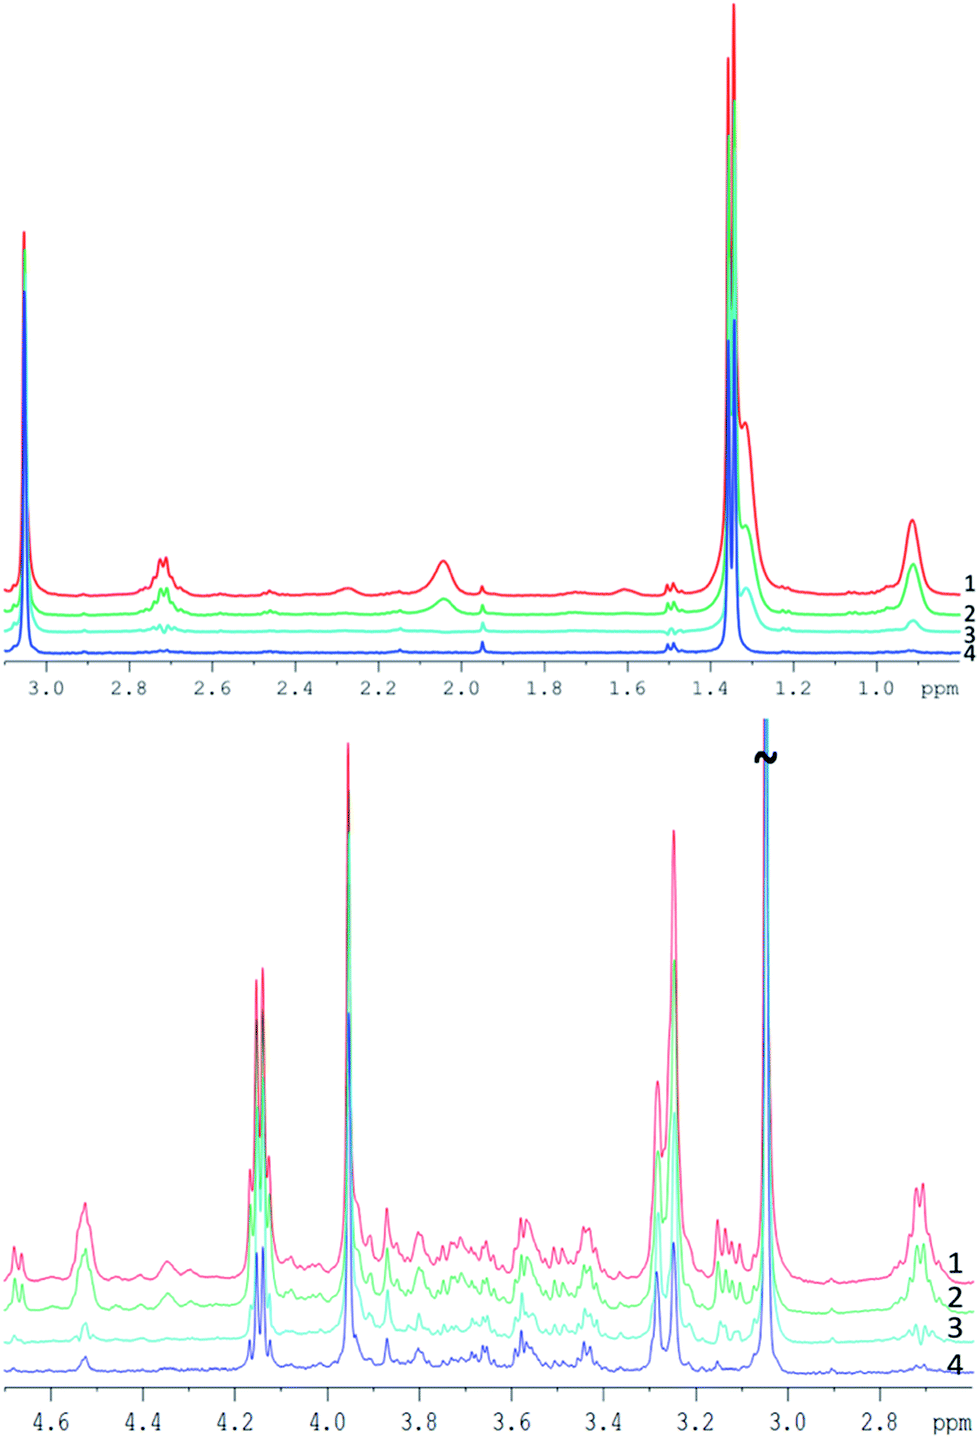 | ||
| Fig. 4 Example of pork muscle CPMG spectra acquired with different parameters (see Table 2), all spectra are scaled to their creatine peak. Top: spectra between 0.8 and 3.1 ppm. Bottom: spectra between 2.6 and 4.7 ppm. | ||
Spectrum 1 (TE = 76.8 ms) and spectrum 2 (TE = 152 ms) appear quite similar despite the doubled echo time, with only a small decrease of the peak intensity for a longer TE. Both spectra were acquired with 0.4 ms interpulse delay time and do not demonstrate substantial J-modulation.
Spectrum 3 was acquired at the same TE as spectrum 2, but with a 10-time longer interpulse delay time (4 ms). The strong J-evolution leads to complicated spectral patterns and reduced signal intensities (visually e.g. at 1.5, 2.7 or 3.15 ppm) hampering metabolite quantification and inclusion in metabonomic analysis. The much greater difference of spectrum 3 compared to spectra 1 and 2 points out the strong impact of the interpulse delay time for each loop (see also ref. 27).
Increasing the echo time to 760 ms reduced considerably the lipid content and yielded an almost fat free spectrum (spectrum 4). However, metabolite resonances were also clearly reduced at this long TE, as seen e.g. at the cysteine multiplet at 3.1 ppm which disappears entirely in the noise, as well as clear intensity decreases of resonances between 3.5 and 3.8 ppm or at 2.7 ppm. Thus, increasing only the TE appears not well suited for complete removal of lipid contributions, because of a low SNR.
In conclusion, the results of the interpulse delay time and TE variation in the original CPMG sequence suggest that the combination of a CPMG sequence at moderate TE but short interpulse spacing with a DW module and subsequent lipid subtraction appears most promising for complete lipid removal while maintaining signals from small metabolites for analysis.
 | ||
| Fig. 5 1D diffusion-CPMG spectra of a pork muscle (blue: low DW; red: strong DW; green: difference). For the lipid assignment, see Table 1. | ||
Similar results were obtained for spectra from sheep brain biopsies, though with much less prominent lipids (Fig. 6) and in the spectra of human liver with very strong lipid peaks (Fig. 7), thus, suggesting that this method is applicable in various tissue types.
 | ||
| Fig. 6 1D diffusion–CPMG spectra of a sheep brain (blue: low DW; red: strong DW; green: difference). | ||
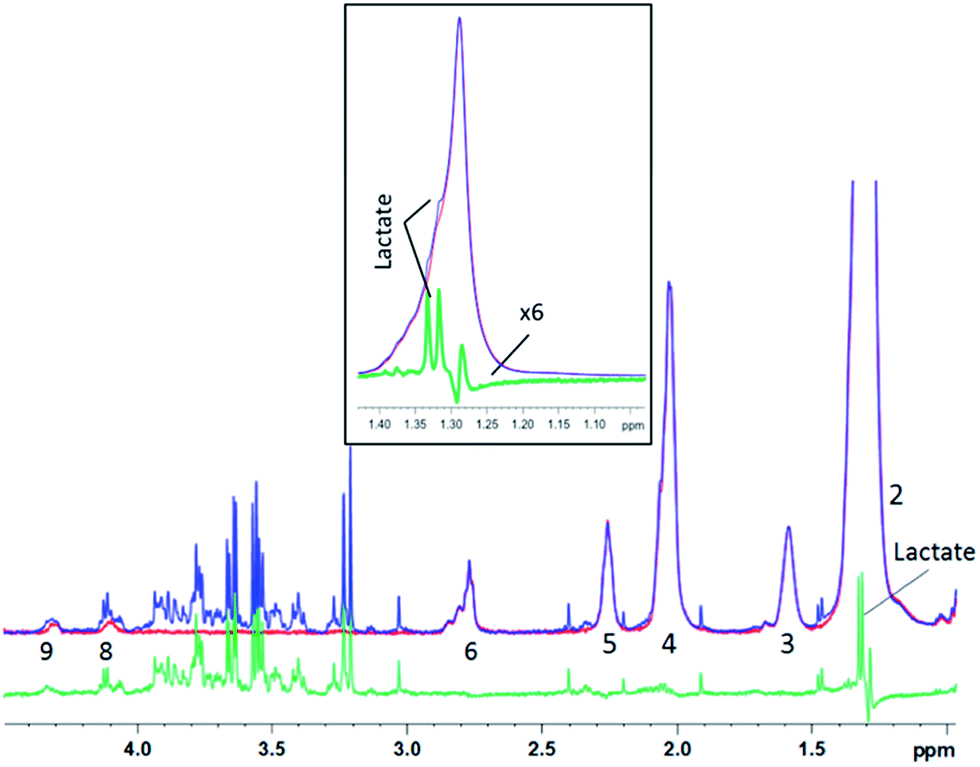 | ||
| Fig. 7 1D diffusion–CPMG spectra of a human liver sample (blue: low DW; red: strong DW; green: difference). For lipid assignment, see Table 1. Inset: zoom on the 1.15–1.45 ppm region – the subtracted spectrum is increased 6 times for a better visualization of the lactate peak. | ||
For the liver spectra, a residual lipid artefact can be seen at 1.2 ppm after subtraction (Fig. 7), probably due to the very high amount of lipid with the –(CH2)n lipid peak being 20 times higher than the creatine peak at 3.05 ppm. However, the lactate peak is clearly detectable in the subtracted spectrum and appears unaffected from lipids (see the inset). Lactate could thus be included in the metabonomic analysis, while it was almost hidden by lipids in the original spectrum (Fig. 7 – inset).
The 2D diffusion experiments permitted a flexible adjustment of strong and low diffusion weighted spectra for the best balance between metabolite attenuation and SNR. However, after establishing the required DW for optimal lipid removal, 1D-diffusion measurements may be preferred in the future for a better SNR and shorter scan times. The combined diffusion-CPMG sequence yielded high quality small metabolite and lipid spectra with no obvious spectral impairment compared to a regular CPMG sequence and benefits from amplification of simultaneous T2 and diffusion filters.
3.4 Same-needle biopsy analysis: comparison with and without diffusion spectroscopy editing
For testing the potential of the lipid removal procedure, original CPMG spectra of repeated measurements on the same needle biopsies were analyzed and compared to the corresponding CPMG spectra with lipid subtraction, using the resonance-specific scaling, as described in 3.2.2.Principal Component Analysis (PCA) of the entire spectrum (Fig. 8) without lipid removal demonstrated clustering for most of the same needle biopsies, both on PC1/PC2 and PC2/PC3, indicating spectral similarities between them. However, because of considerable differences among the same needle biopsies in few subjects there are no significant group differences for PC1 (p = 0.15), PC2 (p = 0.23) and PC3 (p = 0.05).
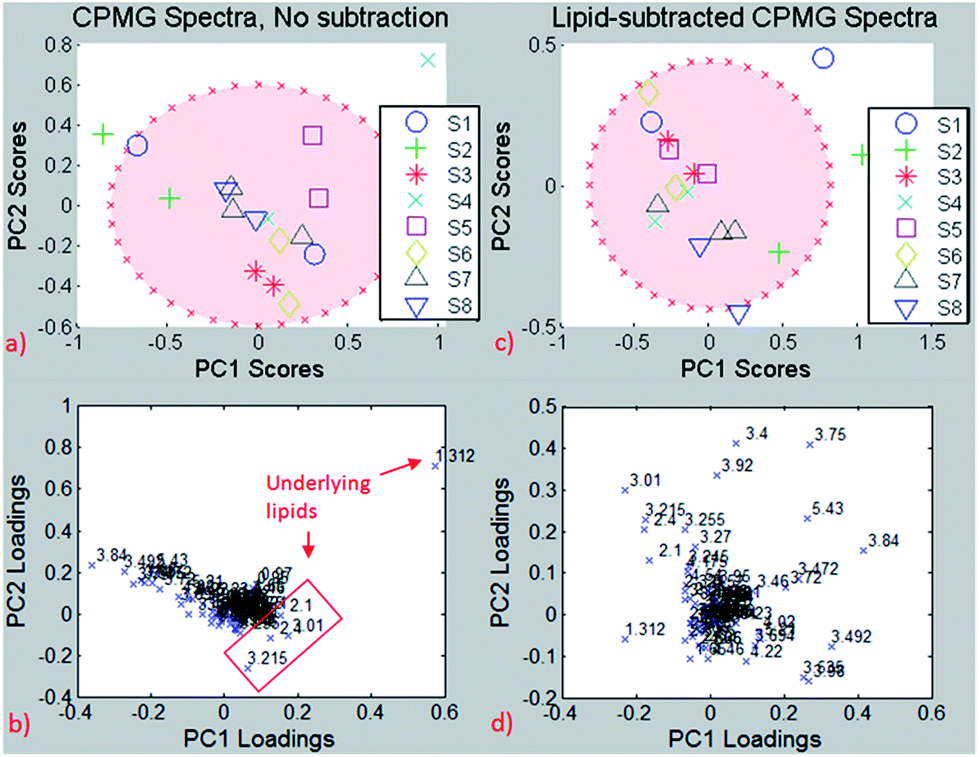 | ||
| Fig. 8 Same-needle biopsy analysis without lipid subtraction (left) and with lipid subtraction (right). Up: PCA, down: loading plots. Red ellipse: 95% confidence interval. | ||
The PCA results reveal one biopsy (S4) outside of the 95% confidence interval (Fig. 8a), and the loading plot (Fig. 8b) indicates the bucket at 1.3 ppm to be responsible for this separation, which is most likely due to the –(CH2)n lipid group besides lactate. The loading plot from the PCA using non-subtracted spectra is dominated by lipid peaks (despite the exclusion of pure lipid regions from the analysis) and therefore reveals the possible influence of the lipid content on chemometric analyses for metabolites that are biased by the underlying lipid.
The analysis was repeated after lipid subtraction of the CPMG spectra in order to reduce the lipid contribution in the principal component analysis separation. The PCA of the lipid-removed spectra (Fig. 8c) shows better clustering of same-needle biopsies (significant for PC2, p = 0.03), as well as a more homogeneous loading plot (Fig. 8d). Thus, the PCA separation is due to a combination of different metabolites and not dominated by lipids as in the non-subtracted spectra. The two biopsies from sample S4 are much closer to each other after the lipid removal than before, indicating that the two biopsies have a similar metabolite but different lipid contents. The results suggest that lipid removal in this reproducibility study leads to clustering and group separation that is based predominantly on small metabolite differences instead of lipid contributions. If on the other hand lipid components are the focus of interest, the pure lipid spectra used for subtraction can be analysed accordingly in the absence of small metabolites.
A secondary aim of this reproducibility study was to investigate how far the metabolite profile of a single biopsy can be considered representative for the tissue under investigation. Same needle biopsies harvested from the same muscle demonstrated not only similarities but also quite surprisingly strong differences in the metabolite content as obtained from HR-MAS. This variability needs to be taken into account not only in longitudinal HR-MAS studies on muscle tissue but also for any other study that relies on the assumption that a biopsy sample represents a specific muscle type. It should be noted that the quite high variability also among the same needle biopsies was not due to the spectral quality, but may be due to the muscle fiber type composition.28 It has been suggested to use large biopsy samples to reduce intra-individual variation in the percentages of fast and slow fibers,29 although other studies have found only low variation in fiber type distribution within single biopsies.30 As discussed, a high variability in the lipid region may occur and is probably due to varying inclusions of small residual contributions from extramyocellular lipids despite careful prevention during biopsy harvesting.
4. Conclusions
Spectra of biopsies from many different organs show, besides small metabolites, strong contributions from lipids, which often even dominate the spectra. This strongly impedes correct small metabolite quantification and metabonomic analysis. To overcome this problem, we took advantage of diffusion differences between small metabolites and lipids combined with T2 differences to obtain lipid-free spectra.A reproducibility study of the same-needle muscle biopsy measurements demonstrated the applicability of the method and its potential value, by shifting the separation between groups from lipid contributions to different other metabolites. The elimination of lipids from the HR-MAS spectra and the resulting less biased assessment of small metabolites thus have potential to remove ambiguities in the interpretation of metabonomic results. Moreover, the diffusion scans permit a separate lipid analysis and a regular diffusion analysis without expanding the measurement time.
Acknowledgements
This work was supported by the Swiss National Science Foundation SNF grant #320030-138150, SNF Ambizione grant PZ00P3_126339 and BASPO 11-09.Notes and references
- J. C. Lindon, O. P. Beckonert, E. Holmes and J. K. Nicholson, Prog. Nucl. Magn. Reson. Spectrosc., 2009, 55, 79–100 CrossRef CAS PubMed.
- I. F. Duarte, E. G. Stanley, E. Holmes, J. C. Lindon, A. M. Gil, H. Tang, R. Ferdinand, C. G. McKee, J. K. Nicholson, H. Vilca-Melendez, N. Heaton and G. M. Murphy, Anal. Chem., 2005, 77, 5570–5578 CrossRef CAS PubMed.
- D. Graveron-Demilly, Magn. Reson. Mater. Phys., Biol. Med., 2014, 27, 113–130 CrossRef PubMed.
- V. Righi, C. Durante, M. Cocchi, C. Calabrese, F. G. Di, F. Lecce, A. Pisi, V. Tugnoli, A. Mucci and L. Schenetti, J. Proteome Res., 2009, 8, 1859–1869 CrossRef CAS PubMed.
- O. M. Rooney, J. Troke, J. K. Nicholson and J. L. Griffin, Magn. Reson. Med., 2003, 50, 925–930 CrossRef CAS PubMed.
- J. P. Ribeiro, M. Palczewska, S. Andre, F. J. Canada, H. J. Gabius, J. Jimenez-Barbero, B. Mellstrom, J. R. Naranjo, D. J. Scheffers and P. Groves, Anal. Biochem., 2010, 396, 117–123 CrossRef CAS PubMed.
- H. Kaehlig, K. Dietrich and S. Dorner, Monatsh. Chem., 2002, 133, 589–598 CrossRef.
- R. A. De Graaf and K. L. Behar, Anal. Chem., 2003, 75, 2100–2104 CrossRef CAS PubMed.
- M. Liu, J. K. Nicholson and J. C. Lindon, Anal. Chem., 1996, 68, 3370–3376 CrossRef CAS.
- N. Kunz, C. Cudalbu, V. Mlynarik, P. S. Huppi, S. V. Sizonenko and R. Gruetter, Magn. Reson. Med., 2010, 64, 939–946 CrossRef CAS PubMed.
- D. Courtier-Murias, H. Farooq, H. Masoom, A. Botana, R. Soong, J. G. Longstaffe, M. J. Simpson, W. E. Maas, M. Fey, B. Andrew, J. Struppe, H. Hutchins, S. Krishnamurthy, R. Kumar, M. Monette, H. J. Stronks, A. Hume and A. J. Simpson, J. Magn. Reson., 2012, 217, 61–76 CrossRef CAS PubMed.
- L. Lam, R. Soong, A. Sutrisno, V. R. de, M. J. Simpson, H. L. Wheeler, M. Campbell, W. E. Maas, M. Fey, A. Gorissen, H. Hutchins, B. Andrew, J. Struppe, S. Krishnamurthy, R. Kumar, M. Monette, H. J. Stronks, A. Hume and A. J. Simpson, J. Agric. Food Chem., 2014, 62, 107–115 CrossRef CAS PubMed.
- J. A. Chin, A. Chen and M. J. Shapiro, J. Comb. Chem., 2000, 2, 293–296 CrossRef CAS PubMed.
- J. G. Seland, G. H. Sørland, H. W. Anthonsen and J. Krane, Appl. Magn. Reson., 2003, 24, 41–53 CrossRef CAS.
- D. Vandusschoten, P. A. deJager and H. VanAs, J. Magn. Reson., Ser. A, 1995, 116, 22–28 CrossRef CAS.
- N. T. Broskey, C. Greggio, A. Boss, M. Boutant, A. Dwyer, L. Schlueter, D. Hans, G. Gremion, R. Kreis, C. Boesch, C. Canto and F. Amati, J. Clin. Endocrinol. Metab., 2014, 99, 1852–1861 CrossRef CAS PubMed.
- F. Amati, J. J. Dube, E. Alvarez-Carnero, M. M. Edreira, P. Chomentowski, P. M. Coen, G. E. Switzer, P. E. Bickel, M. Stefanovic-Racic, F. G. Toledo and B. H. Goodpaster, Diabetes, 2011, 60, 2588–2597 CrossRef CAS PubMed.
- M. Oostendorp, U. F. Engelke, M. A. Willemsen and R. A. Wevers, Clin. Chem., 2006, 52, 1395–1405 CAS.
- U. Sharma, S. Atri, M. C. Sharma, C. Sarkar and N. R. Jagannathan, NMR Biomed., 2003, 16, 213–223 CrossRef CAS PubMed.
- V. Righi, O. Andronesi, D. Mintzopoulos and A. A. Tzika, Int. J. Mol. Med., 2009, 24, 749–757 CAS.
- N. K. Srivastava, S. Pradhan, B. Mittal, R. Kumar, C. M. Pandey and G. A. Gowda, NMR Biomed., 2008, 21, 89–100 CrossRef CAS PubMed.
- D. Zietkowski, R. L. Davidson, T. R. Eykyn, S. S. De Silva, N. M. Desouza and G. S. Payne, NMR Biomed., 2010, 23, 382–390 CAS.
- J. M. Hakumaki and R. A. Kauppinen, Trends Biochem. Sci., 2000, 25, 357–362 CrossRef CAS.
- M. Liu, H. Tang, J. K. Nicholson and J. C. Lindon, Magn. Reson. Chem., 2002, 40, S83–S88 CrossRef CAS.
- F. Dieterle, A. Ross, G. Schlotterbeck and H. Senn, Anal. Chem., 2006, 78, 4281–4290 CrossRef CAS PubMed.
- A. M. Weljie, J. Newton, P. Mercier, E. Carlson and C. M. Slupsky, Anal. Chem., 2006, 78, 4430–4442 CrossRef CAS PubMed.
- O. Beckonert, M. Coen, H. C. Keun, Y. Wang, T. M. Ebbels, E. Holmes, J. C. Lindon and J. K. Nicholson, Nat. Protoc., 2010, 5, 1019–1032 CrossRef CAS PubMed.
- P. Vermathen, R. Kreis and C. Boesch, Magn. Reson. Med., 2004, 51, 253–262 CrossRef CAS PubMed.
- R. S. Staron, F. C. Hagerman, R. S. Hikida, T. F. Murray, D. P. Hostler, M. T. Crill, K. E. Ragg and K. Toma, J. Histochem. Cytochem., 2000, 48, 623–629 CrossRef CAS PubMed.
- E. Blomstrand and B. Ekblom, Acta Physiol. Scand., 1982, 116, 437–442 CrossRef CAS PubMed.
Footnote |
| † Electronic supplementary information (ESI) available: Table of spectral regions that were excluded from the analysis of the same-needle biopsy; the corresponding muscle spectrum indicating the excluded regions. See DOI: 10.1039/c4an01663g |
| This journal is © The Royal Society of Chemistry 2015 |