
Glyconanoparticles for colorimetric bioassays
María J.
Marín
a,
Claire L.
Schofield
a,
Robert A.
Field
b and
David A.
Russell
*a
aSchool of Chemistry, University of East Anglia, Norwich Research Park, Norwich, Norfolk NR4 7TJ, UK. E-mail: d.russell@uea.ac.uk
bDepartment of Biological Chemistry, John Innes Centre, Norwich Research Park, Norwich, Norfolk NR4 7UH, UK
First published on 3rd October 2014
Abstract
Carbohydrate molecules are involved in many of the cellular processes that are important for life. By combining the specific analyte targeting of carbohydrates with the multivalent structure and change of solution colour as a consequence of plasmonic interactions with the aggregation of metal nanoparticles, glyconanoparticles have been used extensively for the development of bioanalytical assays. The noble metals used to create the nanocore, the methodologies used to assemble the carbohydrates on the nanoparticle surface, the carbohydrate chosen for each specific target, the length of the tether that separates the carbohydrate from the nanocore and the density of carbohydrates on the surface all impact on the structural formation of metal based glyconanoparticles. This tutorial review highlights these key components, which directly impact on the selectivity and sensitivity of the developed bioassay, for the colorimetric detection of lectins, toxins and viruses.
 María J. Marín | María José Marín received her PhD from the University of East Anglia, Norwich, UK, in 2013 under the supervision of Prof. David A. Russell working on the intracellular analysis of pH and nitric oxide using fluorescent based nanoparticles and probes. She is currently a postdoctoral researcher in the same group working on the use of functionalised nanoparticles for biological applications including: virus detection and intracellular measurements of target analytes. She was recently awarded the Roscoe Gold Medal for Chemistry and the Westminster Medal at the ‘SET for Britain’ held at the UK Houses of Parliament in 2014. |
 Claire L. Schofield | Claire L. Schofield completed her undergraduate studies and PhD at the University of East Anglia (UEA), Norwich, UK, under the supervision of Prof. David A. Russell and Prof. Robert A. Field. Her research focussed on the development of glyconanoparticles for the colorimetric detection of toxins. |
 Robert A. Field | Rob Field is a Project Leader in the Department of Biological Chemistry at JIC and honorary Professor of Chemistry at UEA. He has over 25 years research experience in carbohydrate chemistry and chemical biology. He maintains extensive research collaborations around the world, reflecting research interests that range from bacterial adhesion and infection, through polysaccharide biochemistry and enzymology to the development of small molecule inhibitor approaches to understand plant and microbial carbohydrate metabolism. He is currently Chair of the RSC Carbohydrate Group, co-director of the BBSRC Network on Glycoscience Tools for Biotechnology and Bioenergy (IBCarb) and co-founder of Iceni Diagnostics Ltd. |
 David A. Russell | David A. Russell is a Professor of Chemistry at the University of East Anglia, Norwich, UK. He is currently Head of School. His research focuses on the synthesis and functionalisation of nanoparticles for the development of: in vitro diagnostics; the intracellular measurement of target analytes; and the delivery of photosensitisers for photodynamic cancer therapy. He is a current member of the editorial advisory board for the Royal Society of Chemistry journal Analyst, founder and chief scientific officer of Intelligent Fingerprinting Ltd and, together with Rob Field, co-founder of Iceni Diagnostics Ltd. |
Introduction
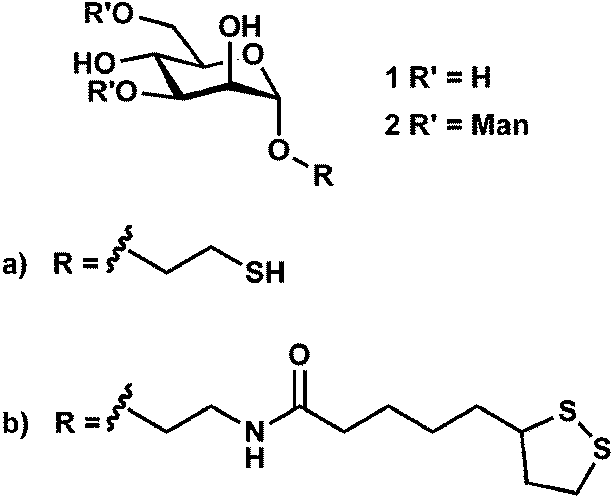
The surface of mammalian cells is covered with a dense coating of carbohydrates known as the glycocalyx.1,2 These cell surface carbohydrates are involved in numerous biological processes that are important for life, including: protein–carbohydrate interactions, associated with blood coagulation, the immune and pre-immune system, and the circulation and activity of pituitary hormones;3 carbohydrate–carbohydrate interactions, involved in embryogenesis, metastasis, fertilisation, and myelin compaction;4 and cell surface receptors that are ‘hijacked’ by protein toxins (e.g. cholera, tetanus and shiga toxins), by bacteria (e.g. Escherichia coli and Campylobacter jejuni) and viruses (e.g. influenza, herpes and papilloma) as a means of initiating infection.5–9With consideration of the importance of the biological processes that involve carbohydrate interactions, a wide variety of techniques have been developed to study ‘glycomics’.10,11 For example, carbohydrate microarrays,12,13 carbohydrate-modified polymers14–16 and carbohydrate-functionalised microparticles17 have all been developed to study carbohydrate recognition. Recently, the use of nanostructures functionalised with carbohydrates to study the processes and interactions in which carbohydrates are involved has grown substantially. Important characteristics of these ‘glyconanoparticles’ are the ease of functionalisation of the nanoparticle structure and their ability to mimic biological surfaces.18–20 Glyconanoparticles can be specifically tailored to allow for the bioanalytical detection of various biological targets.21–23 Detection of such targets can be achieved by varying several properties of the carbohydrate-functionalised nanoparticles viz.: (1) the material used to create the nanocore and the methodology applied to assemble the carbohydrate on the nanoparticle surface; (2) the carbohydrate ligand itself; (3) the length of the anchor chain tethering the carbohydrate to the nanoparticle surface; and (4) the density of carbohydrate molecules on the nanoparticle surface. Fig. 1 highlights all of these parameters with the structure of a gold, or silver, glyconanoparticle where the ligands are self-assembled to the metal surface via a thiol moiety.
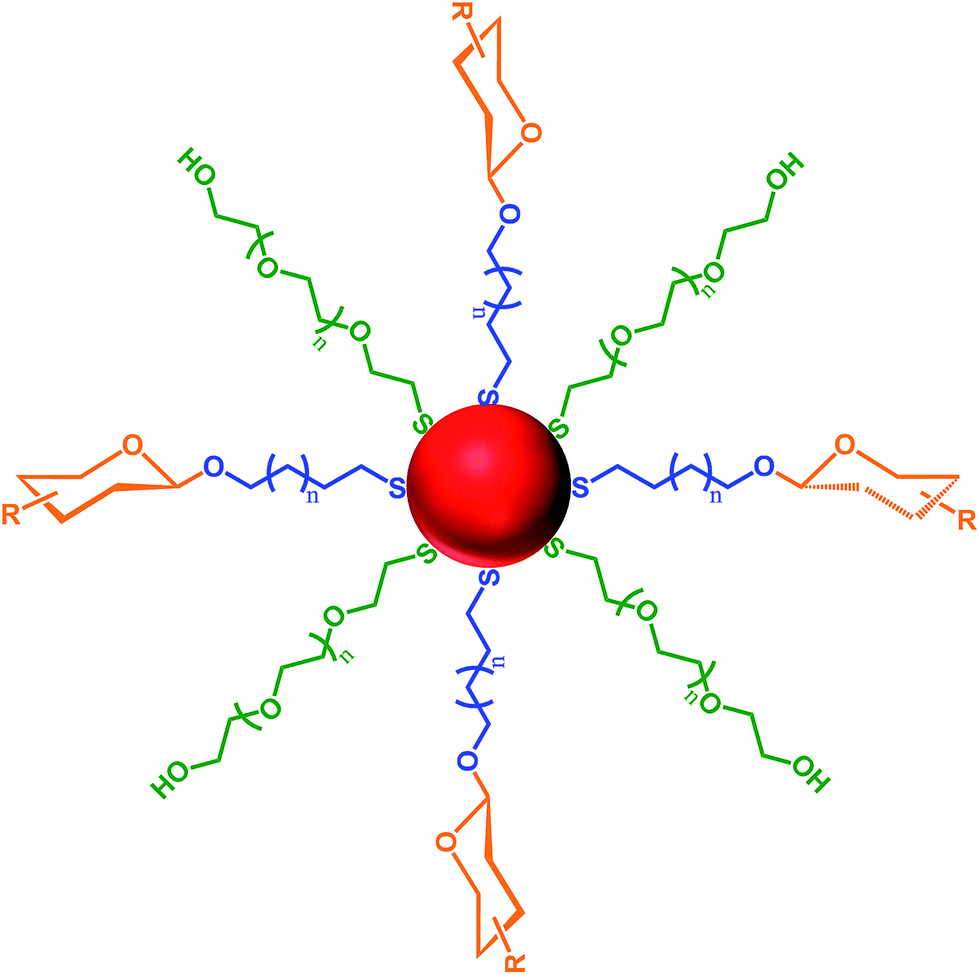 | ||
| Fig. 1 The structure of carbohydrate-functionalised nanoparticles showing the four variables used for the construction of a glyconanoparticle: (1) the nanoparticle core (red); (2) the carbohydrate chosen for each specific target (orange); (3) the anchor chain length that separates the carbohydrate from the nanoparticle core (blue); and (4) additional molecules, such as polyethylene glycol (PEG), used to dilute the density of carbohydrates on the nanoparticle surface (green). | ||
When the dimensions of metal particles are reduced to the nanoscale, the optical characteristics exhibited by a solution of the nanoparticles change from those of the bulk metal. The optical properties of metal nanoparticles are dominated by collective oscillations of conduction electrons in resonance with the incident electromagnetic radiation.24 This phenomenon is known as surface plasmon resonance, which is determined by the metal, the size and shape of the nanoparticles, by the distance between the particles, and by the dielectric properties of the surrounding medium.25–27 Gold nanoparticles of ca. 16 nm diameter in aqueous suspension exhibit an intense surface plasmon absorption band centred at 520 nm and consequently the solution appears red in colour. This optical property is distance-dependent and upon aggregation, coupling interactions between the surface plasmon fields of the nanoparticles occur resulting in a broadening and a red-shift of the surface plasmon absorption band. Consequently, upon aggregation, when the interparticle distance decreases to less than 2.5 times the particles' diameter,28 the colour of a suspension of gold nanoparticles changes from red to purple. This colour change is visible to the naked eye. The colour changes associated with nanoparticle aggregation were originally exploited by Mirkin et al., who showed that 13 nm diameter gold nanoparticles stabilised with single stranded DNA could be used to colorimetrically detect the complementary oligonucleotide.29 Recently, the first double stranded DNA-functionalised gold nanoparticles have been reported to investigate duplex to duplex interaction via a colorimetric bioassay.30 Gold nanoparticle-based colorimetric assays have also been reported for the detection of a variety of other species, including metal ions, anions, small organic molecules and proteins.31,32
Combining the specific analyte targeting of carbohydrates with the change of solution colour as a consequence of the aggregation of metal nanoparticles, glyconanoparticles have been extensively used for the development of colorimetric bioassays. This tutorial review will highlight how metal-based glyconanoparticles are constructed and then used for the development of colorimetric bioassays for the detection of lectins, toxins and viruses.
Noble metals used to synthesise the nanoparticle core
One of the key variables that can be tailored in the synthesis of glyconanoparticles is the material used to form the nanoparticle core. Although different types of nanomaterials including CdS/ZnS quantum dots,33–38 upconverting nanoparticles,39 magnetic nanoparticles,40–45 and carbon nanotubes,46 have been used for the synthesis of glyconanoparticles, the intrinsic colour changes associated with the aggregation of noble metal nanoparticles have ensured that these nanoparticles are extensively used for the development of bioassays. Among the noble metals, silver and especially gold are the most commonly used and this review will focus on the use of these metals for the synthesis of glyconanoparticles and their use in the development of colorimetric bioassays.Gold nanoparticles have been functionalised with a thiolated mannose derivative to develop a selective, quantitative and rapid colorimetric detection method for concanavalin A (ConA).47 ConA, a lectin from Canavalia ensiformis, is a carbohydrate binding protein that has been extensively used in the study of protein–carbohydrate interactions using glyconanoparticles. This ‘model’ protein is well known to bind selectively to α-mannosides48 and α-glucosides. The binding of ConA to N-acetylglucosamine has also been reported.49 The glyconanoparticles were synthesised using a two-step procedure that involved citrate-reduced gold nanoparticles and a thiolated carbohydrate ligand.47 In the first step, gold nanoparticles were prepared via the citrate reduction of hydrogen tetrachloroaurate (HAuCl4) following the well-established method reported by Turkevich et al.50,51 This method produces citrate-stabilised gold nanoparticles of an average size of ca. 16 nm diameter at a concentration of ca. 3 nM. In the second step, the citrate-stabilised gold particles were reacted with the previously synthesised thiolated mannopyranoside ligand. During this reaction, the citrate on the surface of the gold particles was replaced by the thiolated ligand, yielding the mannose functionalised glyconanoparticles. The unbound ligand was removed by centrifugation, using centrifugal filter units of the appropriate molecular weight cut-off. The glyconanoparticles were then resuspended in Tris buffer, or in another appropriate buffer, yielding a red suspension. The size of the nanoparticles can be measured by transmission electron microscopy (TEM) or by dynamic light scattering (DLS). The concentration of a dispersion of citrate capped gold nanoparticles can be calculated with the Beer–Lambert law using an extinction coefficient at 520 nm of 2.4 × 10⁸ M−1 cm−1.52 Citrate-capped gold nanoparticles exhibit a surface plasmon absorption band centred at ca. 520 nm (Fig. 2). Upon displacement of the citrate and self-assembly of the thiolated mannopyranoside, the surface plasmon absorption band shows a small red-shift with the maximum centred at ca. 523 nm (Fig. 2a). The shift in the maximum of the UV-vis extinction spectrum indicates a change in the dielectric nature of the metal surface and confirms the functionalisation of the nanoparticles. The purified mannose-functionalised gold nanoparticles reported by Hone et al.47 were resuspended in Tris buffer at pH 7.6. At pH > 7, ConA has four sites that bind to α-D-mannose residues.53 Thus, each ConA molecule could, in principle, bind up to four mannose-functionalised gold nanoparticles via the specific lectin–carbohydrate interaction, although due to geometric constrains each lectin is likely to bind to two, or possibly three, mannose ligands. Furthermore, each nanoparticle is functionalised with numerous mannose ligands thereby enabling binding of each glyconanoparticle to several ConA molecules. Upon addition of increasing concentrations of ConA to a solution of mannose-functionalised gold nanoparticles, a shift to longer wavelengths in the surface plasmon absorption band was observed concomitant with a broadening of the spectrum and an increase in the UV-vis extinction at 620 nm (Fig. 2a). These changes confirmed the aggregation of the glyconanoparticles in a lectin concentration-dependent manner. The aggregation could be observed by the naked eye due to the colour change of the nanoparticle suspension, from deep red to purple (Fig. 2b). Further to the measurement of the UV-vis extinction spectrum, TEM can be employed to visualise the aggregation of the glyconanoparticles in the presence of ConA (Fig. 2b). The designed glyconanoparticles enabled the colorimetric detection of sub-μM (0.192–0.385 μM) concentrations of ConA within 30 s. To establish the specificity of the interaction between mannose-functionalised nanoparticle and the ConA, control experiments using Tetragonolobus purpureas lectin, with affinity for L-fucose, were performed with no changes in the UV-vis extinction spectrum of the nanoparticles observed.47
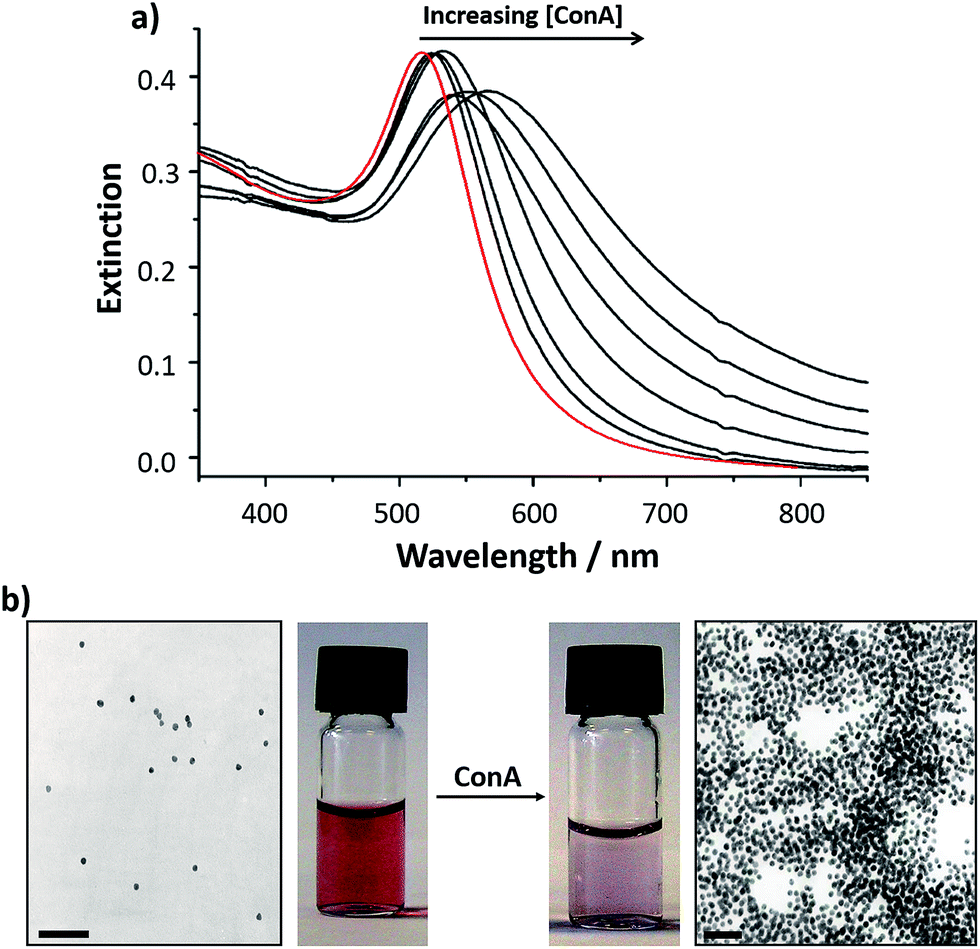 | ||
| Fig. 2 (a) UV-vis extinction spectra of: (red) citrate reduced gold nanoparticles and (black) mannose-functionalised gold nanoparticles 40 min following addition of increasing concentrations of ConA (from 0 to 0.32 μM). (b) Transmission electron micrographs and vials containing samples of mannose-functionalised gold nanoparticles (left) before and (right) 30 min after addition of 0.32 μM Con A. The overall concentration of nanoparticles in the sample remains constant. Scale bars are 100 nm.47 Figure adapted with permission from ref. 47. Copyright (2003) American Chemical Society. | ||
Following a similar approach, a simple and rapid bioassay for the detection of cholera toxin using lactose-functionalised gold nanoparticles has been developed.54 Cholera toxin is produced by Vibrio cholerae, the causative agent of cholera, an acute intestinal disease that is prevalent in developing countries. Cholera toxin is known to bind to the pentasaccharide head group of the GM1 ganglioside in the intestine. The interaction between cholera toxin and the ganglioside can be mimicked using lactose, a disaccharide that terminates with a galactose unit, a component of the GM1 pentasaccharide head group. A lactose derivative containing a thiolated anchor was synthesised and self-assembled onto 16 nm gold nanoparticles. Addition of cholera toxin B subunit (CTB) to the lactose-functionalised gold nanoparticles resulted in aggregation of the particles, accompanied by a red to deep purple colour change due to the changes of the surface plasmon absorption band (Fig. 3). The bioassay was able to detect and quantify the CTB within 10 min. The selectivity of the lactose-stabilised gold nanoparticles towards CTB was investigated by testing the bioassay in the presence of potentially interfering ions and a protein. The sensing system was freeze-dried, reconstituted and then tested with a model clinical sample consisting of electrolytes found in the watery stool that is typical of cholera patients. In the electrolyte medium, the lowest detectable concentration of CTB was found to be 110 nM while the theoretical detection limit for CTB was determined to be 54 nM. The developed bioassay proved to be simple, fast and robust. The method enabled the quantitative detection of CTB and, since it works after freeze-drying, can be easily transported to environments where cholera outbreaks are likely to occur.54
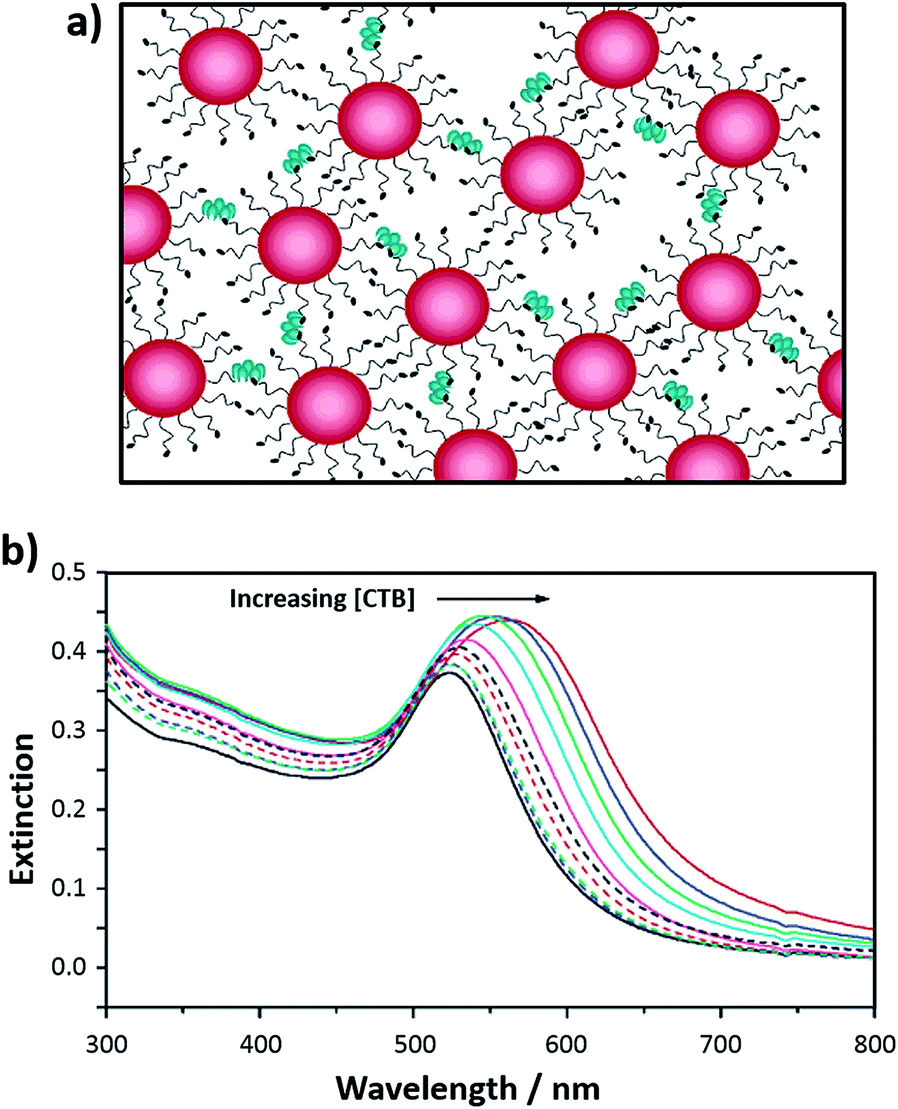 | ||
| Fig. 3 (a) Schematic representation of the aggregation of lactose-functionalised gold nanoparticles in the presence of cholera toxin showing the relative scale of the toxin with respect to the nanoparticles; and (b) UV-visible extinction spectra of lactose-functionalised gold nanoparticles upon addition of CTB at varying concentrations (from 0.22 to 2.20 μM): 0 μM CTB (black solid line) and 2.20 μM CTB (red solid line).54 Figure adapted with permission from ref. 54. Copyright (2007) American Chemical Society. | ||
The optical properties of silver at the nanoscale are also distance-dependent. Silver- and gold-based glyconanoparticles have been compared to establish whether either metal exhibits optimal characteristics for bioassay development.55 Mannose-functionalised silver nanoparticles were synthesised in two steps: a silver salt was reduced using sodium borohydride yielding a vivid yellow coloured suspension of silver nanoparticles, which were then mixed with a thiolated mannose derivative ligand for 48 h to self-assemble the ligand on the surface of the nanoparticles. The excess mannose ligand was removed by dialysis and the final suspension of mannose-functionalised silver nanoparticles was kept in Tris buffer (10 mM, pH 7.6). These mannose-functionalised silver nanoparticles of ca. 16 nm diameter were a vivid yellow colour, as shown in Fig. 4a. Red suspensions of mannose- or lactose-functionalised gold nanoparticles were synthesised as described for the gold nanoparticles stabilised with the thiolated lactose-derivative ligand54 (Fig. 4b for lactose-functionalised gold nanoparticles). The synthesised silver nanoparticles exhibited an intense surface plasmon absorption band at 395 nm that shifted to 401 nm upon addition of the thiolated mannose ligand. Similarly, the characteristic surface plasmon absorption band of the gold nanoparticles red-shifted from 520 to 523 nm upon functionalisation. Aggregation of either silver or gold nanoparticles functionalised with the mannose ligand was observed upon addition of Con A resulting in a shift in the surface plasmon absorption band and a consequent colour change of the solution. When comparing the mannose-functionalised silver nanoparticles with the mannose-functionalised gold nanoparticles, the former provided an assay for Con A with the largest linear range (between 0.08 and 0.26 μM), and a greater kinetic rate of aggregation. However, in terms of sensitivity, the mannose-functionalised gold-nanoparticle-based assay was optimum. To examine the specificity of the bioassay, the prepared lactose-functionalised gold nanoparticles were mixed with a solution of mannose-functionalised silver nanoparticles (Fig. 4c) to give an aggregation assay capable of detecting two different lectins, Con A or the galactose specific Ricinus communis agglutinin 120 (RCA120). When either lectin was added to the mixed glyconanoparticles, selective recognition of the respective natural ligand was shown by aggregation of a single metal nanoparticle. Centrifugation and removal of the aggregated species enabled further bioassay measurements using the second glyconanoparticle system.55
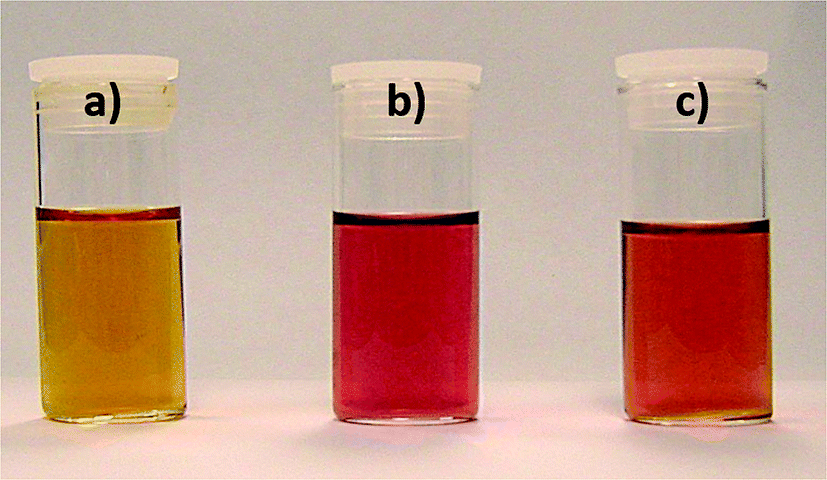 | ||
Fig. 4 (a) Mannose-functionalised silver nanoparticles (3 nM, ca. 16 nm in diameter); (b) lactose-functionalised gold nanoparticles (3 nM, ca. 16 nm in diameter); and (c) a 50![[thin space (1/6-em)]](https://www.rsc.org/images/entities/char_2009.gif) :50 mixture of mannose-silver and lactose-gold nanoparticles.55 Figure reproduced with permission from ref. 55. Copyright (2006) American Chemical Society. :50 mixture of mannose-silver and lactose-gold nanoparticles.55 Figure reproduced with permission from ref. 55. Copyright (2006) American Chemical Society. | ||
While the comparative study showed that silver glyconanoparticles could be readily used for colorimetric bioassays, and indeed some other examples of silver glyconanoparticles can be found in the literature,56–58 the vast majority of the reported colorimetric bioassays have been developed using gold nanoparticles. The preference towards gold is likely due to the high stability and the biocompatibility of such gold nanomaterials. Consequently, the remainder of this tutorial review will focus on colorimetric bioassays developed using gold nanoparticles.
The importance of the nanoparticle size for the development of colorimetric assays has been studied using a model system for the detection of Ni(II) ions.59 Although the results suggest that the use of 45 nm nanoparticles provides the optimal performance of the system, the majority of the reported glyconanoparticle-based assays use 8–20 nm diameter nanoparticles. The influence of the particle size for the development of colorimetric bioassays has been also studied by Niikura et al.60 Gold nanoparticles of 5, 10 and 15 nm diameter were functionalised with a thiolated sialic acid derivative for the colorimetic detection of John Cunningham (JC) virus. The authors were able to optically detect the virus only when using the 15 nm sized glyconanoparticles in the presence of dextran within the solution.60
Assembly of the nanoparticles
The synthesis of glyconanoparticles for colorimetric bioassays can be achieved following two different strategies. The first strategy is to synthesise a carbohydrate ligand which is then self-assembled onto previously-synthesised gold nanoparticles. This strategy was used for the synthesis of the mannose and lactose gold nanoparticles described above. One of the major advantages of this strategy is that the synthesised carbohydrate ligand can be fully characterised prior to assembly onto the gold nanoparticle surface. The second strategy uses pre-synthesised gold nanoparticles that are functionalised with a non-glyco-ligand. The particles are then reacted with a carbohydrate to yield the glyconanoparticle of interest. Examples of both strategies utilised for the synthesis of glyconanoparticles are given below.The first strategy typically involves the self-assembly of thiol-derivatised carbohydrates. However, the self-assembly of carbohydrates to the gold surface using thioctic acid and its influence on protein binding has been also investigated.61 Thioctic acid derivatives possess two sulfur atoms thereby providing two points of attachment to the surface of the gold particles. Four ligands were individually synthesised, α-D-mannopyranoside and α-1,3-D-mannopyranosyl(α-1,6-D-mannopyranosyl)-α-D-mannopyranoside-based thiols (1a and 2a, see Fig. 5) and the corresponding thioctic amides (1b and 2b, see Fig. 5). The synthesised ligands were attached to the surface of gold nanoparticles (ca. 17 nm). It was observed that the thioctic-amide systems (Fig. 5, 1b and 2b) gave a greater response toward ConA than that of the mannoside- and trimannoside-thiols (Fig. 5, 1a and 2a, respectively). Further, it was observed that the thioctic-amides did not show non-specific aggregation when they were in contact with other proteins such as Tetragonolobus purpureas lectin, RCA120, fibrinogen and cytochrome c.61
 | ||
| Fig. 5 Structure of the α-D-mannopyranoside and α-1,3-D-mannopyranosyl(α-1,6-D-mannopyranosyl)-α-D-mannopyranoside-based thiols (1a and 2a) and the corresponding thioctic-amides (1b and 2b).61 Figure reproduced from ref. 61. | ||
Ricinus communis (ricin: RCA60) is a toxic lectin that is considered to be a bioterrorism threat.62 The mechanism of toxicity of ricin involves the binding of its two carbohydrate-binding sites to the β-D-galactopyranose (β-Gal) or β-D-N-acetylgalactosamine (β-GalNAc) residues on the surface of the host cell. Based on this mode of action, Uzawa et al. developed a facile and sensitive colorimetric bioassay for RCA60 using gold nanoparticles functionalised with a thiolated β-lactosyl ceramide ligand.63 Upon addition of either the RCA60 toxin or the surrogate agglutinin RCA120 to a solution of the glyconanoparticles, a change of colour from red to purple was observed by the naked eye. This colour change was not observed in the presence of other plant lectins, including those from jack bean, soybean, peanut, Osage orange trees, Amur maackia trees and clary sage. Additionally, no colour change was observed in the presence of non-carbohydrate binding proteins, such as bovine serum albumin and γ-globulin. The aggregation of the glyconanoparticles in the presence of RCA60 could be reversed by addition of an excess of lactose. RCA60 could be distinguished from RCA120 using β-D-galactosyl ceramide functionalised gold nanoparticles, since RCA60 does not react with these glyconanoparticles while RCA120 induces their aggregation. The developed bioassay could detect RCA60 in concentrations of less than 3.3 μg mL−1 in 10 min or 1.7 μg mL−1 in 30 min.63
In the examples described above the carbohydrate ligands are attached to the gold nanoparticles via a thiol or thioctic acid moiety. Carbohydrate ligands have also been attached to gold particle surfaces via atoms other than sulfur. For example, monosaccharide modified peptides containing an amino group have been bound to the gold surface yielding glyconanoparticles as optical probes for lectin detection.64 While Ding et al. have based the stabilisation of their mannan-functionalised gold nanoparticles on the interaction between the gold surface and the hydroxyl groups on the carbohydrate.65
The second strategy for the assembly of glyconanoparticles avoids the synthesis of the required thiolated carbohydrate ligands. For example, Wang et al. functionalised citrate stabilised gold nanoparticles (ca. 20 nm) with perfluorophenylazide disulfide, the nitrene species of which were photochemically activated to couple the carbohydrates of interest.66,67 This method was used to synthesise monosaccharide- and disaccharide-functionalised gold nanoparticles. Aggregation studies in the presence of ConA were performed to investigate whether the recognition ability of the carbohydrates changes upon coupling.66
The coupling of carbohydrates using microwave radiation is another alternative for the functionalisation of gold nanoparticles.68 In this example, gold nanoparticles were first functionalised with di(N-succinimidyl)3,3′-dithiodipropionate and then reacted with 2-mercaptoethylamine hydrochloride via succinimidyl-amino covalent binding. This reaction step left free sulfhydryl groups on the surface of the nanoparticles that reacted with the maleimide on N-(β-maleimidopropionic acid) hydrazine. In a final step, the carbohydrate of interest was conjugated to the hydrazine-functionalised nanoparticles using microwave heating (15 min, 600 W). During the microwave heating a hydrazone is formed between the amine group of the hydrazine and the carbonyl group at the reducing end of the carbohydrate of interest. This synthetic procedure yielded glyconanoparticles with a low extinction intensity as compared to the initial citrate stabilised gold nanoparticles (an intensity decrease from ca. 1.1 to 0.25). Maltose-, mannose-, glucose-, lactose- and D-mannopentaose-functionalised gold nanoparticles were synthesised using this method and their interaction with ConA was investigated.68
1-Deoxy-1-thio-β-D-glucose sodium salt was used as the reducing and stabilising agent in the synthesis of gold nanoparticles of different sizes.69 The thioglucoses functionalising the gold surface were found to be partially oxidised, forming carboxyl groups that were then activated via N-hydroxysuccinimide (NHS)/N-3-(dimethylaminopropyl)-N′-ethylcarbodiimide (EDC) to covalently couple p-aminophenyl α-D-mannoside. The synthesised glyconanoparticles were able to colorimetrically detect ConA rather than peanut agglutinin which binds specifically to the carbohydrate sequence galactose-β-1,3-N-acetylgalactosamine (Gal-β-1,3-GalNAc).69
Otsuka et al. reported the synthesis of glyconanoparticles for the sensing of RCA120 using a two-step protocol.70 First, HAuCl4 was reduced with sodium borohydride in the presence of an acetal–PEG–SH ligand (PEG–Au molar ratio = 1/6:1). Subsequently, the acetal group was converted into an aldehyde group which was then reacted with p-aminophenyl-β-D-lactopyranoside and/or p-aminophenyl-α-D-mannopyranoside yielding the corresponding glyconanoparticles (ca. 8.9 nm).70 The presence of RCA120 induced the aggregation of the glyconanoparticles and thus, a colour change of the dispersion. The aggregation of the nanoparticles in the presence of RCA120 was reversible upon addition of D-galactose. The influence of the dilution of the lactose coverage on the nanoparticle surface for the lectin detection was also reported.70 The optimisation of the density of the carbohydrate ligand on the glyconanoparticle surface is an important parameter and will be considered in more detail below.
The carbohydrates for each specific target
When designing a glyconanoparticle system for a colorimetric bioassay, the carbohydrate itself is obviously of central importance. Most naturally occurring protein–carbohydrate and carbohydrate–carbohydrate interactions are relatively weak.71 The way Nature overcomes these weak interactions is through multivalent binding, where several carbohydrates are involved in the interaction.72 Glyconanoparticles mimic this multivalent binding since a large number of the carbohydrate ligands are present on each particle.In a recent study, Marín et al. have demonstrated that a thiolated trivalent sialic acid derivative (Fig. 6a) is far superior than the monovalent sialic acid derivative (Fig. 6b) for the colorimetric detection of a human influenza virus.73 Haemagglutinin (HA) is one of two major glycoproteins found on the surface of influenza viruses. HA recognises and binds to the sialic acid present on the surface of a host cell, thereby enabling infection of the cell.74 Since viral HA is trivalent in nature,75 it was considered that the trivalent sialic acid derivative would better mimic the surface of a host cell. The binding affinity of the synthesised trivalent sialic acid functionalised nanoparticles toward the human influenza virus X31 (H3N2) was compared to that of gold nanoparticles functionalised with a monovalent sialic acid derivative. The changes in the surface plasmon absorption band of both types of glyconanoparticles were monitored upon addition of increasing concentrations of the human influenza virus X31. For the gold nanoparticles functionalised with the trivalent ligand, a red-shift in the surface plasmon absorption band with the associated colour change from an initial deep red to a lighter red was observed 30 min after addition of the virus. These changes in the properties of the glyconanoparticles indicate the aggregation of the nanoparticles around the virus particle (Fig. 6c). As shown in Fig. 6d, the intensity of the surface plasmon absorption band at 525 nm of the trivalent ligand functionalised gold nanoparticles decreased from ca. 0.75 to 0.17 when a concentration of 3 μg mL−1 of human influenza virus X31 was added to the sample. However, the extinction intensity at 525 nm for the nanoparticles functionalised with the monovalent ligand, under the same conditions, only decreased from ca. 0.75 to 0.56. These results highlight that the trivalent sialic acid ligand binds to the human influenza virus with greater affinity than the monovalent ligand. It is clear that knowledge regarding the specific interactions between the protein and carbohydrate is essential for the optimal design of the glyconanoparticles for sensitive colorimetric bioassays.
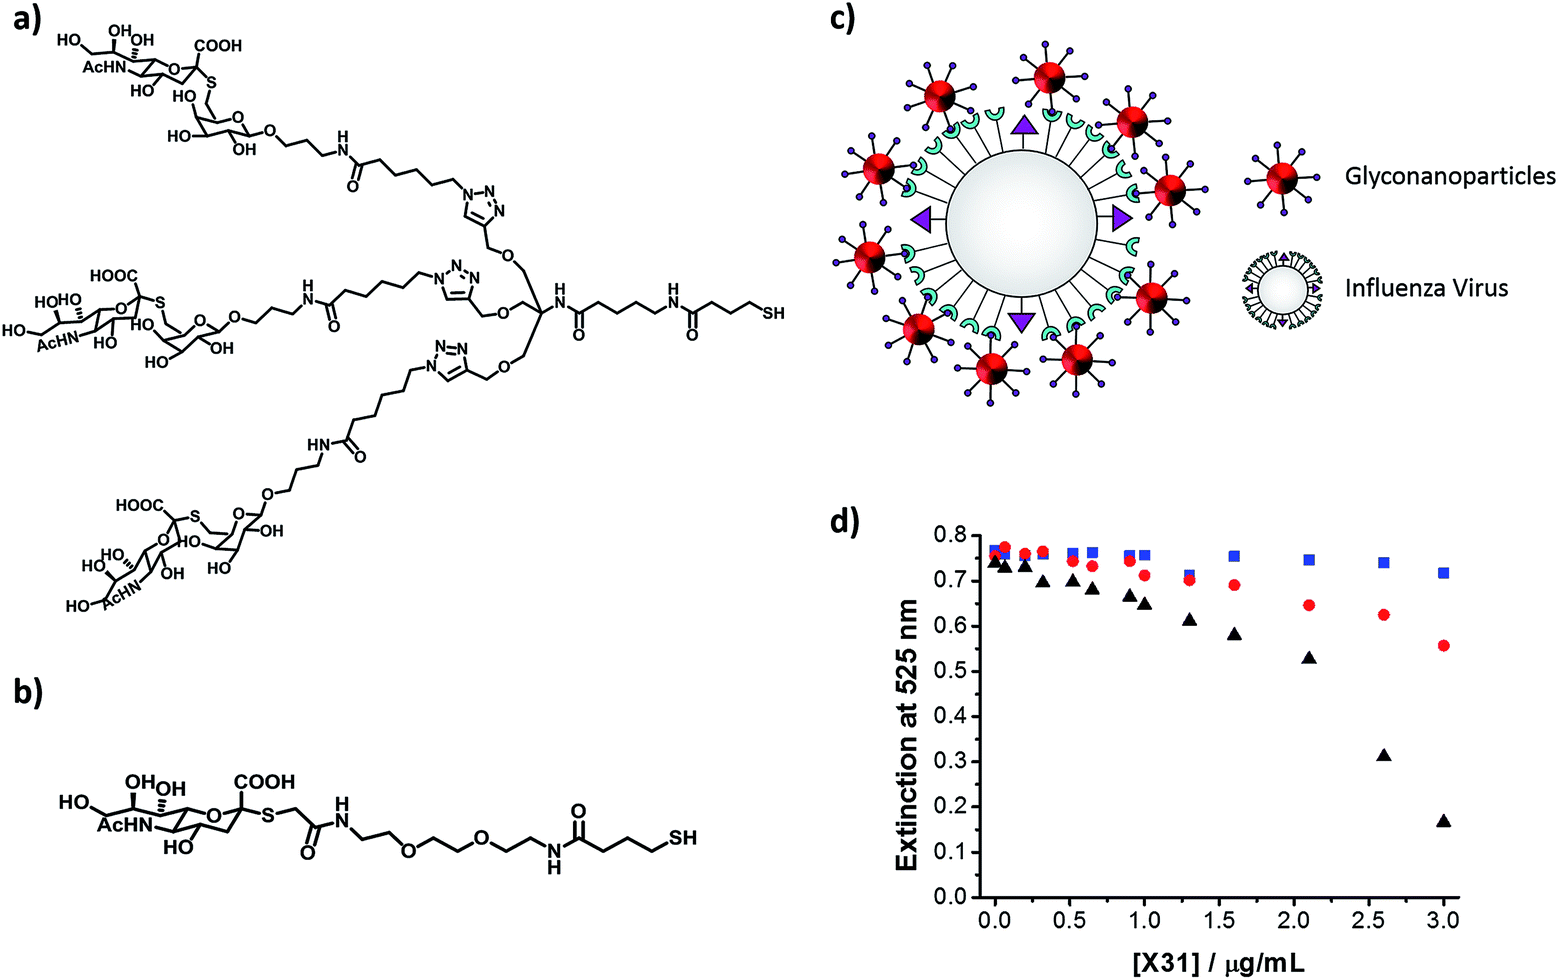 | ||
| Fig. 6 (a) Chemical structure of the thiolated trivalent sialic acid derivative ligand; (b) chemical structure of the thiolated monovalent sialic acid derivative ligand; (c) schematic representation of the aggregation of trivalent sialic acid functionalised gold nanoparticles in the presence of influenza virus; the ligand on the surface of the gold nanoparticles binds to the haemagglutinin on the surface of the virus inducing aggregation; and (d) changes in the extinction intensity at 525 nm of gold nanoparticles functionalised with a trivalent sialic acid derivative ligand (black), a monovalent sialic acid derivative ligand (red) and a polyethylene glycol derivative ligand (blue) in the presence of increasing concentrations of human influenza virus X31 (H3N2) (from 0 to 3.0 μg mL−1).73 Figure adapted from ref. 73. | ||
Length of the anchor chain that tethers the carbohydrate to the nanoparticle core
The chain length of the anchor that attaches the carbohydrate to the nanoparticle surface has an influence on the stability and the sensitivity of the glyconanoparticles. Ligands with a longer alkyl anchor chain give a more stable monolayer whereas a shorter chain length gives better sensitivity for the aggregation assays.As previously discussed, the relationship between the interparticle distance and the changes in the optical properties of DNA-modified gold nanoparticles were initially studied by Mirkin and co-workers.52 The authors showed that the changes in the optical properties were dependent on the interparticle distance and on the number of particles that form the aggregate, both properties dependent upon the spacer length of the oligonucleotide. In the field of colorimetric bioassays using glyconanoparticles, the aggregation of a variety of lactose-functionalised nanoparticles in the presence of calcium ions was shown to be dependent on the anchor chain length of the carbohydrate ligand.76 Calcium is a divalent cation in solution that is known to be essential for carbohydrate–carbohydrate binding.77 Calcium is able to chelate to lactose, a disaccharide consisting of D-glucose and D-galactose, via the oxygen atoms of the HO(2)–HO(3) pair of hydroxyl groups of the glucose in one lactose moiety and those of the HO(3)–HO(4) of the galactose unit of a second lactose unit. Based on these calcium ion-mediated carbohydrate–carbohydrate interactions, gold nanoparticles (ca. 16 nm) were individually functionalised with four different lactose derivatives of varying length of anchor chain (Fig. 7a). Addition of calcium ions to these glyconanoparticles induced aggregation. The sensitivity and linear dynamic range of the lactose-stabilised gold nanoparticles were found to be dependent on the length of the anchor chain (Fig. 7b). The shorter the anchor chain, the more sensitive the assay, with the shortest chain giving the lowest limit of detection at 0.8 mM calcium.76
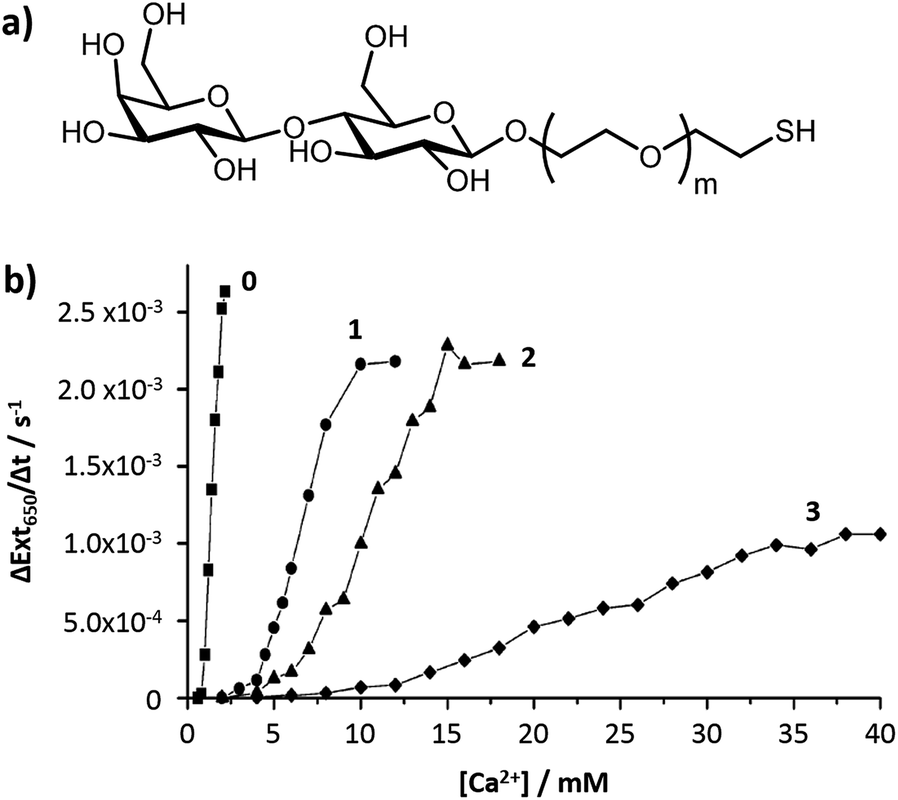 | ||
| Fig. 7 (a) Structure of the lactose derivative ligands used for the functionalisation of the gold nanoparticles; and (b) effect of ethylene oxide anchor chain length (m = 0, 1, 2 and 3) on the sensitivity of calcium-mediated particle aggregation.76 Figure adapted with permission from ref. 76. Copyright (2006) American Chemical Society. | ||
The effect of the anchor chain length for the design of optimally presented glyconanoparticles for the colorimetric detection of RCA120 and ConA has also been examined.78 Gold nanoparticles (ca. 16 nm) were functionalised with either a long-(ca. 15 Å) or a short-(ca. 6.2 Å) chain galactose thiolated ligand (Fig. 8). Addition of RCA120 induced the aggregation of the glyconanoparticles which was observed by a visual colour change and a red-shift in the surface plasmon absorption band. The nanoparticles functionalised with the short-anchor chain ligand provided superior aggregation upon addition of RCA120, displaying a lower detection limit, a greater change in extinction intensity and a larger linear dynamic range. However, the longer-anchor chain ligand provided a more stable sensing system.
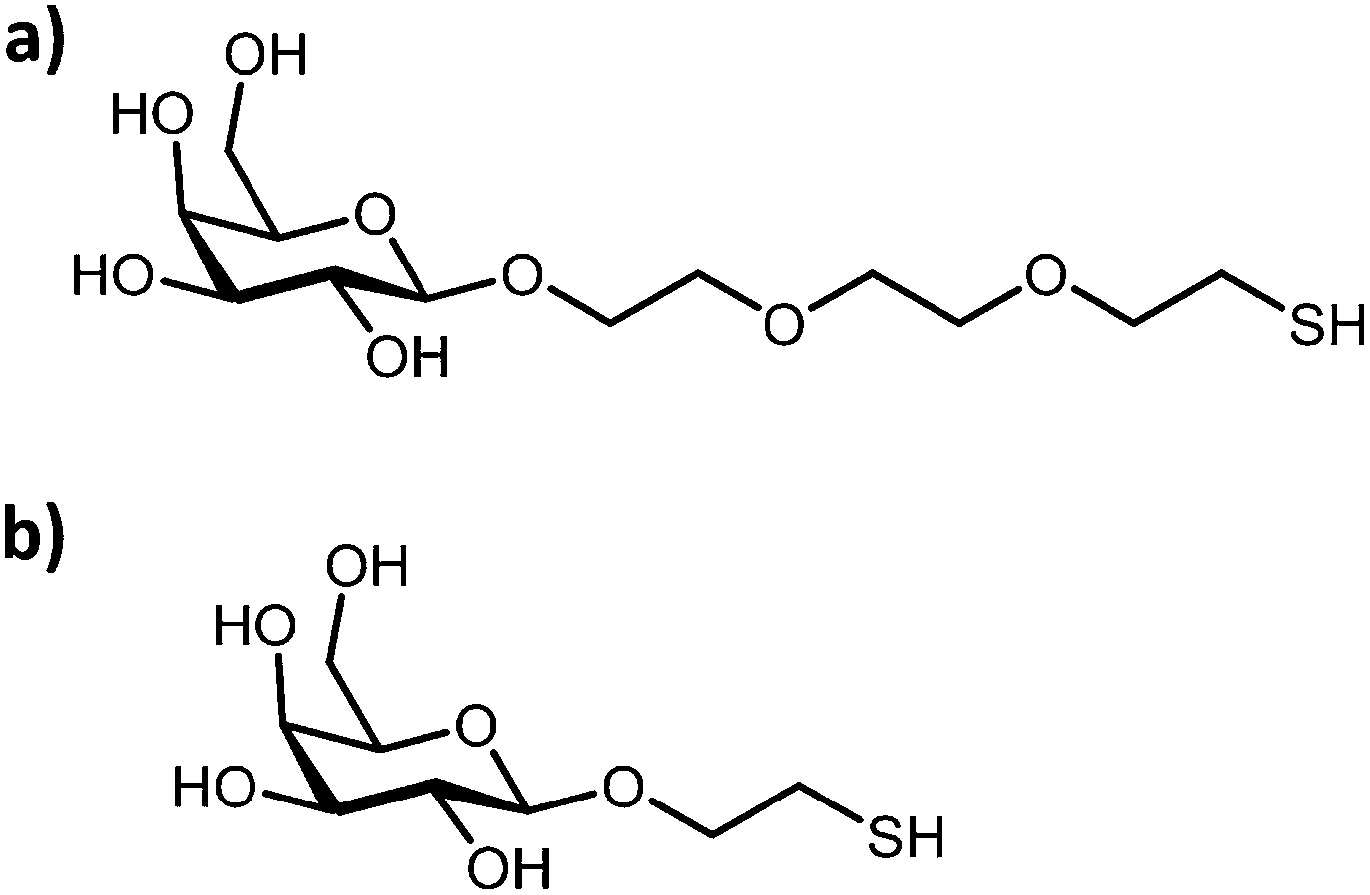 | ||
| Fig. 8 Chemical structure of the (a) long- and (b) short-anchor chain galactose thiolated derivative ligand.78 Figure reproduced from ref. 78. | ||
Shiga-like toxins belong to the same family of AB5 toxins as the cholera toxin.79,80 Shiga-like toxin is produced by the Escherichia coli bacterium. The B-subunit of the toxin produced by E. coli strain O157:H7 specifically recognises the globotriose (Pk) blood group antigen, which contains the trisaccharide αGal(1 → 4)βGal(1 → 4)βGlc. Each of the five B-subunits has three binding sites for Pk. Chien et al. have prepared two derivatives of Pk with different chain lengths and self-assembled these onto gold nanoparticles of differing sizes (4, 13 and 20 nm).81 These glyconanoparticles were used to assess the binding affinity towards the shiga-like toxin with the view to develop a surface plasmon resonance competition assay. The results obtained show that a longer chain length enhances the binding affinity of the Pk moiety. A longer chain length allows for greater flexibility making it easier for the Pk ligand to bind to the maximum number of binding sites on the toxin. The Pk-derivatised gold nanoparticles of larger diameter were found to give a greater binding affinity. This result was thought to be due to the lower curvature of the nanoparticles resulting in improved interaction between the Pk ligand and binding sites on the toxin. Based on these results, a chip-based assay was developed incorporating the glyconanoparticles.81
Wang et al. found that the sensitivity of mannose-functionalised nanoparticles towards ConA increased with the spacer length.82 The authors prepared the glyconanoparticles using a photocoupling method, as previously described in this review,66 and obtained ca. 22 nm diameter gold nanoparticles functionalised with a mannose derivative of varying spacer lengths (ca. 46 Å, 27 Å, 19 Å and 13 Å). Changes of the surface plasmon absorption band of the glyconanoparticles were observed upon addition of the ConA. The limit of detection of each type of glyconanoparticle was calculated monitoring the change in the extinction at 650 nm as a function of the concentration of ConA. The gold nanoparticles functionalised with the longer and more flexible spacer linkage exhibited the lowest limit of detection.82 While these results appear to contradict previous work,52,76,78 it is possible that the flexibility of the anchor chain is an additional important feature for the targeting and sensitive detection of proteins with glyconanoparticles.
Carbohydrate density on the nanoparticle surface
The aggregation of glyconanoparticles, following molecular recognition, is induced by multivalent interactions between the analyte and the carbohydrates.83,84 Carbohydrate ligand density on the nanoparticle surface is an important factor for these multivalent interactions19 and therefore, for colorimetric aggregation bioassays. Optimal presentation of the carbohydrate for efficient binding to the target may require spacer molecules between the ligands on the nanoparticle surface. By introducing a spacer molecule, the carbohydrate density on the nanoparticle can be modified for optimal target recognition and binding.The effect of ligand density on the aggregation of gold glyconanoparticles has been studied by Kataoka and co-workers.70,85 These authors synthesised gold nanoparticles stabilised with a mixed monolayer containing lactose–PEG–SH and acetal–PEG–SH ligands. The surface coverage of the glyconanoparticles with lactose was 0%, 20%, 40% and 65%. To obtain these lactose coverage ratios, mixtures of lactose–PEG–SH and acetal–PEG–SH ligands with the corresponding molar ratios were added to a solution of commercially available gold nanoparticles (ca. 20 nm diameter). The behaviour of the different glyconanoparticles in the presence of RCA120 lectin was investigated. Stable interparticle bridges were formed by the glyconanoparticles containing 40% and 65% lactose in the presence of RCA120 which produced the aggregation of the glyconanoparticles and thus a colour change. The optimal aggregation was observed for a 65% surface coverage. Glyconanoparticles functionalised with 20% lactose did not undergo aggregation in the presence of RCA120, indicating the existence of a critical lactose density between 20% and 40% for the formation of aggregates.85 These results were confirmed by the work of Bergen et al. where galactose-functionalised nanoparticles were aggregated in the presence of RCA120.86 Commercially available gold nanoparticles were functionalised with different galactose ligand densities (25%, 50%, 60%, 75% and 100%). Aggregation of the nanoparticles was observed by measuring the extinction spectrum upon addition of RCA120. The optimal aggregation occurred at 75% galactose coverage and no aggregation was observed with a coverage of 25%.86
The effect of carbohydrate density on the design of glyconanoparticles for the colorimetric detection of RCA120 and ConA has also been investigated.78 Gold nanoparticles were functionalised with a thiolated mannose derivative and a thiolated triethylene glycol in varying ratios. The changes in the extinction spectrum were measured following addition of increasing concentrations of ConA. Glyconanoparticles with a 100% coverage of the mannose derivative gave the optimal aggregation in the presence of ConA. Gold nanoparticles were also functionalised with differing ratios of a thiolated galactose derivative (Fig. 8a) and the thiolated triethylene glycol to investigate the effect of carbohydrate density on RCA120 induced aggregation. Monitoring the changes in the extinction intensity at 620 nm, a surface coverage of 70% was found to be the optimal galactose density for the detection of RCA120. The limit of detection for RCA120 using the optimal glyconanoparticles was found to be 9 nM. The minimum galactose coverage required for aggregation of the galactose stabilised nanoparticles was 5–7.5%.78 This study highlights that different ligand densities are required for each bioassay in order to obtain the optimal aggregation of the glyconanoparticles.
Carbohydrate/spacer ligand ratios have been investigated to establish the optimal carbohydrate dilution for the rapid colorimetric detection and discrimination between human and avian influenza virus based on glyconanoparticles.73 Gold nanoparticles (ca. 16 nm) were functionalised with a trivalent α2,6-thio-linked sialic acid ligand and a thiolated polyethylene glycol (PEG) derivative. As described earlier, the trivalent ligand on the glyconanoparticles binds to the haemagglutinin on the surface of the virus inducing the aggregation of the nanoparticles (Fig. 6c) and, consequently, a visible colour change in solution. Marín et al. studied varying ratios of the trivalent α2,6-thio-linked sialic acid ligand and a thiolated polyethylene glycol derivative ligand. A ratio of 1:3 was found to be optimum for the colorimetric detection of the human influenza virus X31 (H3N2) within 30 min. The optimised glyconanoparticles were used to detect the virus from clinical samples of unknown concentration and purity. Changes in the surface plasmon absorption band of the glyconanoparticles upon addition of increasing volumes of X31 influenza virus from allantoic fluid (AF) led to changes in the solution colour from deep red to colourless, see Fig. 9a.
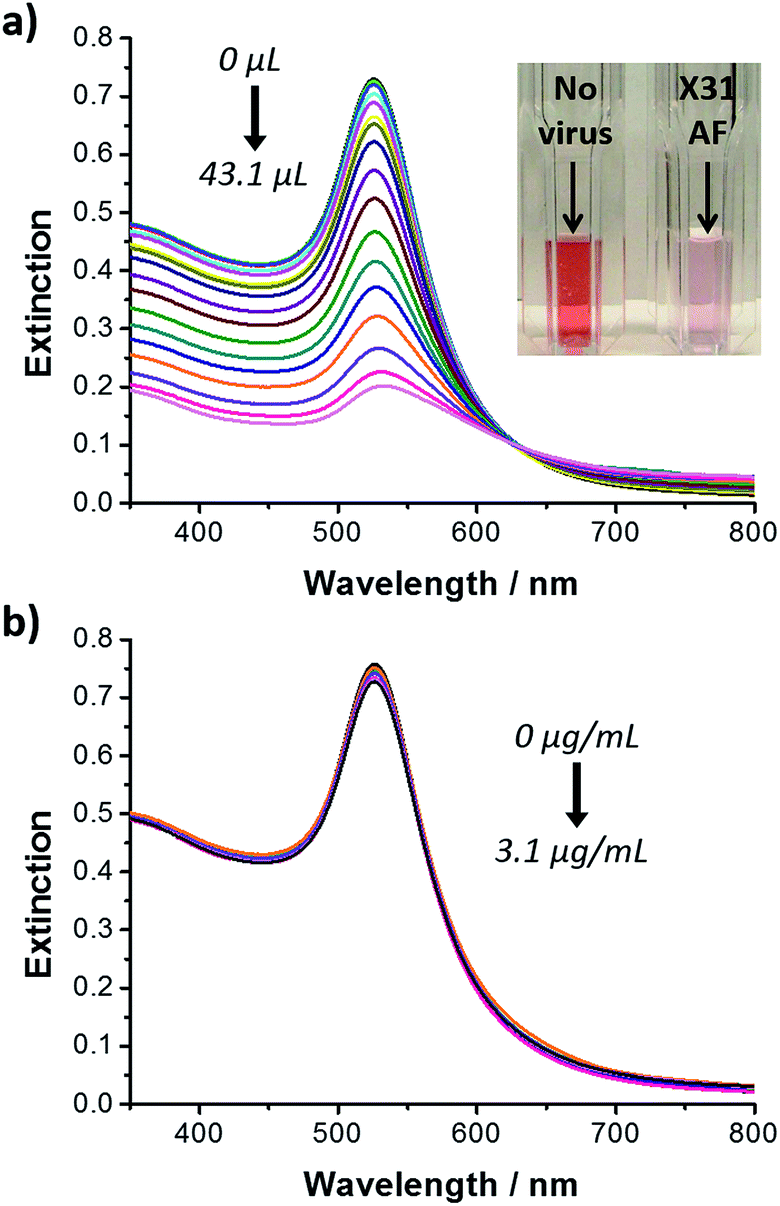 | ||
| Fig. 9 UV-visible extinction spectra of: (a) trivalent ligand–PEG (1:3) functionalised gold nanoparticles following addition of increasing volumes of influenza AF X31 (H3N2) (from 0 to 43.1 μL), inset: cuvettes containing trivalent ligand–PEG (1:3) functionalised gold nanoparticles before (left) and following (right) addition of AF X31 (43.1 μL); and (b) trivalent ligand–PEG (1:3) functionalised gold nanoparticles following addition of increasing concentrations of avian virus RG14 (H5N1) (from 0 to 3.1 μg mL−1).73 Figure adapted from ref. 73. | ||
An important feature of the ligand reported by Marín et al. was the α2,6 configuration of the trivalent sialic acid (see Fig. 6a).73 While human influenza virus binds preferentially to the trivalent sialic acid in the α2,6 configuration, avian influenza virus binds preferentially to the trivalent sialic acid in a α2,3 configuration.87 Based on the sialic acid configuration preference of the HA of the influenza virus, the authors were able to discriminate between human and avian influenza virus. Increasing concentrations of the avian influenza virus RG14 (H5N1) were added to a sample of the trivalent sialic acid functionalised gold nanoparticles and no changes were observed in the extinction spectrum of the glyconanoparticles (Fig. 9b). Using the trivalent α2,6-thio-linked sialic acid functionalised glyconanoparticles, Marín et al. have developed an innovative bioassay for the detection and discrimination between human and avian influenza virus with results obtained within 30 min.73
Conclusions
It is apparent that the combination of carbohydrates with noble metal nanoparticles for the synthesis of glyconanoparticles and their application for the bioanalytical detection of lectins, toxins and viruses has seen significant developments over the past 12–13 years. In this tutorial review we have highlighted the key components that are used to construct a metal-based glyconanoparticle for the development of colorimetric based bioassays.The nanoparticle core is typically gold, although the use of silver nanoparticles has been reported. The predominance of gold for the core of glyconanoparticles is undoubtedly due to the high stability and biocompatibility of such nanoparticles. The assembly of the carbohydrate ligand that surrounds the silver or gold metal particle is the next consideration. Typically the carbohydrate ligand is self-assembled to the metal nanoparticle via a thiol moiety, although alternative strategies such as thioctic acid based ligands have been also reported. The carbohydrate used as the molecular recognition element is of central importance. The carbohydrate is chosen to specifically bind to the target bacterial toxin or virus for example. Glyconanoparticles are typically synthesised with a large number of carbohydrate molecules on the surface of each particle to mimic the multivalent binding observed in Nature that overcomes weak carbohydrate interactions. Not only do carbohydrates provide molecular specificity but recently it has been shown that selectivity can be achieved through differences of configuration of the carbohydrate ligand, with a α2,6 configured trivalent sialic acid binding to a human influenza virus and not an avian variant.73 The analytical sensitivity of the bioassay can be modified by varying the length of the chain that anchors the carbohydrate ligand to the gold surface. While the specificity of the glyconanoparticle bioassay can be modified by varying the density of the carbohydrate ligands on the metal nanoparticle.
Through variation of the structure of the glyconanoparticle, the analytical performance of each glyconanoparticle based bioassay can be controlled. Since protein–carbohydrate and carbohydrate–carbohydrate interactions are ubiquitous throughout Nature, it is clear that a huge diversity of potential applications exist for the plasmonic-based detection of toxins, bacteria and viruses using glyconanoparticles.
Acknowledgements
The authors are grateful for the financial support of the School of Chemistry, University of East Anglia, for MJM and, previously, to the EPSRC (Grant GR/S64134/01) for CLS. Studies at the John Innes Centre are supported by the BBSRC Institute Strategic Programme Grant on Understanding and Exploiting Metabolism (MET) [BB/J004561/1], the John Innes Foundation.References
- A. Varki, R. D. Cummings, J. D. Esko, H. H. Freeze, P. Stanley, C. R. Bertozzi, G. W. Hart and M. E. Etzler, Essentials of Glycobiology, Cold Spring Harbor, New York, 2nd edn, 2009 Search PubMed.
- A. Varki, Glycobiology, 1993, 3, 97–130 CrossRef CAS.
- Y. C. Lee and R. T. Lee, Acc. Chem. Res., 1995, 28, 321–327 CrossRef CAS.
- P. Santacroce and A. Basu, Glycoconjugate J., 2004, 21, 89–95 CrossRef CAS.
- N. Sharon, Biochim. Biophys. Acta, Gen. Subj., 2006, 1760, 527–537 CrossRef CAS PubMed.
- B. E. Collins and J. C. Paulson, Curr. Opin. Chem. Biol., 2004, 8, 617–625 CrossRef CAS PubMed.
- A. E. Smith and A. Helenius, Science, 2004, 304, 237–242 CrossRef CAS PubMed.
- P. Emsley, C. Fotinou, I. Black, N. F. Fairweather, I. G. Charles, C. Watts, E. Hewitt and N. W. Isaacs, J. Biol. Chem., 2000, 275, 8889–8894 CrossRef CAS PubMed.
- A. A. Lindberg, J. E. Brown, N. Strömberg, M. Westling-Ryd, J. E. Schultz and K. A. Karlsson, J. Biol. Chem., 1987, 262, 1779–1785 CAS.
- L. L. Kiessling and R. A. Splain, Annu. Rev. Biochem., 2010, 79, 619–653 CrossRef CAS PubMed.
- J. E. Turnbull and R. A. Field, Nat. Chem. Biol., 2007, 3, 74–77 CrossRef CAS PubMed.
- T. Feizi, F. Fazio, W. Chai and C.-H. Wong, Curr. Opin. Struct. Biol., 2003, 13, 637–645 CrossRef CAS PubMed.
- D. Wang, Proteomics, 2003, 3, 2167–2175 CrossRef CAS PubMed.
- N. V. Bovin and H. J. Gabius, Chem. Soc. Rev., 1995, 24, 413–421 RSC.
- A. J. Varma, J. F. Kennedy and P. Galgali, Carbohydr. Polym., 2004, 56, 429–445 CrossRef CAS PubMed.
- M. D. Disney, J. Zheng, T. M. Swager and P. H. Seeberger, J. Am. Chem. Soc., 2004, 126, 13343–13346 CrossRef CAS PubMed.
- T. L. Kelly, M. C. W. Lam and M. O. Wolf, Bioconjugate Chem., 2006, 17, 575–578 CrossRef CAS PubMed.
- N. C. Reichardt, M. Martín-Lomas and S. Penadés, Chem. Soc. Rev., 2013, 42, 4358–4376 RSC.
- M. Marradi, F. Chiodo, I. García and S. Penadés, Chem. Soc. Rev., 2013, 42, 4728–4745 RSC.
- A. Bernardi, J. Jiménez-Barbero, A. Casnati, C. De Castro, T. Darbre, F. Fieschi, J. Finne, H. Funken, K.-E. Jaeger, M. Lahmann, T. K. Lindhorst, M. Marradi, P. Messner, A. Molinaro, P. V. Murphy, C. Nativi, S. Oscarson, S. Penadés, F. Peri, R. J. Pieters, O. Renaudet, J.-L. Reymond, B. Richichi, J. Rojo, F. Sansone, C. Schäffer, W. B. Turnbull, T. Velasco-Torrijos, S. Vidal, S. Vincent, T. Wennekes, H. Zuilhof and A. Imberty, Chem. Soc. Rev., 2013, 42, 4709–4727 RSC.
- A. K. Adak, H.-J. Lin and C.-C. Lin, Org. Biomol. Chem., 2014, 12, 5563–5573 CAS.
- K. Kobayashi, J. Wei, R. Iida, K. Ijiro and K. Niikura, Polym. J., 2014, 46, 460–468 CrossRef CAS.
- K. Larsen, M. B. Thygesen, F. Guillaumie, W. G. T. Willats and K. J. Jensen, Carbohydr. Res., 2006, 341, 1209–1234 CrossRef CAS PubMed.
- L. M. Liz-Marzán, Langmuir, 2006, 22, 32–41 CrossRef PubMed.
- Y. Sun and Y. Xia, Analyst, 2003, 128, 686–691 RSC.
- J. J. Mock, D. R. Smith and S. Schultz, Nano Lett., 2003, 3, 485–491 CrossRef CAS.
- J. P. Kottmann, O. J. F. Martin, D. R. Smith and S. Schultz, Chem. Phys. Lett., 2001, 341, 1–6 CrossRef CAS.
- K. H. Su, Q. H. Wei, X. Zhang, J. J. Mock, D. R. Smith and S. Schultz, Nano Lett., 2003, 3, 1087–1090 CrossRef CAS.
- C. A. Mirkin, R. L. Letsinger, R. C. Mucic and J. J. Storhoff, Nature, 1996, 382, 607–609 CrossRef CAS PubMed.
- M. J. Marín, B. D. Rackham, A. N. Round, L. A. Howell, D. A. Russell and M. Searcey, Chem. Commun., 2013, 49, 9113–9115 RSC.
- Y. Song, W. Wei and X. Qu, Adv. Mater., 2011, 23, 4215–4236 CrossRef CAS PubMed.
- K. Saha, S. S. Agasti, C. Kim, X. Li and V. M. Rotello, Chem. Rev., 2012, 112, 2739–2779 CrossRef CAS PubMed.
- P. Babu, S. Sinha and A. Surolia, Bioconjugate Chem., 2006, 18, 146–151 CrossRef PubMed.
- B. Mukhopadhyay, M. B. Martins, R. Karamanska, D. A. Russell and R. A. Field, Tetrahedron Lett., 2009, 50, 886–889 CrossRef CAS PubMed.
- R. Kikkeri, B. Lepenies, A. Adibekian, P. Laurino and P. H. Seeberger, J. Am. Chem. Soc., 2009, 131, 2110–2112 CrossRef CAS PubMed.
- X. Jiang, M. Ahmed, Z. Deng and R. Narain, Bioconjugate Chem., 2009, 20, 994–1001 CrossRef CAS PubMed.
- T. Ohyanagi, N. Nagahori, K. Shimawaki, H. Hinou, T. Yamashita, A. Sasaki, T. Jin, T. Iwanaga, M. Kinjo and S.-I. Nishimura, J. Am. Chem. Soc., 2011, 133, 12507–12517 CrossRef CAS PubMed.
- H. Bavireddi and R. Kikkeri, Analyst, 2012, 137, 5123–5127 RSC.
- N. Bogdan, F. Vetrone, R. Roy and J. A. Capobianco, J. Mater. Chem., 2010, 20, 7543–7550 RSC.
- J. Gallo, I. García, D. Padro, B. Arnaiz and S. Penadés, J. Mater. Chem., 2010, 20, 10010–10020 RSC.
- I. García, J. Gallo, N. Genicio, D. Padro and S. Penadés, Bioconjugate Chem., 2011, 22, 264–273 CrossRef PubMed.
- J. Gallo, N. Genicio and S. Penadés, Adv. Healthcare Mater., 2012, 1, 302–307 CrossRef CAS PubMed.
- L.-H. Liu, H. Dietsch, P. Schurtenberger and M. Yan, Bioconjugate Chem., 2009, 20, 1349–1355 CrossRef CAS PubMed.
- M. Moros, B. Pelaz, P. López-Larrubia, M. L. García-Martín, V. Grazu and J. M. de la Fuente, Nanoscale, 2010, 2, 1746–1755 RSC.
- M. Moros, B. Hernáez, E. Garet, J. T. Dias, B. Sáez, V. Grazú, Á. González-Fernández, C. Alonso and J. M. de la Fuente, ACS Nano, 2012, 6, 1565–1577 CrossRef CAS PubMed.
- B. K. Gorityala, J. Ma, X. Wang, P. Chen and X.-W. Liu, Chem. Soc. Rev., 2010, 39, 2925–2934 RSC.
- D. C. Hone, A. H. Haines and D. A. Russell, Langmuir, 2003, 19, 7141–7144 CrossRef CAS.
- J. H. Naismith and R. A. Field, J. Biol. Chem., 1996, 271, 972–976 CrossRef CAS PubMed.
- F. A. Jaipuri, B. Y. M. Collet and N. L. Pohl, Angew. Chem., Int. Ed., 2008, 47, 1707–1710 CrossRef CAS PubMed.
- B. V. Enüstün and J. Turkevich, J. Am. Chem. Soc., 1963, 85, 3317–3328 CrossRef.
- J. Turkevich, P. C. Stevenson and J. Hillier, Discuss. Faraday Soc., 1951, 55–75 RSC.
- J. J. Storhoff, A. A. Lazarides, R. C. Mucic, C. A. Mirkin, R. L. Letsinger and G. C. Schatz, J. Am. Chem. Soc., 2000, 122, 4640–4650 CrossRef CAS.
- D. F. Senear and D. C. Teller, Biochemistry, 1981, 20, 3076–3083 CrossRef CAS.
- C. L. Schofield, R. A. Field and D. A. Russell, Anal. Chem., 2007, 79, 1356–1361 CrossRef CAS PubMed.
- C. L. Schofield, A. H. Haines, R. A. Field and D. A. Russell, Langmuir, 2006, 22, 6707–6711 CrossRef CAS PubMed.
- C. Earhart, N. R. Jana, N. Erathodiyil and J. Y. Ying, Langmuir, 2008, 24, 6215–6219 CrossRef CAS PubMed.
- C. G. Kumar, S. K. Mamidyala, M. N. Reddy and B. V. S. Reddy, Process Biochem., 2012, 47, 1488–1495 CrossRef CAS PubMed.
- D. Craig, J. Simpson, K. Faulds and D. Graham, Chem. Commun., 2013, 49, 30–32 RSC.
- Ž. Krpetić, L. Guerrini, I. A. Larmour, J. Reglinski, K. Faulds and D. Graham, Small, 2012, 8, 707–714 CrossRef PubMed.
- K. Niikura, K. Nagakawa, N. Ohtake, T. Suzuki, Y. Matsuo, H. Sawa and K. Ijiro, Bioconjugate Chem., 2009, 20, 1848–1852 CrossRef CAS PubMed.
- R. Karamanska, B. Mukhopadhyay, D. A. Russell and R. A. Field, Chem. Commun., 2005, 3334–3336 RSC.
- M. Fais, R. Karamanska, S. Allman, S. A. Fairhurst, P. Innocenti, A. J. Fairbanks, T. J. Donohoe, B. G. Davis, D. A. Russell and R. A. Field, Chem. Sci., 2011, 2, 1952–1959 RSC.
- H. Uzawa, K. Ohga, Y. Shinozaki, I. Ohsawa, T. Nagatsuka, Y. Seto and Y. Nishida, Biosens. Bioelectron., 2008, 24, 923–927 CrossRef CAS PubMed.
- H. Tsutsumi, H. Ohkusa, H. Park, T. Takahashi, H. Yuasa and H. Mihara, Bioorg. Med. Chem. Lett., 2012, 22, 6825–6827 CrossRef CAS PubMed.
- L. Ding, R. Qian, Y. Xue, W. Cheng and H. Ju, Anal. Chem., 2010, 82, 5804–5809 CrossRef CAS PubMed.
- X. Wang, O. Ramström and M. Yan, J. Mater. Chem., 2009, 19, 8944–8949 RSC.
- X. Wang, E. Matei, L. Deng, O. Ramström, A. M. Gronenborn and M. Yan, Chem. Commun., 2011, 47, 8620–8622 RSC.
- Y.-J. Chuang, X. Zhou, Z. Pan and C. Turchi, Biochem. Biophys. Res. Commun., 2009, 389, 22–27 CrossRef CAS PubMed.
- S. Watanabe, K. Yoshida, K. Shinkawa, D. Kumagawa and H. Seguchi, Colloids Surf., B, 2010, 81, 570–577 CrossRef CAS PubMed.
- H. Otsuka, Y. Akiyama, Y. Nagasaki and K. Kataoka, J. Am. Chem. Soc., 2001, 123, 8226–8230 CrossRef CAS PubMed.
- H. M. Branderhorst, R. Ruijtenbeek, R. M. J. Liskamp and R. J. Pieters, ChemBioChem, 2008, 9, 1836–1844 CrossRef CAS PubMed.
- R. J. Pieters, in Petite and Sweet: Glyco-Nanotechnology as a Bridge to New Medicines, ed. X. Huang and J. J. Barchi, Amer. Chemical Soc., Washington, 2011, vol. 1091, pp. 91–103 Search PubMed.
- M. J. Marín, A. Rashid, M. Rejzek, S. A. Fairhurst, S. A. Wharton, S. R. Martin, J. W. McCauley, T. Wileman, R. A. Field and D. A. Russell, Org. Biomol. Chem., 2013, 11, 7101–7107 Search PubMed.
- S. J. Gamblin and J. J. Skehel, J. Biol. Chem., 2010, 285, 28403–28409 CrossRef CAS PubMed.
- J. J. Skehel and D. C. Wiley, Annu. Rev. Biochem., 2000, 69, 531–569 CrossRef CAS PubMed.
- A. J. Reynolds, A. H. Haines and D. A. Russell, Langmuir, 2006, 22, 1156–1163 CrossRef CAS PubMed.
- A. Carvalho de Souza, K. M. Halkes, J. D. Meeldijk, A. J. Verkleij, J. F. G. Vliegenthart and J. P. Kamerling, ChemBioChem, 2005, 6, 828–831 CrossRef CAS PubMed.
- C. L. Schofield, B. Mukhopadhyay, S. M. Hardy, M. B. McDonnell, R. A. Field and D. A. Russell, Analyst, 2008, 133, 626–634 RSC.
- E. A. Merritt and W. G. J. Hol, Curr. Opin. Struct. Biol., 1995, 5, 165–171 CrossRef CAS.
- T. Beddoe, A. W. Paton, J. Le Nours, J. Rossjohn and J. C. Paton, Trends Biochem. Sci., 2010, 35, 411–418 CrossRef CAS PubMed.
- Y.-Y. Chien, M.-D. Jan, A. K. Adak, H.-C. Tzeng, Y.-P. Lin, Y.-J. Chen, K.-T. Wang, C.-T. Chen, C.-C. Chen and C.-C. Lin, ChemBioChem, 2008, 9, 1100–1109 CrossRef CAS PubMed.
- X. Wang, O. Ramström and M. Yan, Anal. Chem., 2010, 82, 9082–9089 CrossRef CAS PubMed.
- J. M. de la Fuente, A. G. Barrientos, T. C. Rojas, J. Rojo, J. Cañada, A. Fernández and S. Penadés, Angew. Chem., Int. Ed., 2001, 40, 2257–2261 CrossRef.
- Á. G. Barrientos, J. M. de la Fuente, T. C. Rojas, A. Fernández and S. Penadés, Chem.–Eur. J., 2003, 9, 1909–1921 CrossRef PubMed.
- S. Takae, Y. Akiyama, H. Otsuka, T. Nakamura, Y. Nagasaki and K. Kataoka, Biomacromolecules, 2005, 6, 818–824 CrossRef CAS PubMed.
- J. M. Bergen, H. A. von Recum, T. T. Goodman, A. P. Massey and S. H. Pun, Macromol. Biosci., 2006, 6, 506–516 CrossRef CAS PubMed.
- G. N. Rogers and B. L. D'Souza, Virology, 1989, 173, 317–322 CrossRef CAS.
| This journal is © The Royal Society of Chemistry 2015 |