
 Open Access Article
 This Open Access Article is licensed under a
 Creative Commons Attribution 3.0 Unported Licence
Macro-mesoporous resorcinol–formaldehyde polymer resins as amorphous metal-free visible light photocatalysts†
Guan
Zhang
*a,
Chengsheng
Ni
a,
Lingjuan
Liu
ab,
Guixia
Zhao
a,
Federica
Fina
a and
John T. S.
Irvine
*a
aSchool of Chemistry, University of St Andrews, St Andrews, Fife, UK. E-mail: gz23@st-andrews.ac.uk; jtsi@st-andrews.ac.uk
bSchool of Materials Science and Engineering, Hefei University of Science and Technology, Anhui, PR. China
First published on 3rd July 2015
Abstract
We have demonstrated that resorcinol–formaldehyde resin polymers are good visible light responsive photocatalysts, with band gap energies ranging from ca. 1.80 to 2.00 eV. They were found to be photoactive in terms of decomposition of organic substrates under visible light irradiation. The photocatalytic performance of resins could be markedly enhanced by coupling with electron conducting materials such as reduced graphene oxide. Photocatalytic water oxidation was also achievable on the hybrid reduced graphene oxide/resin catalyst with a sacrificial agent. These industrial widely-used resins exhibit many merits as photocatalysts such as low-cost, high surface area, large pore size and volume, facile preparation and scalability for development of eco-friendly commercial products with “self-cleaning” properties, based on their capability for the oxidative removal of organic pollutants under visible light.
Visible light photocatalysis has attracted dramatic attention due to its promising applications of utilizing solar energy for environmental remediation and energy conversion. For practical use in the environmental and energy areas, ideal photocatalysts that work well under solar light should possess the characteristics of strong absorbance of visible light, suitable band levels, excellent (photo)chemical stability, economic feasibility and non-toxicity.1 Although hundreds of photocatalysts have been reported so far, searching for stable, efficient and low-cost materials that are active under visible light has proved challenging.2 Recently, instead of using metal-containing semiconductors, metal-free photocatalytic materials are a promising new class of visible light photocatalysts, especially since the graphitic C3N4 (g-C3N4) was found to perform photocatalytic water splitting in the visible light region.3 A few other metal-free photocatalysts are reported: such as C3N3S3,4 boron carbides,5 elemental α-sulfur,6 b-rhombohedral boron7 and red phosphorus,8 carbon materials based poly(p-phenylenes),9 P-doped graphene,10 nanoporous carbon11 and polyimide.12 Very recently, a one-dimensional conducting poly(diphenylbutadiyne) photocatalyst and a band-gap tunable organic polymer photocatalyst were reported for the visible light photocatalysis.13,14
Phenolic resins synthesized from poly-condensation of phenols and formaldehydes are already used in large quantities for many industrial applications, and also are widely used for preparing a variety of nanostructured carbons, which have attracted interest for potential applications as adsorbents, battery electrodes, super-capacitors, drug delivery carriers, as well as supports for catalysts.15 Herein, we demonstrate for the first time that simple polymeric resorcinol–formaldehyde (RF) resins can also function as visible-light-responsive photocatalysts for organic pollutants degradation. The high surface area and pore volume structural characteristics of resin materials enable strong adsorption towards the organic pollutants, which would be one of the advantages for its use in the photocatalytic process. Furthermore, another important advantage of RF resins is the easiness of textural property modification and the possibility to introduce foreign elements such as nitrogen,16 or interpenetrate inorganic nanoparticles such as CuO into the structure in order to change physicochemical and functional properties.17 These metal-free, low-cost and carbon-based porous RF resins exhibiting high adsorption capacity and photocatalytic activity provide a new class of photocatalysts for environmental remediation and solar energy conversion.
The RF resin can be easily synthesized by poly-condensation of resorcinol and formaldehyde in an aqueous solution and the structure of the resulting resins is shown in Scheme 1. The physiochemical properties of nanostructured phenolic resins, such as their shape, size, porosity and surface charges, are crucial for their applications. Some research work has demonstrated that a variety of phenolic resins with different structures and morphologies could be synthesized by controlling the condensation condition.15,18–20 In this work, gelation and curing of resorcinol (R) and formaldehyde (F) sols with different R/F ratios (RF12 (R![[thin space (1/6-em)]](https://www.rsc.org/images/entities/char_2009.gif) :F = 1:2) and RF14 (R:F = 1:4)) were carried out at 85 °C for 72 h. The resin samples were crushed into powder in a mortar and then suspended into acetone solvent with ball-milling for 1.5 h to get fine powder (10 mm zirconia ball). Then the fine powder samples were collected by filtration with DI water washing to remove some impurities. Furthermore, urea (U)–formaldehyde polymer can also be prepared by the same way,21 as a nitrogen source for preparing nitrogen-containing polymer resin, urea was also added to the formaldehyde and resorcinol solution for preparing resorcinol–formaldehyde–urea resin (RFU (R:F:U = 1:2:0.5)) by the same method. Experimental details can be found in the ESI.†
:F = 1:2) and RF14 (R:F = 1:4)) were carried out at 85 °C for 72 h. The resin samples were crushed into powder in a mortar and then suspended into acetone solvent with ball-milling for 1.5 h to get fine powder (10 mm zirconia ball). Then the fine powder samples were collected by filtration with DI water washing to remove some impurities. Furthermore, urea (U)–formaldehyde polymer can also be prepared by the same way,21 as a nitrogen source for preparing nitrogen-containing polymer resin, urea was also added to the formaldehyde and resorcinol solution for preparing resorcinol–formaldehyde–urea resin (RFU (R:F:U = 1:2:0.5)) by the same method. Experimental details can be found in the ESI.†
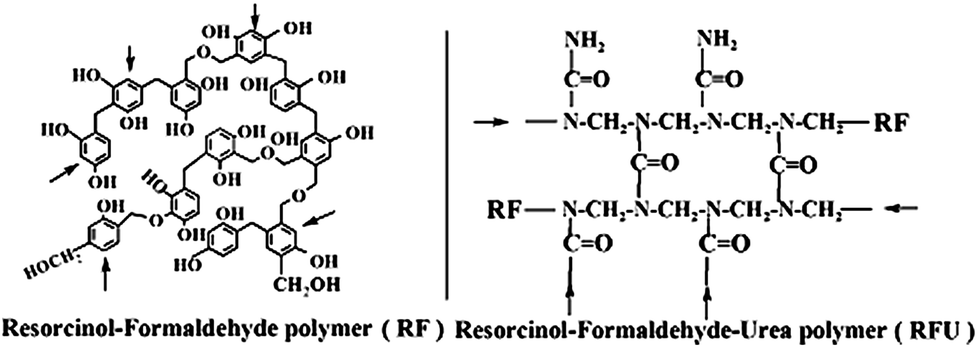 | ||
| Scheme 1 Illustration of the possible structures of resorcinol–formaldehyde (RF) polymer and resorcinol–formaldehyde–urea (RFU) polymer prepared from poly-condensation of resorcinol, formaldehyde and urea. (The arrows indicate the further extension of polymeric network via the functional groups). | ||
The morphologies of different resin samples observed by SEM (Fig. S1†) are quite different. RF12 and RF14 sample powders are mainly composed of agglomerated primary spherical particles with diameters between 50–80 nm (Fig. S1a†) and 80–100 nm (Fig. S1b†), respectively. However, small amounts of flake-type stacking particles can be found (Fig. S1d†). RFU sample particles are much smaller with uniform particle size of 20–30 nm (Fig. S1c†). It is well-known that the molar ratio of resorcinol to formaldehyde is one of the crucial parameters influencing the poly-condensation process, which determines the type, morphology, stability, physical states and chemical properties of the resulting resins.22 The polymerization proceeds via the attack of nucleophilic resorcinol and urea by the electrophilic protonated formaldehyde. In the case of RF14, excess amount of formaldehyde promotes three-dimensional interconnection of polymer chains, which might be the reason for the formation of larger particles and flake-type stacking particles. However, urea can also react with formaldehyde to form the cross-linked unit, which can interact with the RF unit to insert the nitrogen component into the polymer structure as shown in Scheme 1. The competitive reactions between the formaldehyde/urea and formaldehyde/resorcinol probably inhibits the three-dimensional interconnection induced by the formaldehyde, which might lead to the formation of smaller RFU polymer particles as observed from the SEM images.
The composition of functional groups on the resin samples was investigated by XPS. The results from the deconvolution of C1s, O1s and N1s peaks are summarized in Table S1 and Fig. S2.† The C1s XPS spectra of the three resin samples are very similar. Upon further spectral deconvolution, two primary C1s peaks (∼90% portion) at BE of ca. 285.0 and ca. 286.5 eV are assigned to C–C and C–O bonds, while other small peaks at ca. 288.0 and ca. 291.0 eV are due to C![[double bond, length as m-dash]](https://www.rsc.org/images/entities/char_e001.gif) O and satellite peak. Similarly, the O1s XPS spectra could be fitted with two primary O1s peaks, which are assigned to C–O at ca. 533.0 eV from alcohols, phenols and carboxyl groups and CO at ca. 531.0 eV from ketone or carboxyl groups. For RF12 and RF14 samples, the C–O bonds are the main contributions (∼90%), while the ratio of CO bonding increased to ca. 21% for RFU sample, which is attributed to the polymerization of urea with formaldehyde as illustrated in Scheme 1. The N1s peak at 399.8 (±0.3) eV in the RFU sample is quite symmetric and accordingly can be assigned to the unreacted –NH2 group and the inserted (CH2)2–N–CO group, since there is no significant difference on the XPS peak positions for the two nitrogen groups.23
O and satellite peak. Similarly, the O1s XPS spectra could be fitted with two primary O1s peaks, which are assigned to C–O at ca. 533.0 eV from alcohols, phenols and carboxyl groups and CO at ca. 531.0 eV from ketone or carboxyl groups. For RF12 and RF14 samples, the C–O bonds are the main contributions (∼90%), while the ratio of CO bonding increased to ca. 21% for RFU sample, which is attributed to the polymerization of urea with formaldehyde as illustrated in Scheme 1. The N1s peak at 399.8 (±0.3) eV in the RFU sample is quite symmetric and accordingly can be assigned to the unreacted –NH2 group and the inserted (CH2)2–N–CO group, since there is no significant difference on the XPS peak positions for the two nitrogen groups.23
It is well-known that the XPS technique only gives the composition of the surface of a solid to a depth of few nanometers, whereas the elemental analysis (CHN) yields its bulk composition. The CHN analysis was also performed to determine the composition of resin samples, and the results are summarized in Table 1. The C/O and N/(C + O) ratios of resin samples from XPS and CHN analysis are also given for comparison. The CHN analysis results are consistent with the values calculated from the loaded precursors. The slightly reduced portions of hydrogen and oxygen in the resins from the CHN analysis are ascribed to the condensation of resorcinol and formaldehyde with elimination of H2O molecules. However, the C/O ratios of the three resin samples from XPS analysis are markedly smaller than those from CHN analysis, indicating that the concentration of hydroxyl group on the surface is much higher than that in the bulk. The hydroxyl-containing groups prefer the periphery of the polymeric particles as illustrated in Scheme 1. The N content from the XPS and CHN analysis is similar, implying the homogeneous distribution of urea–formaldehyde polymerization units in the bulk of RFU.
| Samples | Elemental contents | C/Oa | C/Ob | N/(C + O)a | N/(C + O)b | ||
|---|---|---|---|---|---|---|---|
| Cb | Hb | Nb | |||||
| RF12 | 60.4 | 4.6 | <0.1 | 0.95 | 1.72 | — | — |
| RF14 | 56.8 | 4.5 | <0.1 | 0.80 | 1.47 | — | — |
| RFU | 56.1 | 5.4 | 7.5 | 0.90 | 1.81 | 0.10 | 0.09 |
As shown in Fig. 1a, the XRD patterns of RF12 and RF14 resins are similar. A broad diffraction peak centered at 17.0° (002 diffraction) ranging from 10° to 30° indicates the amorphous structures of the resin samples. Other small sharp peaks around 43° (100 diffraction), typically shown from disordered carbon materials, are probably attributed to the small portion of flake-type stacking particles in the RF12 and RF14 as shown in the SEM images. In the XRD pattern of RFU, the main peak shifts to 19.5° and the disordered stacking peak at 43° cannot be found from the smaller and uniform RFU particles.
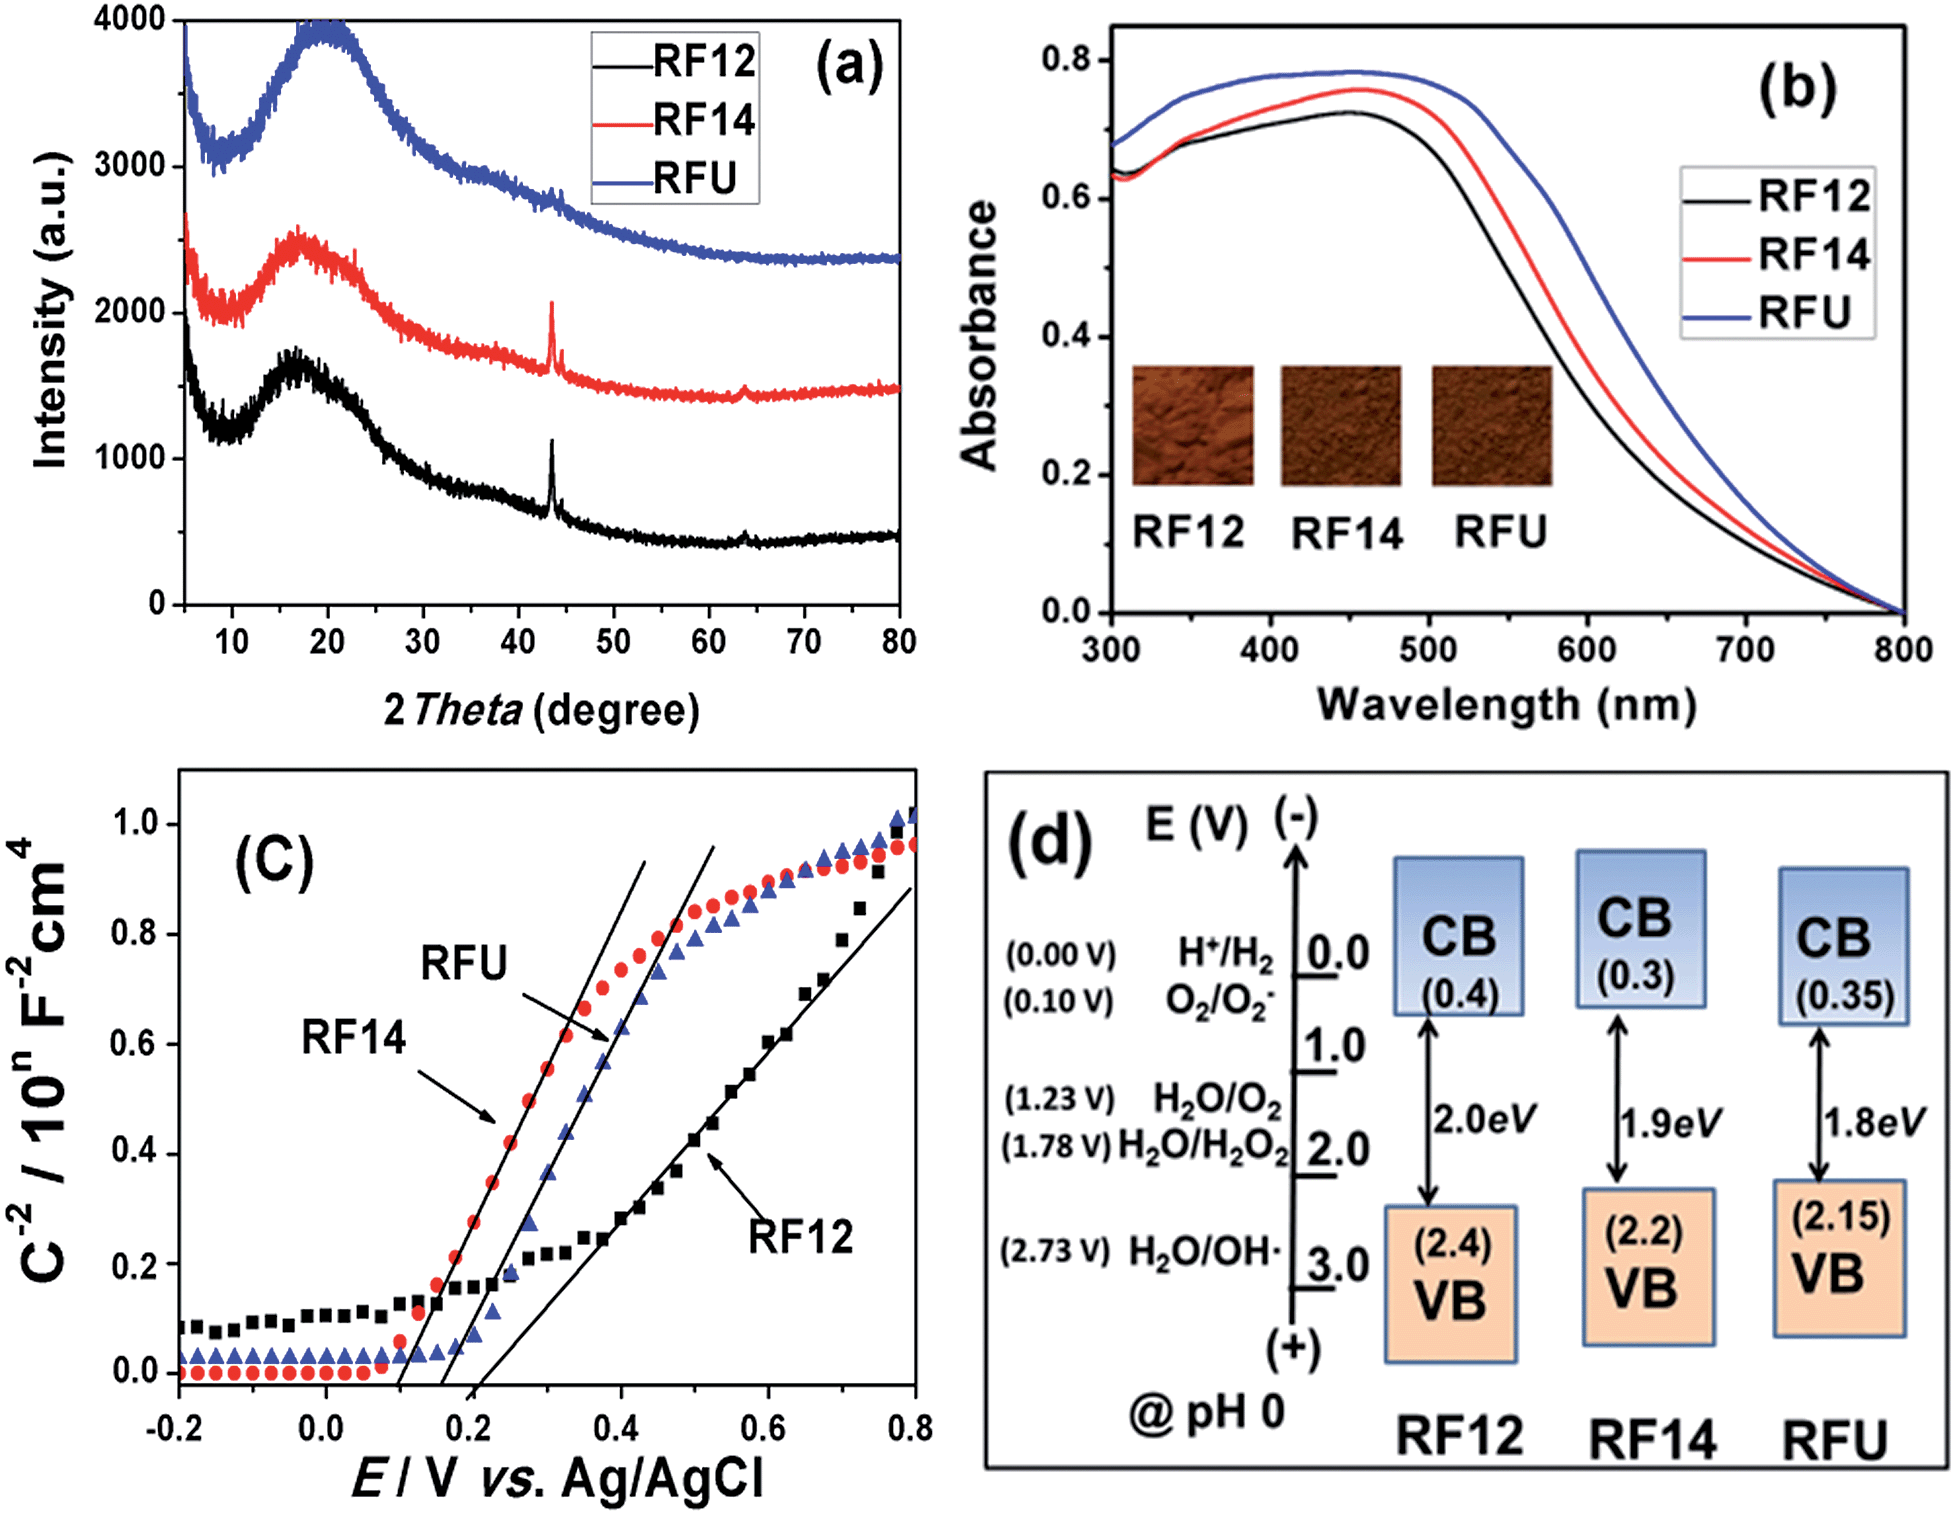 | ||
| Fig. 1 (a) XRD patterns and (b) UV-vis absorbance spectra of resin samples. (c) Mott–Schottky plots of resin samples measured at fixed frequency of 1029 Hz in dark (for y axis, n = 9, 14, 12 for RF12, RF14 and RFU, respectively). (d) Schematic illustration for band levels of RF12, RF14 and RFU and energy levels of some redox reactions are given for reference. | ||
The UV-vis absorbance spectra of resin samples are shown in Fig. 1b, and the absorption energy gaps estimated by Kubelka–Munk function from the UV-vis absorbance spectra (Fig. S3†) are about 2.00, 1.90 and 1.80 eV for RF12, RF14 and RFU, respectively. The red-shifts in the light absorption for the RF14 and RFU were provoked by varying the reactants composition. The differences of absorption energy among the polymeric resins are attributed to the changes in the density of electronic states of the aromatic rings upon functionalization. It is known that the energy states in amorphous carbon depend upon the sp2/sp3 content, the size of the sp2 clusters, and the ordering and distortions of π states. In the visible spectra region, the light absorption characteristics of aromatic materials are dominated by direct π–π* transitions.6,8,11 The size and content of the sp2 clusters and π states are markedly increased after polymerization with formaldehyde compared to those in the resorcinol molecule, which leads to stronger visible light absorption. Furthermore, the band gap energy could also be adjusted by the chemical functionalization via sp2/sp3 re-hybridization of the carbon atoms, and creation of mid-gap states below the conduction band edge.11 Therefore, the increase in formaldehyde ratio of RF14 sample and its XRD and SEM data agree well with the improved 3D connection and enhanced π–π stacking, which is the reason for the red-shift absorption for RF14. On the other hand, the proposed RFU structure scheme where formaldehyde/urea polymerization unit doesn't contribute to the aromatic π–π delocalization, along with the XRD and SEM results that imply a disturbed 3D network, suggest no possible enhanced π–π interaction via either 2D or 3D network. Thus, the feasible explanation for the red-shift absorption of RFU is the introduction of mid-gap states.
The band levels of resin samples were estimated by measuring flat-band potential according to the Mott–Schottky eqn (1)
 | (1) |
The porosity of the RF resin materials was confirmed by N2 sorption isotherms as shown in Fig. 2. The RF12 and RF14 samples exhibited type II N2 sorption isotherms with a sharp capillary condensation step at high relative pressure of P/P0 > 0.9, which is a characteristic of large pore sized macroporous materials. However, the isotherm of RFU represents typical type IV mesoporous adsorption isotherm. The capillary condensation step shifts to lower P/P0 values for RFU, indicating the gradual decrease in the pore diameter. The results are further confirmed by the pore size distribution of the resin samples. Wide pore size distributions from 20 to 150 nm are observed for RF12 and RF14, respectively. These less uniform meso-/macro-pores come from the three-dimensional interconnection of branched polymeric chains as shown in Scheme 1 or from the agglomeration of primary resin particles. However, RFU has a narrow and uniform pore size distribution ranging from 5 to 11 nm. These pores mainly exist within the primary RFU particles. The parameters of surface area and porosity of the resins are summarized in Table 2. The RF12 and RF14 possess pore volumes of 0.49 and 0.72 cm3 g−1 and average pore size of 23.3 and 28.0 nm, respectively; while the RFU has pore volume of 0.35 cm3 g−1 and average pore size of 7.2 nm. Even though the particle size of RF14 is larger than that of RF12, the accumulated pore volume of RF14 is much higher than that of RF12, which indicates the higher porosity of the RF14 compared to the RF12 due to the use of larger amount of formaldehyde during the polymerization. The BET surface area for RF12, RF14 and RFU are of 122.5, 148.0 and 150.2 m2 g−1, respectively. Such high surface area and large pore volume are beneficial for the adsorption of substrates in the catalytic process.
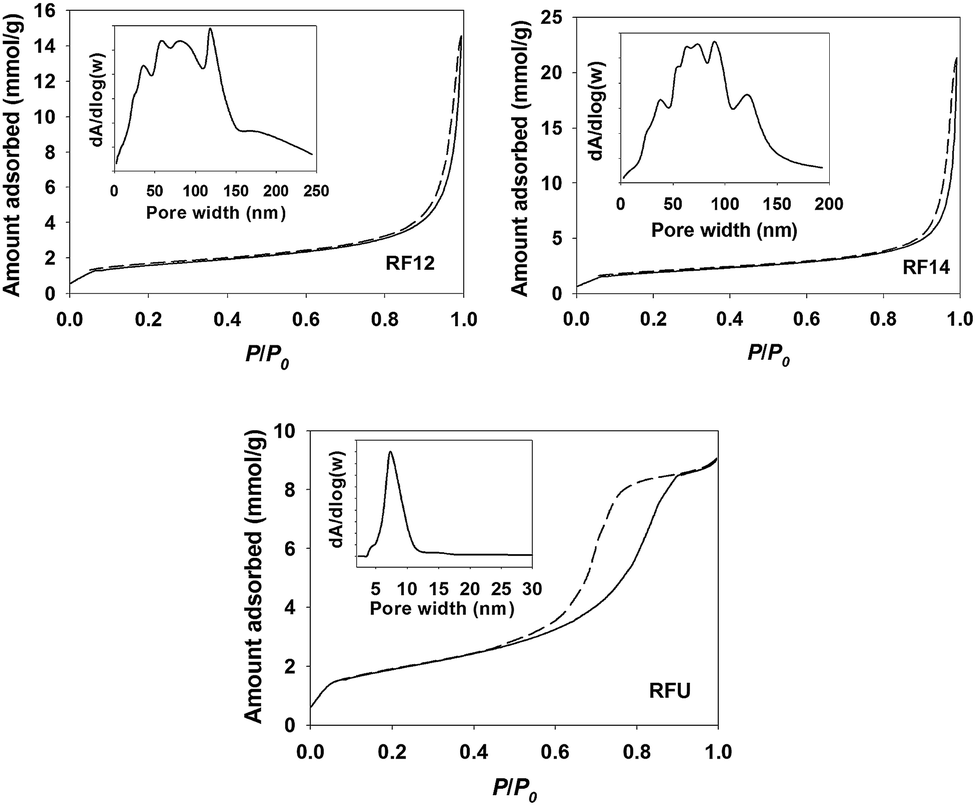 | ||
| Fig. 2 N2 adsorption isotherms and pore size distributions of RF12, RF14 and RFU polymer samples. | ||
| Sample | S BET (m2 g−1) | V total (cm3 g−1) | D AV (nm) | D PAR (nm) | BGe (eV) | CBf (V) |
|---|---|---|---|---|---|---|
| a S BET: the BET specific surface area. b V total: BJH desorption cumulative macro/mesopore volumes (2–300 nm). c D AV: BJH desorption average pore width. d D PAR: estimated particle size from SEM images. e BG: band-gap energy calculated from UV-vis absorbance spectra using K–M function. f CB: conduction band levels (vs. NHE) estimated by Mott–Schottky plots. | ||||||
| RF12 | 122.5 | 0.49 | 23.3 | 50–80 | 2.00 | 0.40 |
| RF14 | 148.0 | 0.72 | 28.0 | 80–100 | 1.90 | 0.30 |
| RFU | 150.2 | 0.35 | 7.2 | 20–30 | 1.80 | 0.35 |
The visible light photocatalytic activities of resin materials are evaluated by monitoring the decolourization of methylene blue (MB) dye and the degradation of 4-chlorophenol (4-CP). The negligible MB and 4-CP “self-decomposition” under visible light irradiation confirms that the decomposition of organics by resins is a light-driven process. As shown in Fig. 3a, all the resin samples showed marked activity for the decolourization of MB, whereas they were inactive in the dark. The slightly reduced concentration of MB in the dark results from the catalysts adsorption due to their porous structure, even the pre-adsorption of MB under dark was performed for 2 h. The 4-CP degradation results as shown in Fig. 3b also demonstrated that all the resin samples are capable of removing 4-CP under visible light irradiation with a slower decomposition rate. The RF14 exhibits the highest efficiency for the degradation of MB among the three samples, but it shows similar activity with RF12 for the degradation of 4-CP. It has been demonstrated that the photocatalytic performance of photocatalysts (e.g. TiO2) is quite depended on the substrates tested,26 implying that the photocatalytic activities of a catalyst are highly substrate-specific and complex. The reason that RFU has the lowest activity for both of degradation of MB and 4-CP is probably because of its most negative valence band potential (reduced oxidation power for holes). In addition, some mid-gap states introduced by nitrogen as to reduce the band-gap may also serve as the recombination centers for photo-generated charge carriers. On the other hand, given that the conduction bands of these photocatalysts are lower than the water reduction potential and oxygen reduction potential, the photo-degradation intermediates (oxidative degradation products from valence band holes) may serve as the electron acceptors for conduction band electrons.26 This is another side of the photocatalytic activity, which is hard to be investigated. In this work, our prime aim is to prove the possibility of polymeric resins function as the visible light photocatalysts, so the degradation products of MB and 4-CP are not paid much attention. Unfortunately, the exact molecular weight, structure of resins as well as the degradation intermediates are unknown, thus the turn of number (TON) for the catalysts during the oxidation of organics can't be determined. However, we have performed the photocatalytic oxidation of MB dyes for 3 cycles using the same bench of the catalyst to prove the stability of the catalyst and the catalytic degradation behavior. As shown in Fig. S11,† the slightly reduced activity during the 3 cycles maybe due to the reduced surface area (active sites) or adsorption of degradation intermediates, which inhibits the photocatalytic performance of recovered catalyst. The decay mechanism was further investigated by dispersing the catalyst with suitable sonication to minimize the reduced surface area of catalyst. The photocatalytic decay was markedly inhibited (Fig. S12†), indicating that the aggregation of catalyst was mainly responsible for the reduced activity in the multi-cycles test. The result suggested that the RF resins are stable under light illumination and the oxidation of organic dye is a photocatalytic process.
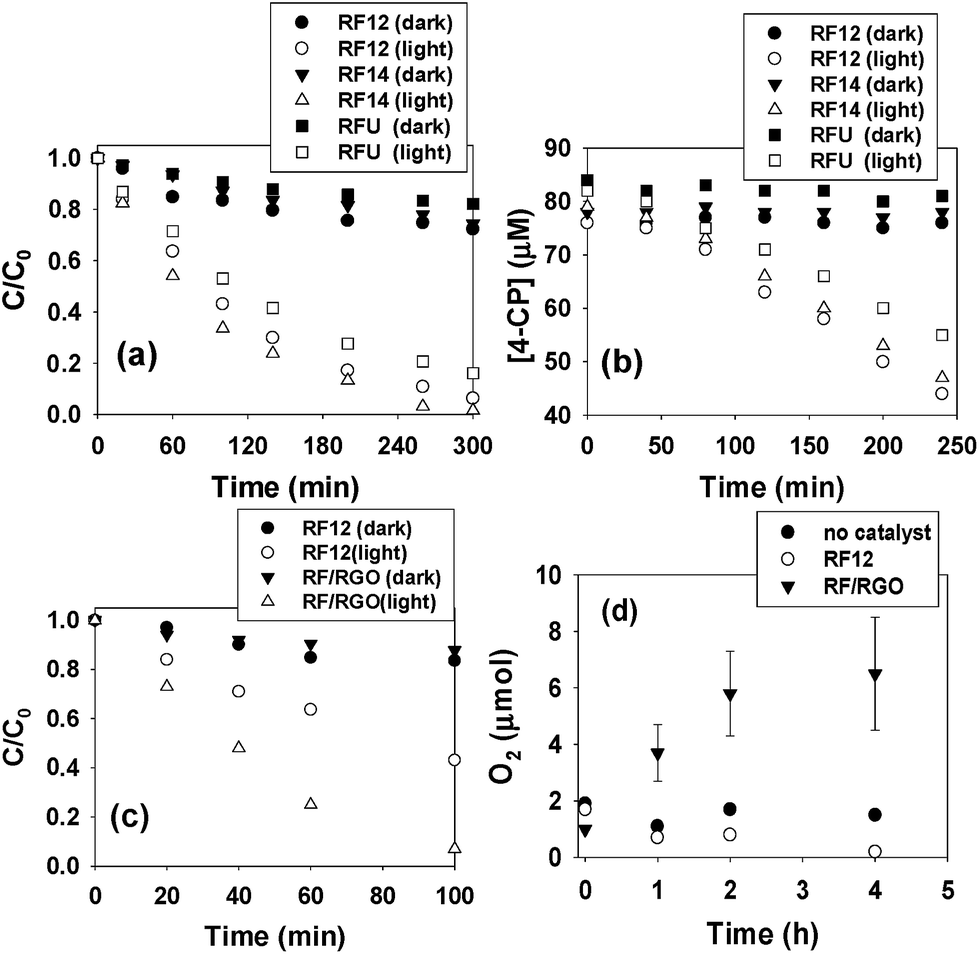 | ||
| Fig. 3 (a) Decolourization of MB dye and (b) degradation of 4-CP with different resin samples under visible light irradiation. (c) Comparison of decolourization of MB dye with pure RF12 and RF/RGO sample. Experimental condition: [MB]i and [4-CP]i = 100 μM, 15 ml catalysts suspension, dark adsorption for 2.0 h, air-equilibrated condition, λ ≥ 420 nm irradiation. (d) Photocatalytic water oxidation with 10 mg RF12 and RF/RGO samples from a 100 ml 5 mM AgNO3 aqueous solution in an Ar gas filled reactor under visible light irradiation. | ||
We suspect that the amorphous nature of the resin materials leads to the lower activity for the decomposition of organics due to the slow charge transfer efficiency. Therefore, we further attempted to couple resin (e.g. RF12 with deepest valence band) with reduced graphene oxide (RGO), which is a common strategy for enhancing photo-activities of semiconductor photocatalysts.27 The detailed information on the synthesis and characterization of few layered graphene oxide, RGO and RF12 resin coupled RGO (RF/RGO, mass ratio of RF:GO = 40:1) can be found in the ESI (Fig. S5 and S6†) and our published result.28 As shown in Fig. 3c, the decolourization of MB on RF/RGO was markedly enhanced by ∼3 folds. Since the physiochemical properties of RF12 wouldn't markedly change after coupling with RGO, the enhanced photocatalytic performance is mainly ascribed to the enhanced charge transfer efficiency (photo-generated electrons to RGO) and the increased separation of photo-generated electron–hole pairs as observed in other literatures.27,29,30 Furthermore, the O2 evolution from water oxidation using AgNO3 as a sacrificial electron acceptor was monitored (Fig. 3d). The O2 content in the head-space of reactor did not increase in the presence of RF12 resin because of the low activity. However, in the case of RF/RGO, trace amounts of O2 generated from water oxidation within 4 h could be detected by comparing with control experiments, even though there was a large fluctuation on the concentration of O2 in each test. Since water oxidation mediated by four-electron reaction is thermodynamically unfavorable than the organics oxidation via one-electron reaction, it is understandable that the water oxidation performance on resin materials was not so impressive. On the other hand, we have to consider that the emission spectrum (Fig. S7†) of the iron-doped metal halide lamp is not continuous in the visible light region, therefore it is reasonably expected that the photocatalytic performance of the resin samples would be better if a common xenon lamp or a solar simulator was employed as a light source.
By comparing the valence band potentials of resin samples with the redox potential of H2O/˙OH (∼2.7 V vs. NHE) (Fig. 1d), it is unlikely that holes react with surface-adsorbed water or hydroxyl species to produce hydroxyl radicals as strong oxidants for decomposition of organics. On the other hand, the conduction band potentials of resin samples are less negative than the redox potential of O2/O2˙− (∼0.1 V vs. NHE), it is also not possible that the conduction band electrons reduce oxygen to generate superoxide radicals and hydroxyl radicals. Therefore, considering of the strong adsorption of the organic substrates onto resins, we propose that the degradation of organic substrates was mainly driven by the photo-generated holes based on some experimental evidences. Firstly, we can see that the UV-vis absorption spectra of MB decrease without blue shift of maximum absorption peak at 664 nm (Fig. S8†). The hypochromic effect is commonly observed from the radical-species mediated degradation of dyestuffs like methylene blue and rhodamine B.31 The absence of hypochromic effect indicates that the MB decomposition was driven by hole oxidation. For further confirming the hole oxidation mechanism, methanol (10 vol%) as another hole scavenger was added into the MB solution before light irradiation. Because the oxidation potential of methanol (∼0.61 V)32 is close to that of MB dye (∼0.53 V),33 the decomposition of MB was expected to be inhibited due to the competition between the two hole scavengers. The rate of decolourization of MB dye was markedly reduced in the presence of methanol (Fig. S9†). In addition, we further investigated the role of O2 in the process of MB degradation. However, the decolourization efficiency with or without O2 was similar, which is in accordance with our assumption that the generation of oxidative species is not possible from the reductive pathway.
To further confirm the visible light induced generation of electron–hole pairs from the resins, the generation of electrons under visible light irradiation was monitored by photocurrent measurements as shown in Fig. 4. The generated electrons from resins by photo excitation were collected by an immersed Pt mesh electrode with the Fe3+ as an electron acceptor and shuttle that transfers the electrons from catalyst particles to the electrode (Eredox of Fe3+/Fe2+ = +0.77 V vs. NHE). In the presence of resins, there were apparent responses to light on/off switching under monochromatic light irradiation (460 nm) powered by a 50 W LED lamp, compared to the control experiment without catalyst loading. The blank photocurrent was probably due to the reduction of redox mediators (Fe3+) by visible photons. The trend for photocurrent generation among the three samples is RF14 > RF12 > RFU, which is consistent with the performance on the photocatalytic degradation of organics. The RF14 exhibited the highest photocurrent probably due to its highest conduction band level (highest reduction power for generated electrons), whereas the RFU showed the lowest photocurrent probably because of the existence of recombination centers within the band-gap. The relatively lower photocurrents can be attributed to the slower charge transfer efficiency for the amorphous resin, as both the photocurrents ramping rates and decay rates in each light on/off cycle are slow. On the other hand, the slight decrease of the photocurrents during the repeated light “on/off” processes probably results from the absence of electron donors for consuming photo-generated holes, which might be accumulated on the catalyst surface to decompose the sample. Since there is no direct contact between the catalyst particles with the working electrode, the observed current increase upon illumination due to a photo-enhanced conductivity enhancement (due to a boost in e/h charge carriers upon photoexcitation, leading to a higher dark current) observed on the semiconductor film electrode is negligible. The generation of anodic photocurrents upon visible light irradiation proves that photo-excited electrons transfer from the resin particles to the Fe3+ in solution and then to the Pt collecting electrode as illustrated in Fig. 4.
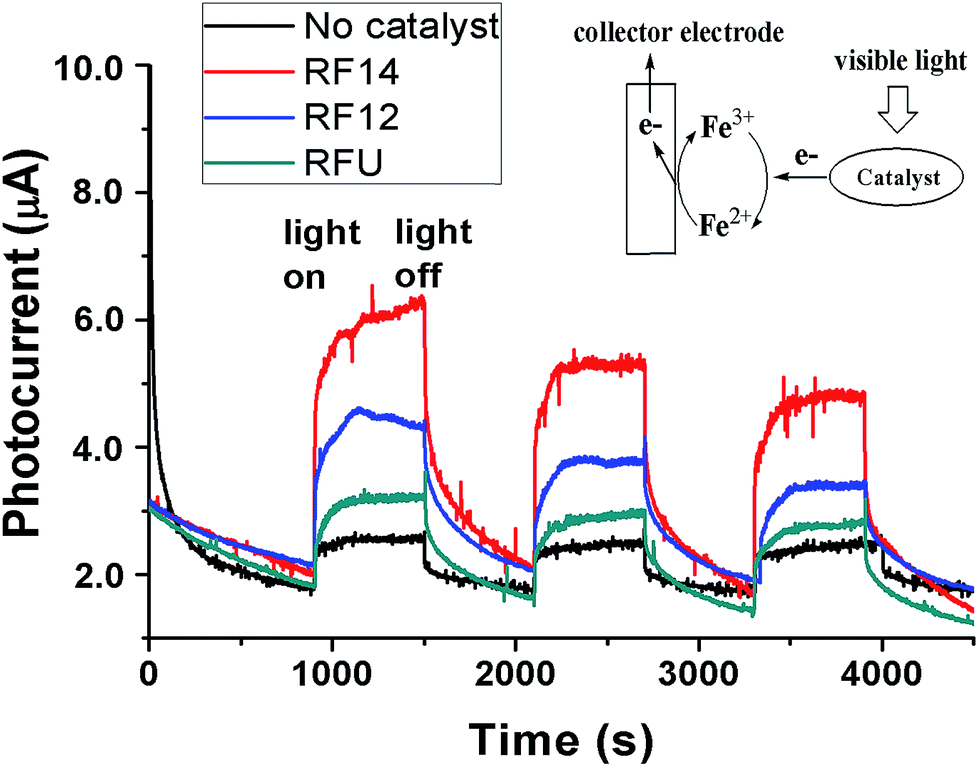 | ||
| Fig. 4 “On–off” process of current measurements under 50 W LED monochromatic light (460 nm) irradiation. Fe3+ was used as an electron accepter and shuttle. Experimental conditions: 25 mg of resin powder put onto the bottom of reactor filled with 50 ml aqueous solution, no direct contact between the catalysts and the collecting electrode, [Fe3+] = 0.1 mM, [Na2SO4] = 0.1 M as the electrolyte, Pt mesh collector at +1.2 V vs. Ag/AgCl (bias ∼0.2 V). | ||
Conclusions
In summary, resorcinol–formaldehyde based polymeric resins have been demonstrated as new visible light photocatalysts. The efficient photocatalytic decolourization of dye, degradation of 4-cholorophenol and generation of photocurrents under visible light were achieved. Sacrificial photocatalytic water oxidation on reduced graphene oxide coupled resin was also demonstrated. These metal-free carbon based resins possess high surface area, large pore size and volume, strong visible light absorbance, which makes them promising as a new class of visible light photocatalysts. However, due to the slow charge transfer properties of resins under illumination, it is not recommended to employ these original resins as water splitting photocatalysts or building photoelectrochemical electrode at this stage. Nitrogen content imbedding into the resin structure by adding urea as a polymerization reactant provokes a red-shift absorption due to the introduction of mid-gap states, which leads to the decreased photocatalytic activity. Further structure modification, morphology control or band-gap engineering are suggested to enhance the charge transfer efficiency and improve the photocatalytic performance for employing these resins as efficient solar conversion materials. Furthermore, in terms of the widely use of resin materials in industrial products, it is also attractive to develop some commodities with “self-cleaning” properties based on their capability for oxidative removal of organic pollutants.Acknowledgements
The authors thank the Engineering and Physical Sciences Research Council (EPSRC) for funding (EP/K036769/1; EP/K022237/1) and Royal society for a Wolfson Merit Award (JI).Notes and references
- G. Zhang, G. Kim and W. Choi, Energy Environ. Sci., 2014, 7, 954 CAS.
- Z. Yi, J. Ye, N. Kikugawa, T. Kako, S. Ouyang, H. Stuart-Williams, H. Yang, J. Cao, W. Luo, Z. Li, Y. Liu and R. L. Withers, Nat. Mater., 2010, 9, 559 CrossRef CAS PubMed.
- X. Wang, K. Maeda, A. Thomas, K. Takanabe, G. Xin, J. M. Carlsson, K. Domen and M. Antonietti, Nat. Mater., 2009, 8, 76 CrossRef CAS PubMed.
- Z. Zhang, J. Long, L. Yang, W. Chen, W. Dai, X. Fu and X. Wang, Chem. Sci., 2011, 2, 1826 RSC.
- J. Liu, S. Wen, Y. Hou, F. Zuo, G. J. O. Beran and P. Feng, Angew. Chem., Int. Ed., 2013, 52, 3241 CrossRef CAS PubMed.
- G. Liu, P. Niu, L. Yin and H. Cheng, J. Am. Chem. Soc., 2012, 134, 9070 CrossRef CAS PubMed.
- G. Liu, L. Yin, P. Niu, W. Jiao and H. Cheng, Angew. Chem., Int. Ed., 2013, 52, 6362 CrossRef PubMed.
- F. Wang, W. K. H. Ng, J. C. Yu, H. Zhu, C. Li, L. Zhang, Z. Liu and Q. Li, Appl. Catal., B, 2012, 111–112, 409 CrossRef CAS PubMed.
- S. Yanagida, A. Kabumoto, A. L. Rheingold and D. M. Heinekey, J. Chem. Soc., Chem. Commun., 1985, 474 RSC.
- M. Latorre-Sanchez, A. Primo and H. Garcia, Angew. Chem., Int. Ed., 2013, 52, 11813 CrossRef CAS PubMed.
- L. F. Velasco, J. C. Lima and C. Ania, Angew. Chem., Int. Ed., 2014, 53, 4146 CrossRef CAS PubMed.
- S. Chu, Y. Wang, Y. Guo, P. Zhou, H. Yu, L. Luo, F. Kong and Z. Zou, J. Mater. Chem., 2012, 22, 15519 RSC.
- S. Ghosh, N. A. Kouame, L. Ramos, S. Remita, A. Dazzi, A. Deniset-Besseau, P. Beaunier, F. Goubard, P. Aubert and H. Remita, Nat. Mater., 2015, 14, 505 CrossRef PubMed.
- R. S. Sprick, J.-X. Jiang, B. Bonillo, S. Ren, T. Ratvijitvech, P. Guiglion, M. A. Zwijnenburg, D. J. Adams and A. I. Cooper, J. Am. Chem. Soc., 2015, 137, 3265 CrossRef CAS PubMed.
- J. Liu, S. Z. Qiao, H. Liu, J. Chen, A. Orpe, D. Zhao and G. Q. Lu, Angew. Chem., Int. Ed., 2011, 50, 5947 CrossRef CAS PubMed.
- H. Jin, H. Zhang, H. Zhong and J. Zhang, Energy Environ. Sci., 2011, 4, 3389 CAS.
- N. Leventis, N. Chandrasekaran, A. G. Sadekar, C. Sotiriou-Leventis and H. Lu, J. Am. Chem. Soc., 2009, 131, 4576 CrossRef CAS PubMed.
- M. Perez-Cadenas, C. Moreno-Castilla, F. Carrasco-Marin and A. F. Perez-Cadenas, Langmuir, 2009, 25, 466 CrossRef CAS PubMed.
- T. Horikawa, J. Hayashi and K. Muroyama, Carbon, 2004, 42, 1625 CrossRef CAS PubMed.
- O. Cazkkel, K. Marthi, E. Geissler and K. Laszlo, Microporous Mesoporous Mater., 2005, 86, 124 CrossRef PubMed.
- L. Yuan, G. Liang, J. Xie, L. Li and J. Guo, Polymer, 2006, 47, 5338 CrossRef CAS PubMed.
- A. Pizzi and K. L. Mittal, Handbook of Adhesive Technology, Revised and Expanded, CRC Press, 2003, p. 599 Search PubMed.
- M.-C. Huang and H. Teng, Carbon, 2003, 41, 951 CrossRef CAS.
- H. Kim, D. Monllor-Satoca, W. Kim and W. Choi, Energy Environ. Sci., 2015, 8, 247 CAS.
- F. Cardon and W. P. Gomes, J. Phys. D: Appl. Phys., 1978, L63 CrossRef CAS.
- J. Ryu and W. Choi, Environ. Sci. Technol., 2008, 42, 294 CrossRef CAS.
- Q. Xiang, J. Yu and M. Jaroniec, J. Am. Chem. Soc., 2012, 134, 6575 CrossRef CAS PubMed.
- G. Zhao, J. Li, X. Ren, C. Chen and X. Wang, Environ. Sci. Technol., 2011, 45, 10454 CrossRef CAS PubMed.
- W. Fan, Q. Lai, Q. Zhang and Y. Wang, J. Phys. Chem. C, 2011, 115, 10694 CAS.
- J. Du, X. Lai, N. Yang, J. Zhai, D. Kisailus, F. Su, D. Wang and L. Jiang, ACS Nano, 2011, 5, 590 CrossRef CAS PubMed.
- T. Zhang, T. Oyama, A. Aoshima, H. Hidaka, J. Zhao and N. Serpone, J. Photochem. Photobiol., A, 2001, 140, 163 CrossRef CAS.
- D. Wang, J. Liu, Z. Wu, J. Zhang, Y. Su, Z. Liu and C. Xu, Int. J. Electrochem. Sci., 2009, 4, 1672 CAS.
- A. Mills and J. Wang, J. Photochem. Photobiol., A, 1999, 127, 123 CrossRef CAS.
Footnote |
| † Electronic supplementary information (ESI) available: Details of experimental procedure, characterizations of resins including SEM images, XPS spectra and deconvolution results, band-gap measurements, Mott–Schottky plots, XRD patterns and photo images, UV-vis absorption spectra of MB dye, methanol and oxygen effects on the decomposition of MB, recycle test of MB degradation. See DOI: 10.1039/c5ta03628c |
| This journal is © The Royal Society of Chemistry 2015 |