Captopril as a nucleophile for ester cleavage. Formation of the thiolester S-benzoylcaptopril†
Emilia Iglesias* and
Isabel Brandariz
Departamento de Química Física y E. Q. I. Facultad de Ciencias, Universidad de La Coruña, 15071-La Coruña, Spain. E-mail: emilia.iglesias@udc.es
First published on 15th May 2015
Abstract
The rates of both acyl transfer from phenylacetate (PhA) or acetylsalicylic acid (ASA), and benzyl transfer from phenylbenzoate (PhB) to the hydroxide ion and to the thiol anion of captopril (cap) or cysteine (cys) have been determined in an aqueous basic solution. The rates of ester cleavage by OH− are faster than that promoted by the thiol anion of either cap or cys. In every case, the pseudo-first order rate constant shows linear dependence on either [OH−] or [thiol]. Nevertheless, for the reaction between PhB and cap, the absorbance–time profiles obey consecutive reactions, where the two reaction paths were attributed to the rapid formation of S-benzoylcaptopril that subsequently decomposes in a slower reaction step to form phenolate and benzoate, as stable products. The S-benzoylcaptopril decomposition is accelerated in an alkaline medium and is practically suppressed in a carbonate buffer of pH 10. In addition, the presence of cationic micelles at concentration values close the cmc, not only accelerates the formation of the thiolester, but also decreases its decomposition. The second-order rate constant for the reaction between the three nucleophiles and PhA or ASA correlates quite well with the basicity (pKa) of the nucleophile, a fact that suggests the same reaction mechanism. In contrast, in the correlation for PhB, the data corresponding to the reaction with cap deviates significantly from the linear plot, which evidences a different reaction scheme.
1. Introduction
The cysteine proteases comprise a large group of enzymes that contain the –SH group of cysteine residues in the active site.1–3 These enzymes can be obtained from plants – such as papain,4 ficin,5 or actinidin6 –, bacterial, and animal sources. The catalytic cycle of cysteine proteases is known to proceed through an intermediate thiolester which is subsequently hydrolysed to regenerate the native enzyme. The intermediate thiolester is formed in the nucleophilic attack of the –SH group to the electrophilic centre, the carbonyl group of the substrate. Only a limited number of nucleophiles have been demonstrated to participate in covalent catalysis by enzymes.7 The wide reactivity of –SH groups in enzymes can be attributed to their different microenvironment and/or to the molecular weight of the thiol compound.Carbonyl displacement reactions have been extensively investigated. Many biochemical reactions involve nucleophilic attack in the acyl transfer process. The effect of acceptor and leaving group basicities on the reaction rate of the deacylation step is a valuable mechanistic probe. As a general rule, acyl transfer reactions in which the nucleophile is more basic than the leaving group involve rate-determining expulsion of the leaving group from the tetrahedral intermediate, which is consistent with the high sensitivity of the rate constants to the basicity of the acyl acceptor.8–10 The acyl transfer reaction of p-nitrophenyl acetate has been investigated with an extensive series of nucleophiles,8–12 including N-acetyl-L-cysteine.13 The study concludes that the thiolate anion, and not the protonate thiol, is the only species which reacts at a significant rate with the p-nitrophenyl acetate. Other amides or ester reactions with different thiols or amine thiols have been studied as simple model systems for the acylation step of the active site –SH in cysteine proteases.14,15
The present study was undertaken to examine the –SH nucleophilic attack to the carbonyl group of aromatic esters. Among them, it was chose phenylacetate (PhA), phenylbenzoate (PhB), and acetyl salicylic acid (ASA), in order to analyze the effect of the leaving group (phenolate, PhO−, or salicylate, SA−), as well as the acyl- or benzyl-transfer. As thiol models, it was studied the behavior of captopril (cap) and cysteine (cys), and the results were compared with the classical OH− hydrolysis.
Phenylacetate is a common metabolite of phenylalanine, and then a naturally occurring plasma component, which is used in the treatment of hyperammonemia associated with inborn errors of urea synthesis or liver failure. Due to its effectiveness in reducing plasma glutathione levels, PhA is implicated in growth control and differentiation of tumor cells through nontoxic mechanisms.16,17 On the other hand, captopril (cap) is a mercapto-proline derivative highly effective as angiotensin converting enzyme (ACE) inhibitor.18 The captopril molecule contains two acid ionisable groups, the carboxylic group of proline and the thiol group of the propionyl moiety. In aqueous medium several forms of cap are then possible depending on the pH; in strong acid medium (pH < 2.5) the neutral cap molecule predominates, whereas in strong alkaline medium (pH > 11.5) the doubly charged anion (cap−2) is the majority species.19,20 Reactivity between both family compounds, thiols and aromatic esters, are of interest from the biochemical perspective.
2. Results and discussion
2.1. Reaction in alkaline medium
The reaction spectra of the alkaline hydrolysis of either PhA, PhB or ASA show an increasing absorption band between 270–320 nm, approximately. As an example, for the hydrolysis of PhB in water at [OH−] = 0.013 M the band appears centered at 287 nm, while the much stronger absorption at 235 nm shifts to lower wavelengths. Two well-defined isosbestic points are drawn at 270 and 230 nm, see Fig. S1 (ESI†). These are typical characteristics of electronic spectra of the products of the reaction, i.e., phenolate (PhO−), benzoate (PhCOO−), or salicylate (SA−) anions that show two main absorption bands due to π → π* namely B-band (λmax ∼ 287 nm, ε ∼ 2600 M−1 cm−1) and E2-band (λmax ∼ 235 nm, ε ∼ 9400 M−1 cm−1). The reaction spectra of PhA resembles that of PhB except by the lower absorption intensity, as expected, due to in the latter case two absorbing products, PhO− and PhCOO−, are generated at equal concentration. In the case of ASA, the absorption maximum was stated at 296 nm due to the salicylate ion.21–25The kinetics of alkaline hydrolysis of the aforementioned aryl esters were examined by following the reaction as a function of [OH−] (I = 0.10 M and 25 °C) at the wavelength indicated in Table 1. Under these conditions the hydrolysis is first-order in [OH−], and the rate constant, ko, increases with the hydroxide ion concentration according eqn (1), indicating no significant uncatalysed reaction.
| ko = kOH[OH−] | (1) |
| Ester (c/mM) | λmax/nm | A∞ − Ao | Δε/M−1 cm−1 | kOHa/M−1 s−1 | kOHb/M−1 s−1 | Ref. |
|---|---|---|---|---|---|---|
| a This work.b Literature values. | ||||||
| PhA (0.25) | 286 | 0.520 | 2100 | 1.44 ± 0.01 | 1.15 (25 °C) | 8a |
| 5.6 (37.5 °C) | 26 | |||||
| PNPhA | 400 | — | — | — | 14.8 (25 °C) | 9 |
| 23.9 (37.5 °C) | 26 | |||||
| PhB (0.14) | 290 | 0.590 | 4250 | 0.455 ± 0.008 | Not found | — |
| ASA (0.29) | 296 | 0.890 | 3100 | 0.160 ± 0.020 | 0.32 (25 °C) | 21 |
| 0.16 (30 °C) | 22 | |||||
| 0.25 (37 °C) | 23 | |||||
| 0.56 (39 °C) | 24 | |||||
| 0.81 (56.4 °C) | 25 | |||||
Fig. 1 shows comparative data for the three aryl esters. Values of kOH are listed in Table 1, together with the reaction conditions and the net absorbance increase. It is necessary to remark that the net absorbance change is independent of [OH−]. The estimated value of molar absorptivity of the reaction product for the hydrolysis of PhB is nearly double of the corresponding to PhA, because PhB gives equimolar concentration of PhO− and PhCOO−, which absorb in the same spectral region and all are in good agreement with published values. Found literature kOH values are also given, including that of p-nitrophenyl acetate (PNPhA),26 for comparative purposes. The rate of PhA hydrolysis is more than 3-fold that of PhB and near 10 times that measured for ASA. The leaving group in PhA or PhB is the same; therefore, the reason of different reactivity must be due to the nature of the electrophilic site that in PhB is a poorer electrophile because of the resonance effect of the phenyl ring. The optimization structures and the formal charges on the atoms of interest, shown in Scheme 1, confirm this hypothesis. The 3D structure of PhB showed that both phenyl rings are in perpendicular planes. On the other hand, the low reactivity of acetyl salicylate anion can be justified by the electrostatic repulsion of OH−. The Eyring's plot, ln(kOH/T) versus 1/T, was constructed with the results of ASA (Fig. S3 of ESI†). Good correlation (cc > 0.98) was obtained if data of Tee et al.21 measured at 25 °C and that of Fersht et al.24 at 39 °C were not included. Both data were measured at I = 1.0 M, an important factor taking into account the ionic nature of both reagents. Then the temperature effect gives ΔH# = 43 kJ mol−1 and ΔS# = −119 J mol−1 K−1. The high negative entropy of activation accounts for a highly ordered transition state, which involves the approaching ions of same charge.
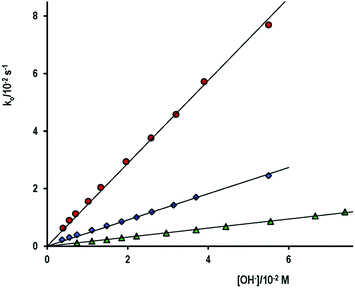 | ||
| Fig. 1 Plot of the observed rate constant, ko, for the alkaline hydrolysis of (●) PhA, (♦) PhB and (▲) ASA as a function of the OH− concentration, ionic strength 0.10 M and 25 °C. | ||
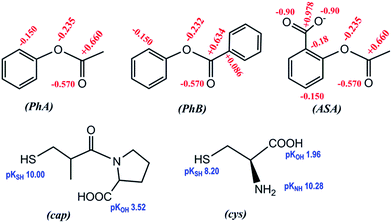 | ||
| Scheme 1 Chemical structures of the studied compounds; formal charges on selected atoms, and pKa of ionizable groups (including –NH3+ of cys). | ||
2.2. Ester thiolysis by captopril (cap)
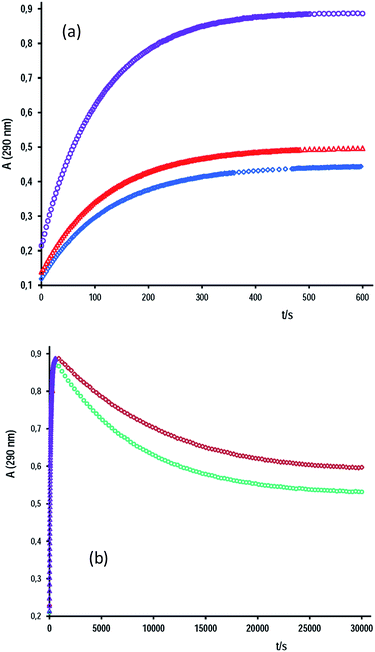
In this study, the behavior of cap as a nucleophile towards the hydrolysis of aromatic esters was analyzed. The cap concentration used was lower than 0.020 M and under acidity conditions of total ionization of cap, i.e. [OH−]o = 2[cap] + [OH−]free. Fig. 2 shows representative data of A–t profiles for PhB hydrolysis catalyzed by captopril. In the absence of cap, the absorbance reading at 290 nm at the end of the reaction, A∞, is due to the reaction products, PhO− and PhCOO−. In the presence of cap, a fast absorbance increase was observed in the first 5–10 min of the reaction; but enlarging the time scale more than 50-fold a second reaction appears, and as a consequence the absorbance decreases to reach the A∞ readings observed in the absence of cap, compare Fig. 2a and b. This finding says us that the initial product of the reaction is the thiolester of captopril (S-benzoylcaptopril, CAS: 75107-57-2P) that hydrolyses at much slower rates than its formation. In every case, the A–t profiles fit first-order integrated rate equation. Table 2 contains results of some typical experiments. It can be appreciate the relative rates of its formation (ko)-to-hydrolysis (k′o), as well as, the relative catalytic effect of [cap] over [OH−] for the reaction in water and in aqueous micellar medium of the surfactant tetradecyltrimethylammonium bromide (TTABr).
| [cap]/mM | [OH−]free/mM | [TTABr]/M | A∞ − Aoa | ko/s−1 | k′o/s−1 | Effect (290 nm) |
|---|---|---|---|---|---|---|
| a Net absorbance change (+, increase; −, decrease).b Rate constant of PhB hydrolysis by OH−.c Observed rate constant of thiolester formation.d Not detected.e Observed rate constant for thiolester hydrolysis. | ||||||
| — | 12.5 | — | +0.326 | 6.05 × 10⁻³b | N.D.d | A-increase |
| — | 12.5 | 0.013 | +0.359 | 8.13 × 10⁻³b | N.D.d | A-increase |
| 3.44 | 0.95 | — | +0.717 | 1.83 × 10⁻³c | — | A-increase |
| 4.60 | 6.0 | 0.0027 | +0.680 | 7.89 × 10⁻³c | — | A-increase |
| −0.386 | — | 1.28 × 10⁻⁴e | A-decrease | |||
| 4.60 | 6.0 | 0.013 | +0.685 | 9.09 × 10⁻³c | A-increase | |
| −0.345 | — | 1.01 × 10⁻⁴e | A-decrease | |||
The values of k′o afford the following second-order rate constant for thiolester hydrolysis k′OH = 0.021 M−1 s−1 or 0.017 M−1 s−1 at [TTABr] = 2.67 and 13 mM, respectively. Similar reaction found in the literature reports for the hydrolysis of the activated p-nitrobenzoyl ester of 2-(N,N-dimethylamino)ethanethiol the value of k′OH = 5.3 M−1 s−1 at 50 °C, along with that of other thiolesters.27
By increasing [cap], the rate of the reaction path with cap also increases and, consequently, the concentration of S-benzoylcaptopril is higher, which means high values of A∞ corresponding to the first reaction of thiolester formation. The rate of hydrolysis of S-benzoylcaptopril increases with [OH−]free, but in aqueous micellar medium of TTABr at concentrations higher than the critical micelle concentration, negligible hydrolysis was detected after 24 h.
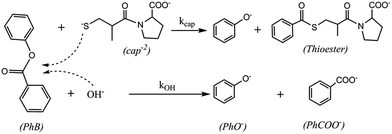
The pseudo-first order rate constant, ko, for the thiolester formation in the nucleophilic attack of cap to the carbonyl of PhB, increases with the concentration of cap according to eqn (2), which suggest the mechanism of competitive reactions stated in Scheme 2.
| ko = kwo + kcap[cap] | (2) |
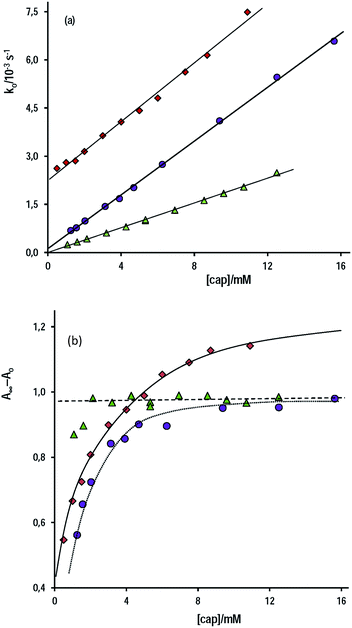
Fig. 3a shows three set of experiments performed in water at [OH−]free = 1.0 mM and 6.0 mM and at pH 9.90 in a buffer of carbonate–bicarbonate at total buffer concentration 0.20 M. In aqueous alkaline medium, the slope of the straight line is, within the experimental error, independent of [OH−]free, i.e. kcap = 0.46 ± 0.01 M−1 s−1 at [OH−]free = 6.0 mM and kcap = 0.42 ± 0.01 M−1 s−1 at [OH−]free = 1.0 mM, which, as required, evidences the total ionization of cap. Conversely, the uncatalyzed reaction is significantly affected by [OH−]free, e.g. kwo = (2.74 ± 0.08) × 10−3 s−1 or (0.45 ± 0.03) × 10−3 s−1 at [OH−] = 6.0 or 1.0 mM, respectively, because kwo = kOH[OH−]. These extrapolated kwo values are in reasonable agreement with that determined from kOH (Table 1) and the [OH−]f used.
On the other hand, under excess of [OH−], the variation of the net absorbance change, A∞ − Ao, with [cap] describes saturation curves. According to Scheme 2, the reaction between PhB and hydroxide yields PhO− and PhCOO− as reaction products, which contribute to the absorbance increase; the reaction path with cap yields also PhO− and the thiolester (ThE), whose molar absorptivity must be higher than that of benzoate. Therefore, high [cap] means high [ThE] and, consequently high absorbance change. Taking into account the contributions of the reaction products to A∞ stated in eqn (3) for 1 cm optical path length and the products concentration at the end of the reaction, eqn (4), it is easy to arrive to eqn (5) that expresses the absorbance variation as a function of captopril concentration.
| A∞ − Ao = εPhO[PhO−]∞ + εPhCOO[PhCOO−]∞ + εThE[ThE]∞ | (3) |
| [PhO−]∞ = [PhB]o |
 | (4) |
 | (5) |
In eqn (5) Ao∞ (={εPhO + εPhCOO}[PhB]o) is the absorbance at the end of the reaction in the absence of cap; Acap∞ (={εPhO + εThE}[PhB]o) is the absorbance at high [cap], i.e. when [thiolester] equals that of PhB, and fk = kcap/(kOH[OH−]), which is a known parameter. Fig. 3b shows the experimental results.
The non linear least squares analysis of the experimental values of A∞ − Ao against [cap] gives the optimized parameters of Acap∞ and fk reported in Table 3 together with the calculated fk values. There is a good concordance, mainly with the results at high [OH−], i.e. when the intercept of the straight line (reaction step by OH−) is more significant. In addition, the molar absorptivity of S-benzoylcaptopril was estimated as (5150 ± 150 M−1 cm−1).
| [PhB]/mM | [OH−]f/mM | Ao∞ | Acap∞ | fk(exp) | fk(cal) (=kcap/(kOH[OH−])) |
|---|---|---|---|---|---|
| 0.21 | 6.0 | 0.487 | 1.60 ± 0.06 | 176 ± 20 | 168 |
| 0.145 | 1.0 | 0.340 | 1.075 ± 0.025 | 620 ± 60 | 840 |
The lowest data set in Fig. 3a corresponds to the variation of ko as a function of [cap] in carbonate–bicarbonate buffer 0.20 M of pH 9.90. Again, a straight line was observed, but now the uncatalyzed reaction is negligible, i.e., kwo ∼ 0 and the slope is nearly half the value observed in excess of [OH−], that is ko = (0.193 ± 0.001)[cap].
The effect of [buffer] was studied at ionic strength 1.25 M (NaClO4), [cap] = 7.13 mM and pH 9.50. It was found a small catalysis: ko/s−1 = (7.0 ± 0.6) × 10−4 + (7.5 ± 0.3) × 10−4[buffer], which means a 20% increase at [buffer] = 0.20 M, see Fig. S4 of ESI.†
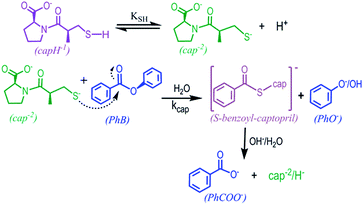
Finally, the effect of pH was analyzed at [cap] = 4.6 mM and total buffer concentration 0.20 M. The observed rate constant increases strongly with the pH. Fig. 4 displays the obtained results that describe a sigmoide curve, typical of a titration process, in which the inflection point can be noted at pH ∼ 10.2, that is the data ko versus pH fit a 3rd-order polynomic curve, for which the second derivative equals zero at pH ∼ 10.2. These results confirm that the reaction occurs by the nucleophilic attack of the thiolate group of captopril on the carbonyl of phenylbenzoate to yield the S-benzoylcaptopril, which is quite stable at these pH values, Scheme 3.
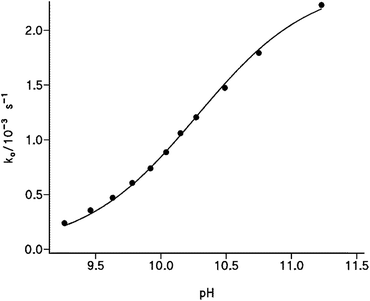 | ||
| Fig. 4 Plot of the pseudo-first order rate constant for the benzyl transfer reaction from PhB to cap ([cap] = 4.6 mM) as a function of pH of carbonate–bicarbonate buffered solutions, [buffer] = 0.20 M. Solid line fits eqn (6). | ||
Taking into account that [cap]o = [capH−] + [cap−2] and the expression of KSH given in Scheme 3, the observed rate constant is defined by eqn (6)
 | (6) |
The nonlinear correlation of ko vs. pH according to eqn (6) yields the optimized values of pKSH = 10.27 ± 0.02 and kcap[cap]o = (2.40 ± 0.05) × 10−3 s−1. Solid line in Fig. 4 shows the calculated points from eqn (6) using the optimized parameters. The kinetic pKSH compares quite well with the value obtained from direct potentiometric titration; however, one might take into account the different experimental conditions, especially the ionic strength in 0.20 M of carbonate–bicarbonate buffer and the slight catalytic effect of buffer in the reaction rate.
With this in mind, the slope of the plot ko vs. [cap] for experiments at pH 9.90 and shown in Fig. 3a (triangles) is slope = kcap/(1 + 10(pKSH−pH)); and then, kcap = 0.436 M−1 s−1, whose value agrees perfectly with that obtained in excess of OH−.
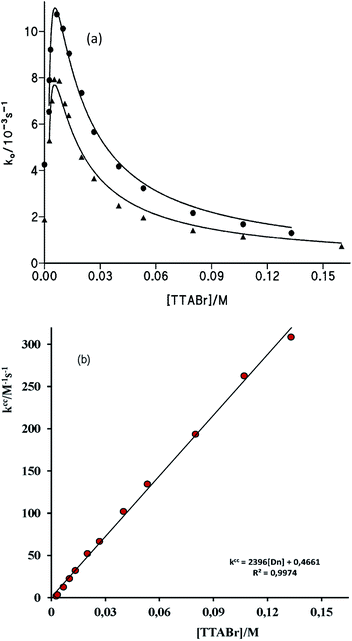 | ||
| Fig. 5 (a) Influence of [TTABr] on the observed rate constant, ko. For the reaction of S-benzoylcaptopril formation at (●) [cap] = 4.6 mM; [OH−]f = 6.0 mM, and (▲) [cap] = 3.4 mM, [OH−]f = 1.0 mM. Solid line fits eqn (7). (b) Plot of kcc versus [TTABr], see text, for ko-values obtained at (●) [cap] = 4.6 mM; [OH−]f = 6.0 mM. | ||
We have previously demonstrated that the cap anion binds effectively to cationic micelles of TTABr. The estimated value of the equilibrium binding constant was Kc = 70 M−1, but values up to 90 M−1 are also possible, since the binding process is mainly governed by the surfactant counterion, instead by the micelle hydrophobicity.20 Since the ion exchange equilibrium constant between the Br− surfactant counterions and OH− ca. is KBrOH = 55 at 25 °C,28 at the hydroxide concentration used in these experiments one can neglected the amount of OH− in the micellar surface. Consequently, the ester cleavage in the aqueous pseudophase is due to both OH− and cap−2, whilst that in the micellar pseudophase is only due to cap−2, being the corresponding bimolecular rate constants denote by kOH, kcap, and kmcap. By considering that the products of the reaction are the PhO− and the S-benzoylcaptopril, which are stable under the reaction conditions, the ko vs. [TTABr] profiles can be quantitatively analysed using a phase separation model29 that leads to eqn (7), where Ks and Kc are the distribution constants of PhB and the thiolate anion of cap, respectively, defined in terms of concentrations based on the total solution volume; kcap and kmcap are the second-order rate constants in the aqueous and micellar pseudo-phases, respectively, and kOH refers to the hydrolysis in water of PhB by OH−; Vm is the molar volume of the micellar reaction region, a necessary datum for a direct comparison between reactivities in water and micellar phase; the assumed value of Vm is 0.37 L mol−1 (estimated Vm range from 0.14 to 0.37 L mol−1),30 and Dn represents the micellized surfactant, i.e. [Dn] = [surfactant] − cmc.
 | (7) |
Eqn (7) was fitted to the experimental data of Fig. 5 in the following manner. Values of Kc were determined in previous study and good plots were obtained if Kc = 92 M−1 was assumed;20 the cmc was fixed as the minimum required surfactant concentration to observe an increase in ko (cmc = 2 mM) and using the experimental values of kOH (Table 1) and kcap, vide supra. The best estimates of kmcap and Ks were obtained by successive iterations. Solid lines shown in Fig. 5a correspond to the calculated points from eqn (7) with the optimized Ks = 650 M−1 and kmcap = 0.015 M−1 s−1.
From these estimated data, the plot of kc (=ko(1 + Ks[Dn])) against [Dn] should be a saturation curve as it can be observed in Fig. S5 and S6(a) of ESI.† In addition, the plot of kcc (={kc − kOH[OH−]}{1 + Kc[Dn]}/[cap−2]o) versus [Dn] must be a straight line of intercept = kcap and slope = KsKc(kmcap/V). The resulting graphs shown good linear relationship and the values of kcap are in good agreement with that determined in the absence of surfactant, see Fig. 5b and S6(b) of ESI.† The rate constant of PhB thiolysis by cap in the micellar interface is 30-fold lower than that in water, because of the lower polarity of the micellar interface, which makes the reaction transition state less stable. Charged transition states are stabilized in polar media. Then, the catalysis observed at low surfactant concentrations is due to the concentration effect of reagents, PhB and cap, in the small volume of the micelle.
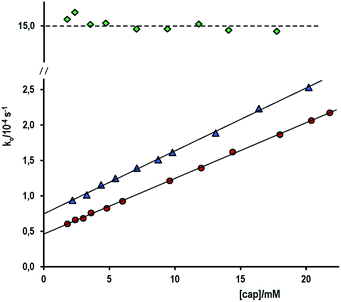
The hydrolysis of acetylsalicylic acid (ASA) is near 10-fold slower than that of PhA. The pKa of ASA is 3.50; then, in alkaline medium it is a negatively charged substrate. Therefore, the nucleophilic cleavage of ASA implies the approach of two anions: acetylsalicylate and cap−2 or OH−. The approach is difficult by electrostatic repulsion (high activation entropy), in fact, under conditions of fully ionized cap, the increase of [cap] from 1.78 to 17.9 mM at [OH−]f = 0.010 M and ionic strength 0.10 M (NaClO4) does not affect at all the observed rate constant, ko = (1.51 ± 0.05) × 10−3 s−1, see the upper most line on Fig. 6. By supposing the cleavage goes completely through the attack by OH−, one gets kOH = 0.151 M−1 s−1, that is, the value obtained in the study of the influence of [OH−] in the absence of cap, see Table 1.
In order to be able to measure the second-order rate constant due to the attack by cap, the reaction was studied in carbonate–bicarbonate buffer under the experimental conditions listed in Table 4. In both cases, ko increases nearly 4-fold at the highest [cap], see Fig. 6. Again, good straight lines were obtained, but now the corresponding slope is: slope = kcap/(1 + 10(pKSH−pH)), from which one determines the kcap listed in Table 4 for the second-order rate constant for the ASA cleavage by captopril. On the other hand, either in alkaline medium or in buffer solutions of carbonate–bicarbonate, the average absorbance increase at the end of the reaction was observed as A∞ − Ao = 0.977 ± 0.050 for [ASA] = 0.29 mM, and consequently ε(290 nm) = 3380 M−1 cm−1 in excellent agreement with data in Table 1.
| [buffer]/M | pH | [cap]/mM | kwo/10−4 s−1 | Slope/10−3 M−1 s−1 (eqn (2)) | kcap/M−1 s−1 | A∞ − Ao (290 nm) |
|---|---|---|---|---|---|---|
| 0.17 | 10.20 | 1.8 to 23 | 0.460 ± 0.005 | (7.850 ± 0.005) | 0.0128 | 0.98 ± 0.05 |
| 0.15 | 10.55 | 2.2 to 21 | 0.74 ± 0.01 | (8.95 ± 0.15) | 0.0115 | 0.97 ± 0.04 |
2.3. Hydrolysis by cysteine (cys)
For comparison purposes, the acyl transfer reaction of both PhA and ASA, as well as, the benzyl transfer reaction of PhB, to cysteine were analysed in aqueous alkaline medium at constant [OH−] and [ester].Cysteine contains three ionizable groups of pKa 1.96 (–COOH), 8.20 (–SH) and 10.28 (–NH3+). The total [OH−] was fixed equal to [OH−] = [OH−]f + 2[cys], in order to keep constant the dianion concentration (−S–CH2–C(COO−)–NH2). The [cys] was varied between 1.6 to 26.7 mM and, in order to reduce the alkaline hydrolysis, the [OH−]f = 1.0 mM. Under these conditions, good first-order kinetics was obtained in every case. The ko increases with [cys] following linear relations (Fig. S7 of ESI†) as for cap, eqn (2). The corresponding results are reported in Table 5.
| Rate constants | PhA (0.23 mM) | PhB (0.14 mM) | ASA (0.23 mM) |
|---|---|---|---|
| kwo/10−3 s−1 | 1.00 ± 0.15 | 0.515 ± 0.040 | 0.145 ± 0.003 |
| kcys/M−1 s−1 | 0.460 ± 0.010 | 0.213 ± 0.003 | 0.0065 ± 0.0003 |
Under conditions of completely ionization of cys, there are a priory three nucleophilic centers. However, the carboxylate group is the poorest nucleophile, so this reaction path can be neglected.31 On the other hand, the bimolecular rate constant for the attack of amines of similar pKa than that of the amine group of cys, such as dimethylamine (pKa 10.64) or n-butylamine (pKa 10.59), to phenylacetate (PhA) was determined as kami = 0.075 M−1 s−1, i.e. more than 6-fold slower than that determined here, which we assumed to be due to the thiolate attack.8b
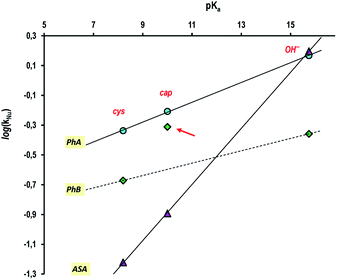
Finally, and putting all the results together, the Brönsted type correlation plot of log(kNu) vs. pKa yields quite good straight lines for the three nucleophiles studied in this work and whose results a summarized in Table 6 (see Fig. 7), with the exception of the datum of cap + PhB that, as we have demonstrated, correspond to a different reaction mechanism.
| Nucleophile | pKa | kNu/M−1 s−1 | PhA | PhB | ASA |
|---|---|---|---|---|---|
| OH− | 15.74 | kOH | 1.44 | 0.438 | 0.157 |
| cap−2 | 10.00 | kcap | 0.620 | 0.488 | 0.0128 |
| cys−2 | 8.20 | kcys | 0.460 | 0.213 | 0.0065 |
3. Conclusions
The best fit rate constants give in Table 6 invite some comparisons. The second-order rate constant for hydroxide attack on the aryl esters span a range near 10-fold with the order being PhA > PhB > ASA. The ordering might be explicable on electrostatic grounds reflecting the stabilization for the transition state for nucleophilic attack on neutral PhA relative to attack on anionic ASA; the relative rate decrease of PhB to PhA is due to the resonance effect in PhB, Scheme 1. The same ordering was observed with cap or cys as nucleophiles; nevertheless, the spanned range enlarges up to 50-fold or 70-fold, respectively to cap or cys, in agreement with reactivity-selectivity principle, in which as the nucleophile reactivity increases, the selectivity decreases. The results indicate also that PhA, PhB or ASA react with the thiolate anion of cap or cys in mild basic medium by the nucleophilic route. An observation which is reconciled by the well-established principle of acyl-, or benzyl-, transfer reactions in which when the nucleophile is less basic than the leaving group the reaction involves rate-determining attack of the nucleophile. This is consistent with the low sensitivity (βNu ∼ 0.1) of the rate constants to the basicity of the thiol. As a particular case, the reaction of cap and PhB leads to the rapid formation of the thiolester: S-benzoylcaptopril. This compound shows to be quite stable in buffer solutions of pH ∼ 10, as well as, in aqueous micellar solutions. The presence of cationic micelles enhances the rate of S-benzoyl-captopril formation, due to reagents concentration effect, and, practical suppresses its decomposition.By considering that thiol esters are common intermediates in the catalytic cycle of cysteine proteases, the systems studied here can be seen as biomimetic models of cysteine proteases that cleave ester substrates with the intermediacy of an S-acyl-enzyme, such as it occurs in the phenylbenzoate cleavage by captopril.
4. Experimental
4.1. Materials
All reagents were of the maximum available purity and were used without further purification. Esters (phenylacetate, phenylbenzoate, and acetylsalicylic acid), thiols (cysteine and captotpril or N-(3-mercapto-2-methylpropionyl)-L-proline), and the surfactant tetradecyl-trimethylammonium bromide (TTABr) were obtained from Sigma-Aldrich.Stock solutions of esters were prepared in dried dioxane, spectrophotometric grade. A small volume of this solution (40 or 50 μL) was added to the reaction sample (V = 3 mL) to start the reaction. The percentage of dioxane in the final reaction mixture never exceeded 2% v/v. The rest of the solutions were prepared in water that was firstly deionized and subsequently twice distilled (the first distillation over potassium permanganate). Cysteine solutions were prepared just before using them to avoid oxidation to cystine.
4.2. Techniques
The UV-vis spectra and kinetics of slow reactions (t1/2 > 60 s) were recorded with a Kontron-Uvikon double beam spectrophotometer fitted with thermostated multicell holders. Kinetics of fast reactions was studied on a Bio-Logic SFM-20 stopped-flow system interfaced with a computer and operated by Bio-Kine32 software (V4.51, 2009). The pH was controlled using buffer solutions of carbonate–hydrogen carbonate and was measured with a Crison 2001 pH-meter equipped with a GK2401B combined glass electrode and calibrated using commercial buffers of pH 4.01, 7.02, and 9.26 (Crison). The reported [buffer] refers to the total buffer concentration. In alkaline (NaOH) medium the acidity was reported as [OH−].4.3. Methods
The rate of ester hydrolysis was followed by noting the optical density increase due to the formation of products. Experiments were performed under pseudo-first order conditions with the ester as the limiting reagent concentration. Then, the integrated method was used to fit the experimental data of absorbance (A) versus time (t) to the first-order integrated rate equation, A = A∞ + (Ao − A∞)exp(−kot). The non-linear regression analysis gives ko, Ao, and A∞ as optimizable parameters, with ko being the pseudo-first order rate constant and A, Ao, and A∞, the absorbance readings at times t, zero, and at the end of the reaction. All experiments were carried out at 25 °C.References
- H. H. Otto and T. Schirmeister, Chem. Rev., 1997, 97, 133–171 CrossRef CAS PubMed.
- A. Barrett, in Proteinase Inhibitors, ed. A. Barrett and G. Salvesen, Elsevier, Amsterdam, 1986. pp. 3–22 Search PubMed.
- I. E. Liener, The Sulphydryl Proteases, in Food Related Enzymes. Advances in Chemistry, Am. Chem. Soc., 2009, vol. 136, ch. 8, pp. 202–219 Search PubMed.
- K. Varughese, F. Ahmed, P. Carey, S. Hasnain, C. Huber and A. Storer, Biochemistry, 1989, 28, 1330–1332 CrossRef CAS.
- I. Liener and B. Friedenson, Methods Enzymol., 1970, 19, 261–273 Search PubMed.
- I. Kamphuis, J. Drenth and E. Baker, J. Mol. Biol., 1985, 182, 317–329 CrossRef CAS.
- W. P. Jencks, Catalysis in Chemistry and Enzymology, Dover Edition Mc-GrawnHill, New York, 1987, ch. 2 Search PubMed.
- (a) W. P. Jencks and J. Carriuolo, J. Am. Chem. Soc., 1960, 82, 1778–1786 CrossRef CAS; (b) W. P. Jencks and J. Carriuolo, J. Am. Chem. Soc., 1960, 82, 675–681 Search PubMed.
- D. J. Hupe and W. P. Jencks, J. Am. Chem. Soc., 1977, 99, 451–464 CrossRef CAS.
- E. R. Pohl, D. Wa and D. J. Hupe, J. Am. Chem. Soc., 1980, 102, 2759–2763 CrossRef CAS.
- T. C. Bruice and R. Lapinski, J. Am. Chem. Soc., 1958, 80, 2265–2267 CrossRef CAS.
- G. R. Schonbaum and M. L. Bender, J. Am. Chem. Soc., 1960, 82, 1900–1904 CrossRef CAS.
- S. L. Shames and L. D. Byers, J. Am. Chem. Soc., 1981, 103, 6170–6177 CrossRef CAS.
- J. W. Keillor and R. S. Brown, J. Am. Chem. Soc., 1992, 114, 7983–7989 CrossRef CAS.
- B. A. Kellogg, A. A. Neverov, A. M. Aman and R. S. Brown, J. Am. Chem. Soc., 1996, 118, 10829–10837 CrossRef CAS.
- D. Samid, S. Shack and L. T. Sherman, Cancer Res., 1992, 52, 1988–1992 CAS.
- P. Prasanna, S. Shack, V. L. Wilson and D. Samid, Clin. Cancer Res., 1995, 1, 865–871 CAS.
- J. Loscalzo, D. Smicd, N. Andon and J. Cooke, J. Pharmacol. Exp. Ther., 1989, 249, 726–729 CAS.
- A. Sexto and E. Iglesias, Org. Biomol. Chem., 2011, 9, 7207–7216 CAS.
- E. Iglesias and A. Sexto, Supramol. Chem., 2014, 26, 111–118 CrossRef CAS PubMed.
- O. S. Tee and B. K. Takasaki, Can. J. Chem., 1985, 63, 3540–3544 CrossRef CAS.
- M. N. Khan, J. Colloid Interface Sci., 1995, 170, 598–601 CrossRef CAS.
- (a) M. Ferrit, C. del Valle and F. Martínez, Eur. J. Pharm. Sci., 2007, 31, 211–220 CrossRef CAS PubMed; (b) M. Ferrit, C. del Valle and F. Martínez, Colloids Surf., A, 2009, 345, 26–30 CrossRef CAS PubMed.
- A. R. Fersht and A. J. Kirby, J. Am. Chem. Soc., 1967, 89, 4857–4863 CrossRef CAS.
- T. J. Broxton, J. R. Christie and X. Sango, J. Org. Chem., 1987, 52, 4814–4817 CrossRef CAS.
- M. S. Gill, A. A. Neverov and R. S. Brown, J. Org. Chem., 1997, 62, 7351–7357 CrossRef CAS PubMed.
- R. S. Brown and A. Aman, J. Org. Chem., 1997, 62, 4816–4820 CrossRef CAS.
- I. Brandariz and E. Iglesias, Colloids Surf., A, 2014, 454, 180–188 CrossRef CAS PubMed , and references therein.
- M. N. Khan, Micellar Catalysis. Surfactant Science Series, Taylor & Francis Group, 2007, vol. 133, ch. 3 and references therein Search PubMed.
- C. A. Bunton, Micellar rate effects: what we know and what we think we know, in Surfactants in Solution, ed. K. L. Mittal and D. O. Shah, Plenum, New York, 1991, vol. 11, pp. 17–40 Search PubMed.
- V. Gold, D. G. Oakenfull and T. Riley, J. Chem. Soc. B, 1968, 515–519 RSC.
Footnote |
| † Electronic supplementary information (ESI) available: Fig. S1 to S7 and Table S1 are included. See DOI: 10.1039/c5ra06900a |
| This journal is © The Royal Society of Chemistry 2015 |

