
 Open Access Article
 This Open Access Article is licensed under a
 Creative Commons Attribution 3.0 Unported Licence
Tailoring the surface charge of dextran-based polymer coated SPIONs for modulated stem cell uptake and MRI contrast†
Michael
Barrow‡
a,
Arthur
Taylor‡
b,
Daniel J.
Nieves
c,
Lara K.
Bogart
c,
Pranab
Mandal
a,
Christopher M.
Collins
a,
Lee R.
Moore
d,
Jeffrey J.
Chalmers
e,
Raphaël
Lévy
c,
Steve R.
Williams
f,
Patricia
Murray
b,
Matthew J.
Rosseinsky
*a and
Dave J.
Adams
*a
aDepartment of Chemistry, University of Liverpool, Liverpool, UK. E-mail: d.j.adams@liverpool.ac.uk
bInstitute of Translational Medicine, University of Liverpool, Liverpool, UK
cInstitute of Integrative Biology, University of Liverpool, Liverpool, UK
dCleveland Clinic, Cleveland, Ohio, USA
eDepartment of Chemical and Biomolecular Engineering, The Ohio State University, Ohio, USA
fCentre for Imaging Science, University of Manchester, Manchester, UK
First published on 26th February 2015
Abstract
Tracking stem cells in vivo using non-invasive techniques is critical to evaluate the efficacy and safety of stem cell therapies. Superparamagnetic iron oxide nanoparticles (SPIONs) enable cells to be tracked using magnetic resonance imaging (MRI), but to obtain detectable signal cells need to be labelled with a sufficient amount of iron oxide. For the majority of SPIONs, this can only be obtained with the use of transfection agents, which can adversely affect cell health. Here, we have synthesised a library of dextran-based polymer coated SPIONs with varying surface charge from −1.5 mV to +18.2 mV via a co-precipitation approach and investigated their ability to be directly internalised by stem cells without the need for transfection agents. The SPIONs were colloidally stable in physiological solutions. The crystalline phase of the particles was confirmed with powder X-ray diffraction and their magnetic properties were characterised using SQUID magnetometry and magnetic resonance. Increased surface charge led to six-fold increase in uptake of particles into stem cells and higher MRI contrast, with negligible change in cell viability. Cell tracking velocimetry was shown to be a more accurate method for predicting MRI contrast of stem cells compared to measuring iron oxide uptake through conventional bulk iron quantification.
Introduction
Stem cell-based regenerative medicine therapies (RMTs) are of great potential to treat a wide range of conditions owing to their ability to promote regeneration of host tissue.1,2 To evaluate safety and efficacy of stem cell therapies, it is necessary to monitor the fate of stem cells in vivo using non-invasive imaging techniques such as magnetic resonance imaging (MRI). MR-based cell tracking requires the cells of interest to be labelled with a contrast agent prior to administration, thus allowing them to be discriminated from the host cells.3,4 Superparamagnetic iron oxide nanoparticles (SPIONs) are ideal candidates as MRI contrast agents as they only become magnetised under the influence of an external magnetic field and are often preferred over metal lanthanide complexes for biocompatibility reasons and increased paramagnetism per mole of metal ion.5To utilise SPIONs for cell tracking, particles require sufficient colloidal stability in physiologically relevant media such as a pH buffer for storage and cell culture media for incubation and labelling of cells.6 There are examples of SPIONs that are soluble in aqueous buffers at various pH and ionic strength, yet aggregate in cell culture medium.7–9 When particles are placed into cell culture medium, a ‘protein corona’ forms that is specific to the nature and charge of the particle coating.4,10 Whilst there are more studies emerging focussing on the composition of the protein corona for particular systems,11,12 it remains difficult to predict and could be key to particle stabilisation. Polymers are widely investigated as coatings for iron oxide particles,6,13,14 and do prevent aggregation in cell medium at high polymer to iron oxide ratios.15,16
Dextran, a biocompatible polysaccharide, consisting of α-1,6 linked D-glucose is the most widely used coating for SPIONs for stem cell labelling in vitro and in vivo.17,18 In particular, the two clinically approved SPION based contrast agents were both based on dextran (Endorem™ UK and Resovist®). They were both removed from the market in 2009.5 These products were not initially developed as contrast agents for stem cell labelling and were therefore not optimised for cell uptake. To increase uptake, a post-modification step is required,19,20 or use of transfection agents21,22 which can sometimes be toxic.23 The use of polycation coatings is starting to become more popular as they facilitate uptake through binding to the cell-membrane.5,9,24 It is still not well understood if the positive charge leads directly to uptake, or if the positive charge incorporates more specific proteins into the corona that can then lead to uptake.
Whilst polycations have been shown to increase uptake, like transfection agents, they can also be toxic.25 In addition, there are reports that some SPIONs, including dextran coated particles,26 can cause toxicity at high labelling quantities due to oxidative stress. This is thought to be due to a by-product of iron oxide breakdown at physiological pH and in some cases this has been shown to be coating- or cell specific.26–28 There are now more studies emerging to address biological applications, focussing on synthesis, characterisation and surface properties of SPIONs.29 A different approach could be to tailor the surface charge of a polymer system for increased uptake in cells. This would enable the direct comparison between increased uptake and cell safety; it would also allow the determination of how much iron oxide is required within cells to obtain satisfactory MRI contrast.
Here, we report how the surface charge of SPIONs can be manipulated for increased uptake and MRI contrast of mesenchymal stem/stromal cells (MSCs). DEAE-Dextran was one of the first transfection agents used to transfer DNA/RNA into cells,30–32 but it has not previously been studied in detail as a SPION shell. In this study, we have used commercially available dextran/DEAE Dextran polymers to produce a range of dextran coated SPIONs with different charges. Internalisation of SPIONs into a mouse MSC cell line was investigated in parallel with the observed MRI contrast of cells after labelling.
Experimental
Materials
Fluorescein isothiocyanate diethylamino ethyl (FITC-DEAE)-Dextran (Mw 40![[thin space (1/6-em)]](https://www.rsc.org/images/entities/char_2009.gif) 000 Da), FITC-Dextran (Mw 40000 Da), dextran (from leuconostoc Mw 40000 Da), ferric chloride hexahydrate FeCl3·6(H2O) (ACS reagent, 97%), ferrous chloride tetrahydrate FeCl2·4(H2O) (reagentplus®, 98%), ammonia hydroxide solution (28–30%), Corning® Spin-X® (100k), sodium azide, and sephadex® G-100 were all purchased from Sigma Aldrich. Spectra/Por® Biotech cellulose ester (CE) dialysis membranes (MWCO: 100000) were purchased from Fisher Scientific. Deionised water was used from a Milli-Q system (resistivity 15 MΩ cm at 25 °C). Millex GP syringe filters with a polyethersulfone (PES) 0.22 μm membrane were purchased from Fisher Scientific.
000 Da), FITC-Dextran (Mw 40000 Da), dextran (from leuconostoc Mw 40000 Da), ferric chloride hexahydrate FeCl3·6(H2O) (ACS reagent, 97%), ferrous chloride tetrahydrate FeCl2·4(H2O) (reagentplus®, 98%), ammonia hydroxide solution (28–30%), Corning® Spin-X® (100k), sodium azide, and sephadex® G-100 were all purchased from Sigma Aldrich. Spectra/Por® Biotech cellulose ester (CE) dialysis membranes (MWCO: 100000) were purchased from Fisher Scientific. Deionised water was used from a Milli-Q system (resistivity 15 MΩ cm at 25 °C). Millex GP syringe filters with a polyethersulfone (PES) 0.22 μm membrane were purchased from Fisher Scientific.
Methods
000 Da) in 10 mL water was added to 0.03 g (1.1 × 10⁻⁴ mol) ferric chloride hexahydrate (FeCl3·6H2O) and 0.015 g (7.5 × 10⁻⁵ mol) ferrous chloride tetrahydrate (FeCl2·4H2O) in 15 mL water in a two necked flask fitted to a non-magnetic stirrer through an airtight connection. The flask was purged with nitrogen for 30 minutes and placed on ice. Whilst stirring at 200 rpm, 1 mL ammonium hydroxide (28–30%) was added dropwise over a period of 120 s. The mixture was then heated to 80 °C over a period of 15 minutes and held at 80 °C for 1 hour until the reaction was stopped.
| Sample | Amount of FITC-dextran (g) | Amount of dextran (g) | Amount of FITC-DEAE-dextran (g) |
|---|---|---|---|
| 0% DEAE-Dex | 0.2 | — | — |
| 25% DEAE-Dex | — | 0.15 | 0.05 |
| 50% DEAE-Dex | — | 0.1 | 0.1 |
| 75% DEAE-Dex | — | 0.05 | 0.15 |
| 100% DEAE-Dex | — | — | 0.2 |
After cooling to room temperature the reaction mixture was dialysed repeatedly using 100 K membrane until the particle solution reached pH 7. The particles were then passed through g100 Sephadex® beads using water as the mobile phase and spin-filtered 3 times using 15 mL water and spinning until 1 mL was left in the filter compartment. All particles were passed through a sterile 0.22 μm polyethersulfone syringe filter prior to cell labelling.
Cell tracking velocimetry measurements were performed with cells trypsinised, fixed with 4% formaldehyde, stained with 4′,6-diamidino-2-phenylindole (DAPI, Life Technologies) and suspended in 30% (v/v) glycerol. Data were acquired using a system based upon the instrument developed by Chalmers et al.36 Further details about the set-up can be found in the ESI.† Cytotoxicity was evaluated via the quantification of cell viability after labelling. For this purpose, 1 × 10⁶ cells were seeded in each well of a 96-well plate and labelled as previously described. After labelling, medium containing 10% CCK-8 reagent (Sigma) was added. After an incubation period of approximatively 3 h the absorbance at 450 nm was measured and compared to that of control (unlabelled) cells.
Characterisation
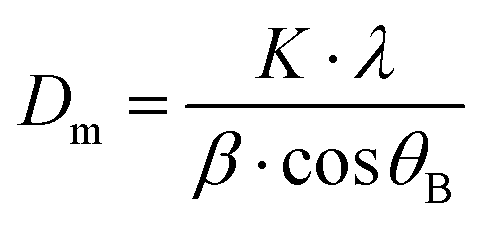
where K = shape factor (0.9),37λ = the wavelength of the cobalt source, β = full width half maximum measured at 2θB ≈ 41° – corresponding to the 311 planes and θB = the Bragg angle. Pawley refinement was performed using Topas academic software to compare the synthesised particles to a structural model.38,39 Lattice parameters were fixed to that of the known structure of Fe3O4
 40 with background, peak shape and zero error parameters refined.
For cell measurements, cells were trypsinised and fixed with 4% formaldehyde, resuspended in 40 μL of 1% low-melting temperature agarose and loaded into 100 μL polypropylene tubes between two layers of agarose containing no cells. The tubes were then mounted in fresh agarose and imaged longitudinally with a Turbo RARE T2-weighed sequence with the following parameters: field of view 30 × 30 mm, matrix 256 × 256, slice thickness 1.0 mm, effective TE 33 ms, RARE factor 8, TR 2741.9, averages 4, flip angle 135, scan time 350 s. The relaxation time was obtained with the same sequence as used for free particles.
Results and discussion
The surface charge of SPIONs was manipulated by increasing the ratio of FITC-DEAE-Dextran to dextran in the co-precipitation synthesis (Table 1), increasing the overall amount of amine groups on the surface of SPIONs (Scheme 1). For this study, a modified co-precipitation synthesis protocol similar to that described by Molday33 and Paul,34 was employed. To obtain particles with a high coverage of polymer and satisfactory colloidal stability in cell medium, the mass to mass (m/m) polymer to iron salt ratio was adjusted to ∼4:1.8 To ensure a high proportion of magnetite, a 2:1 ratio (m/m) of FeCl3·6(H2O) and FeCl2·4(H2O) was chosen in line with previous studies reporting iron oxide cores containing more that 95% magnetite.41–43 For example, this ratio has been shown to lead to pure magnetite by Jiang et al. on the basis of XPS data.43 To study the relationship between surface charge, cell uptake and toxicity, it was important to remove any impurities after the synthesis such as free polymer and residual ammonium hydroxide.
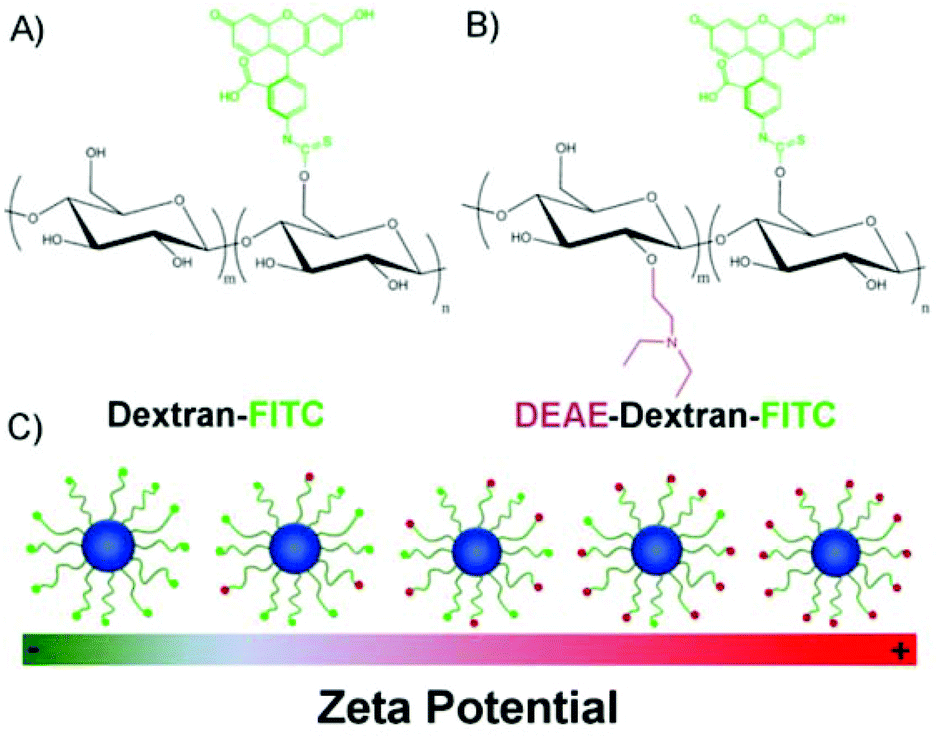 | ||
| Scheme 1 Chemical structure of polymers used to manipulate the surface charge of SPIONs. (A) FITC-conjugated dextran, (B) FITC-conjugated DEAE-Dextran and (C) scheme representing the resulting SPIONs. | ||
To this end, the particles were first dialysed until the particle solution reached pH 7. The solution was then passed through dextran-based g100 sephadex® size exclusion beads to separate any excess free polymer. Spin filters were employed to provide an extra washing step; this method was preferred over normal centrifugation to avoid complete sedimentation of particles which hinders redispersion. All SPIONs were passed through a sterile 0.22 μm polyethersulfone (PES) membrane to remove any potential microbial contamination prior to administering to cells. Systematic variation of the dextran ratio led to a range of SPIONs with increasing positive charge. As the percentage DEAE-Dextran content in the polymer mixture is increased from 0 to 100%, the zeta potential increases from −1.5 mV to 18.2 mV (Table 2). There is a progressive shift in the distribution of zeta potential as the amount in DEAE-Dextran is increased (Fig. 1). The hydrodynamic diameters (Z-Avg) in 0.01 M NaCl and phosphate buffered saline (PBS) were all less than 50 nm (Fig. S1, Tables S1&2†), and whilst there are slight differences in Z-Avg and core size, this is expected when using different polymer systems which may have different affinities for precipitating nanoparticles.8 The particles were imaged by TEM (Fig. S2†) and the average core size was calculated using the Scherrer equation by measuring the full width half maximum (FWHM) of the 311 reflection from the pXRD patterns of SPIONs (Fig. S3†). This method was selected to reduce error arising from a noisy baseline, a characteristic corresponding to high percentage polymer content.15 A Pawley refinement on the sample containing 0% DEAE-Dextran was used to show that the resulting patterns were in agreement with the known patterns of magnetite (Fig. S4†). The percentage polymer content was determined using thermogravimetric analysis (TGA). The percentage mass loss between 120 °C and 1000 °C was attributed to loss of polymer, and any remaining material after the heating cycle was quantified as iron oxide (Fig. S5†). In all cases, there was no polymer remaining above 400 °C. Using a polymer to iron salt ratio (m/m) slightly above 4:1 for the co-precipitation resulted in samples containing between 85–92% polymer.
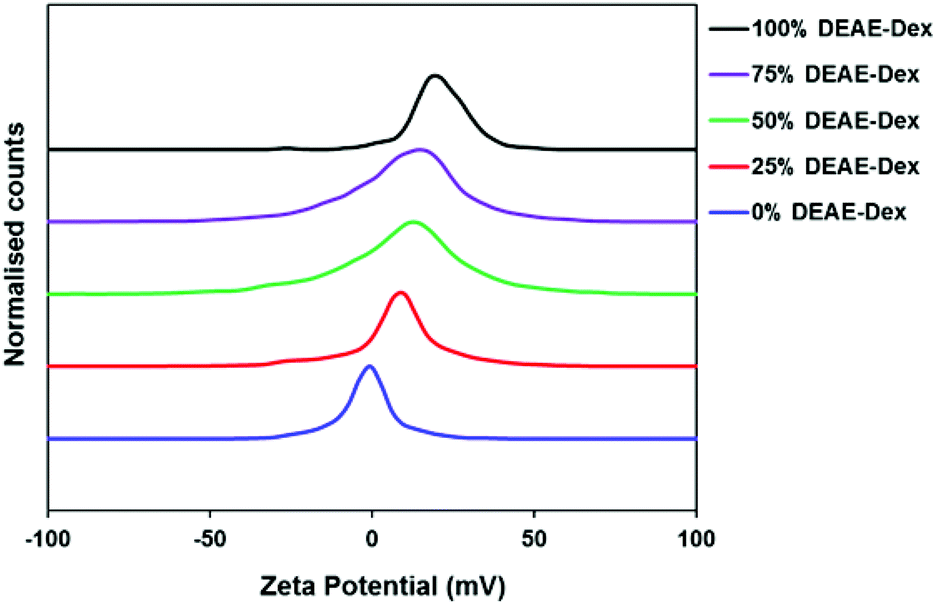 | ||
| Fig. 1 Apparent zeta potentials of SPIONs with varying amounts of DEAE-Dextran. The peak-maxima were all normalised for clarity. | ||
| Sample | Z-Avg (DLS) | Surface charge (Zeta potential) | Mean core size (XRD) | Polymer content (TGA) |
|---|---|---|---|---|
| 0% DEAE-Dex | 28.1 nm | −1.5 mV | 6.0 nm | 90.1% |
| 25% DEAE-Dex | 29.8 nm | +8.1 mV | 4.8 nm | 88.5% |
| 50% DEAE-Dex | 44.8 nm | +9.1 mV | 6.4 nm | 87.7% |
| 75% DEAE-Dex | 49.8 nm | +9.7 mV | 6.4 nm | 92.0% |
| 100% DEAE-Dex | 27.0 nm | +18.2 mV | 6.7 nm | 85.2% |
We used a high polymer/iron salt ratio so the samples would be colloidally stable in both PBS and cell culture media. Dextran has groups that can bind to iron oxide through functional groups within the whole polymer; some researchers have proposed a wrapping conformation of polymer around the iron oxide core.6 One issue with this model is that it is fairly certain that all of the polymer chains will not be bound in exactly the same conformation and having control over this would be extremely difficult. The thick layer is likely a combination of different conformations of polymer around the iron oxide surface but also polymer swelling as we are measuring hydrodynamic diameter using DLS.
The library of particles was tested for colloidal stability in PBS and DMEM containing 10% FCS. SPIONs were dispersed into the corresponding media at a concentration of 50 μg mL−1 of iron and incubated at 37 °C. The absorbance at 400 nm was measured over a period of 14 days as a measure of particle stability. This is possible given that particle instability and aggregation results in their sedimentation at the bottom of the cuvette, thus leading to a decreased absorbance at the optical path. No change in the absorbance intensity was observed for solutions prepared with each of the SPION samples in either media (Fig. 2A and B). When the absorbance values were normalised to the values obtained at 0 days there was very little variation observed over a period of two weeks.
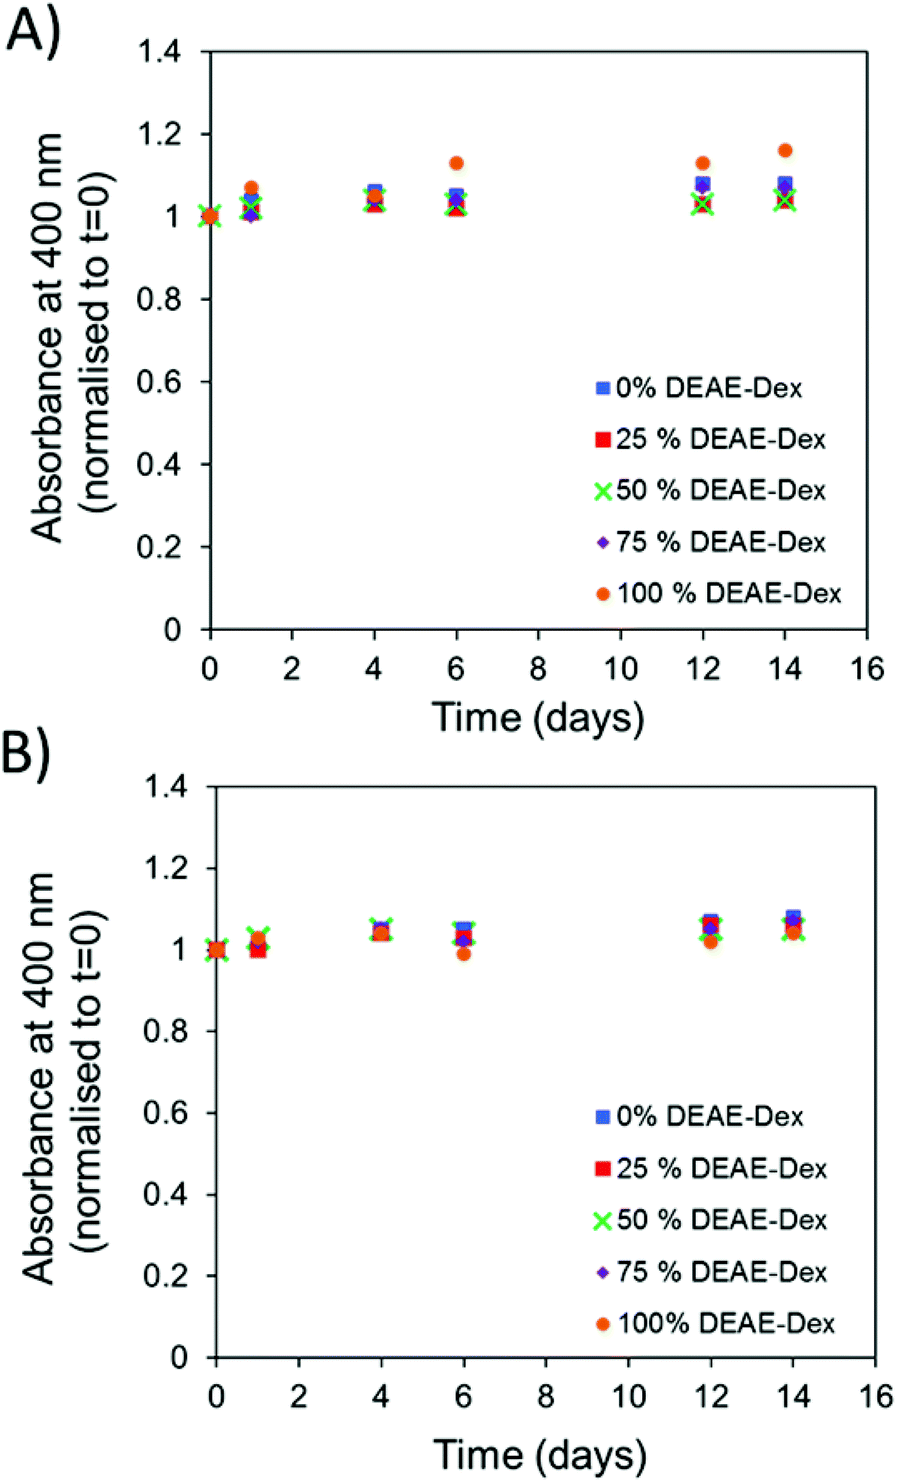 | ||
| Fig. 2 Absorbance of SPIONs (50 μg ml−1 [Fe]) at 400 nm which were incubated at 37 °C over a period of t = 14 days and normalised to t = 0 in (A) PBS and (B) DMEM + FCS. | ||
This data demonstrates that the polymer-coated SPIONs are colloidally stable for cell labelling (usually 24 h or less). Furthermore, the presence of serum does not affect their colloidal stability. This satisfies an important requirement since specialised media containing serum and/or additional growth factors is necessary for the maintenance of stem cell phenotype (Fig. S6†).
Fig. 3 compares the magnetic response of the particles series. There is an agreement between particle relaxivity at 7 T and the measured magnetisation at 2 T (raw data are presented in Fig. S7 & S8†). The images at the top of Fig. 3 correspond to the particles as obtained with a RARE sequence at an echo time of 33 ms and a repetition time of 5000 ms, evidencing the stronger negative contrast obtained for the SPIONs with the highest relaxivity. Previous studies have shown a correlation between the core size of SPIONs and their magnetisation and relaxivity, but it is also accepted that grafting density of the shell can affect these properties.4,8 For this particular system, we have observed a significant decrease in core size when using 25% DEAE-Dextran that was correlated with a decrease in magnetisation at 2 T and relaxivity at 7 T. For all other samples, magnetisation at 2 T was close to 110 emu g−1 [Fe] and the relaxivity was over 85 mM−1 s−1. When contrast generation is considered, however, one must take into account that once SPIONs are internalised, the relaxivity can be dramatically decreased.44,45 It is therefore necessary to optimise SPION uptake in order to maximise cell contrast.
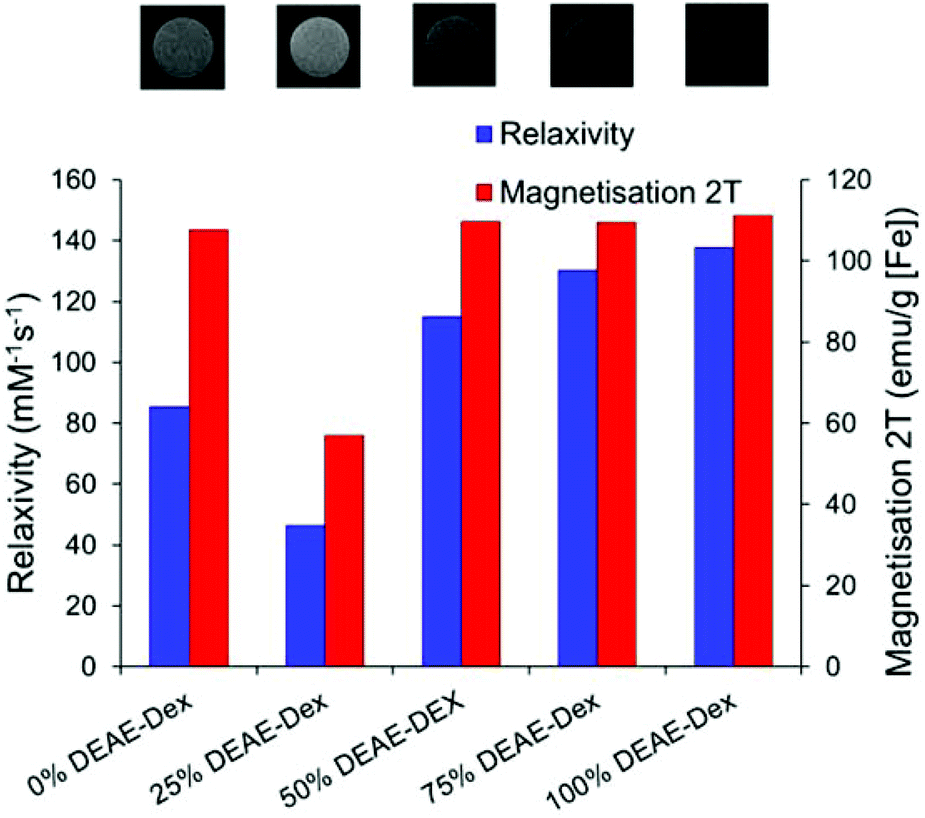 | ||
| Fig. 3 Magnetic properties of SPIONs produced with varying ratios of DEAE-Dextran and (above) magnetic resonance image of 0.25 mM [Fe] of each sample suspended in agarose gel as obtained with a RARE sequence at 7 T (TE: 33 ms, TR: 5000 ms, RARE FACTOR: 2). | ||
Flow cytometry was used as a high throughput method to qualitatively assess the uptake of the different SPIONs by stem cells, as evaluated by changes in the side-scattered light. The side-scatter indicates the granularity of the cells and this is a useful technique for monitoring particle uptake, because the degree of granularity will be dependent on the extent of particle uptake (Fig. S9†).46 In Fig. 4A, the mean intensity of the side-scattered light is plotted as a function of labelling concentration. The uptake after a 24 h labelling time increased with the proportion of DEAE-Dextran. For the following studies, a nominal labelling concentration of 50 μg mL−1 [Fe basis] was used.
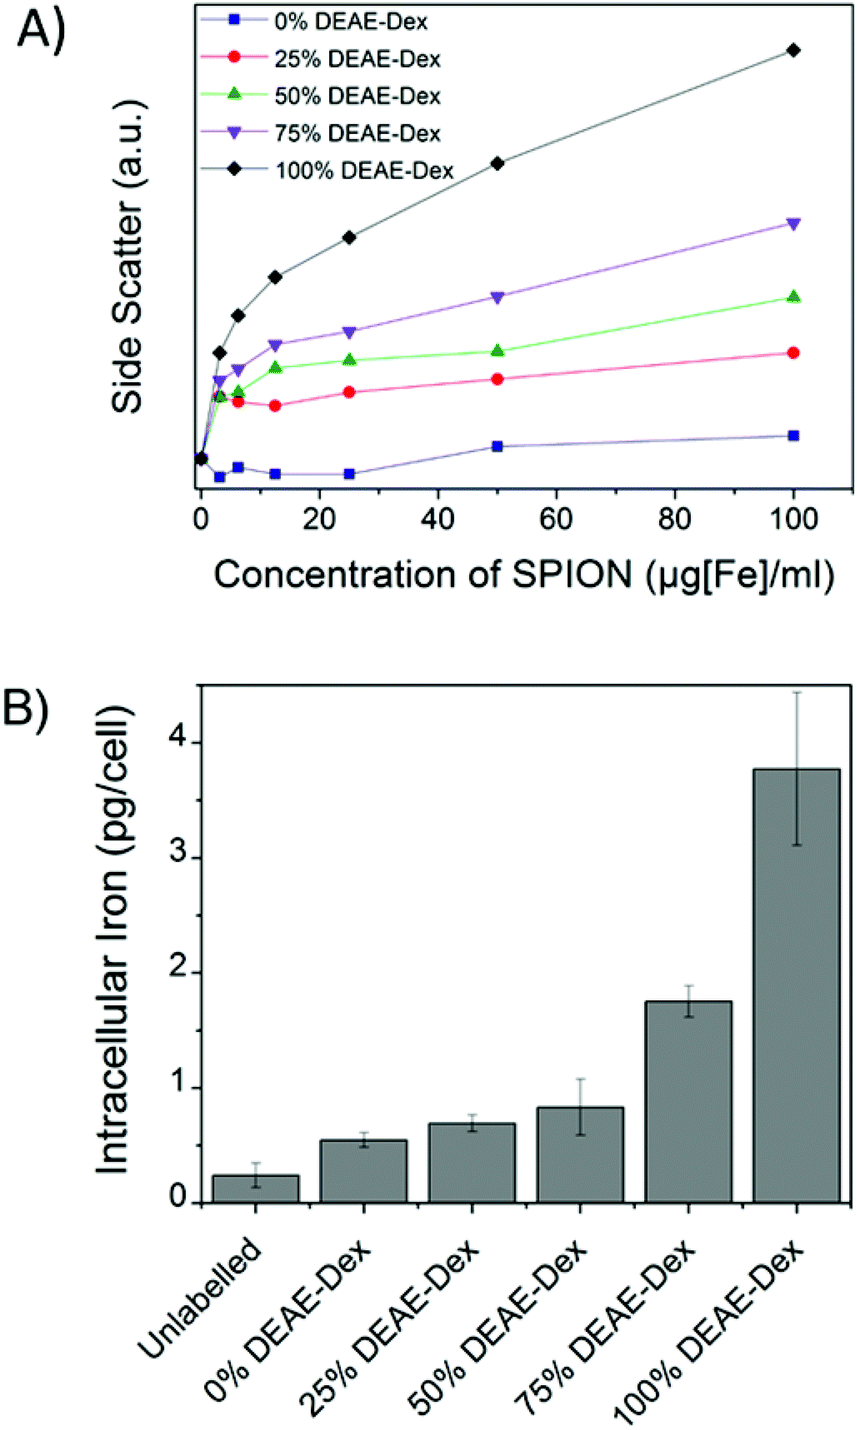 | ||
| Fig. 4 (A) Mean side scatter (cell granularity) obtained via flow cytometry of cells labelled for 24 h with different concentrations of each SPION. The degree of granularity is dependent on the extent of nanoparticle uptake. (B) Intracellular iron content of cells labelled for 24 h with 50 μg ml−1 [Fe]. Error bars correspond to the SD from three independent measurements. | ||
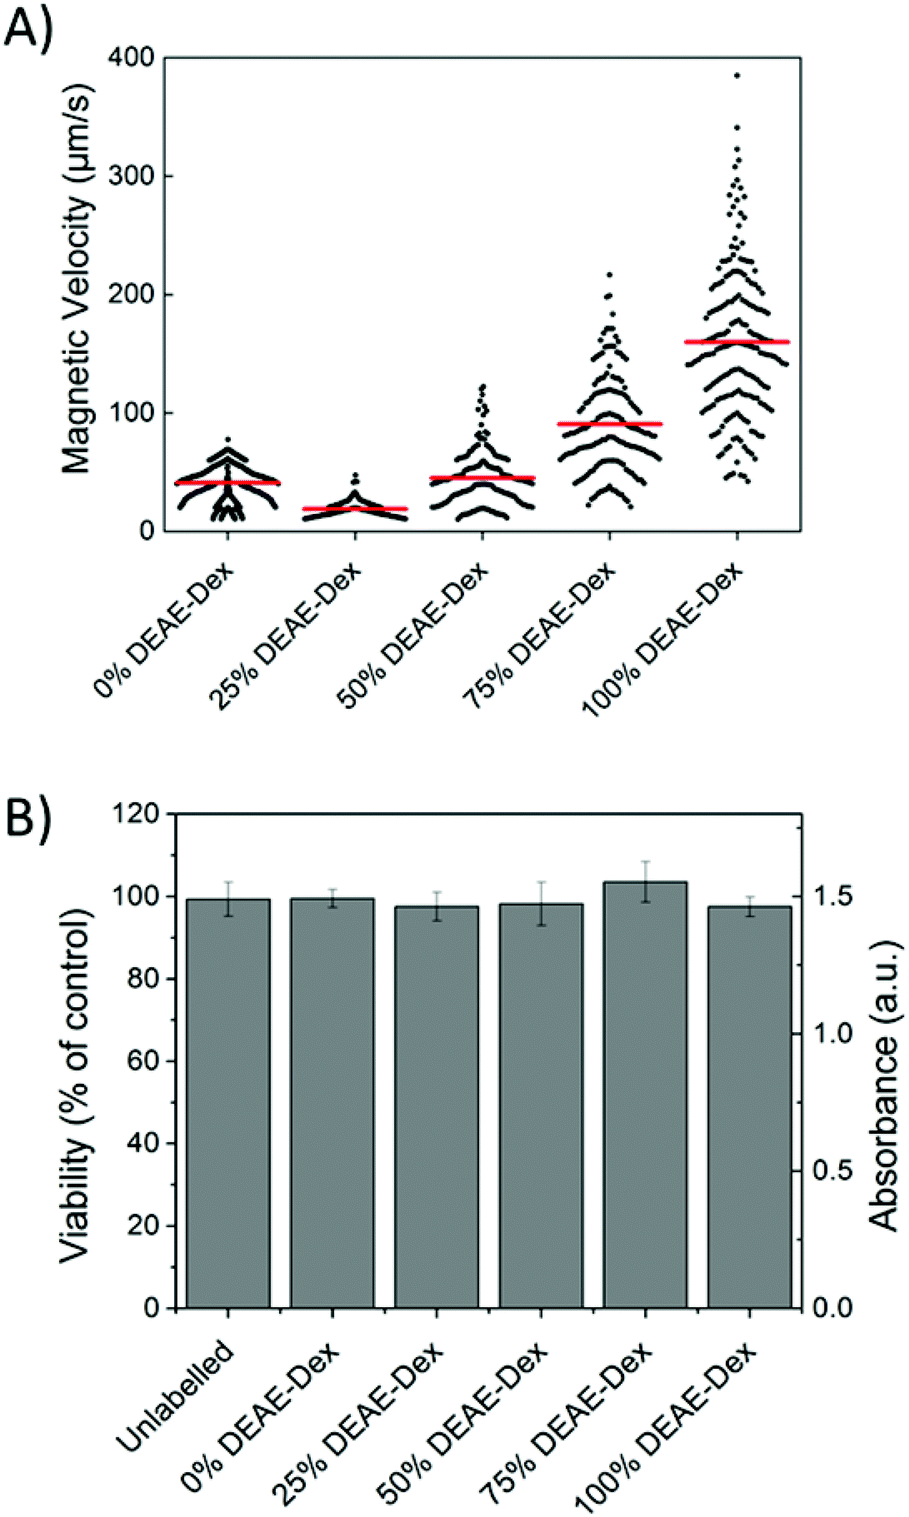
The quantification of intracellular iron content revealed a steady increase in the uptake of SPIONs (Fig. 4B) that correlates with their zeta potential and is in agreement with the data obtained via flow cytometry. Importantly, there was a 6-fold increase in the intracellular iron content of cells labelled with 100% DEAE-Dextran SPIONs as compared with cells labelled with 0% DEAE-Dextran (measured with a ferrozine-based colorimetric method; 3.8 ± 0.7 pg per cell vs. 0.6 ± 0.1 pg per cell). These results clearly show that control of uptake can be achieved through manipulation of surface charge. To examine the magnetic properties of labelled cells at a single cell level, we have measured the velocities of individual cells in a magnetic field gradient. This technique (cell tracking velocimetry (CTV) or magnetophoresis) allows for a more clear understanding on the distribution of uptake within a population of cells. Fixed cells are exposed to a magnetic field gradient and their migration towards the area with the highest magnetic field strength is imaged, from which their magnetic velocity can be obtained.36,47Fig. 5A shows how the magnetic velocity increases when MSCs are labelled with the SPIONs containing an increasing amount of DEAE within the shell. From the results, one can clearly observe that there is a wide distribution of uptake within each of the conditions, which is not evident when performing bulk colorimetric measurements as presented in Fig. 4B.
 | ||
| Fig. 5 (A) The magnetic velocity of cells labelled for 24 h with 50 μg ml−1 [Fe]. Data was acquired from a minimum of 100 cells for each condition. Horizontal (red) bars indicate the mean magnetic velocity of the population. (B) Cell viability of cells labelled for 24 h with 50 μg ml−1 [Fe]. Error bars correspond to the absorbance SD obtained from three independent measurements. | ||
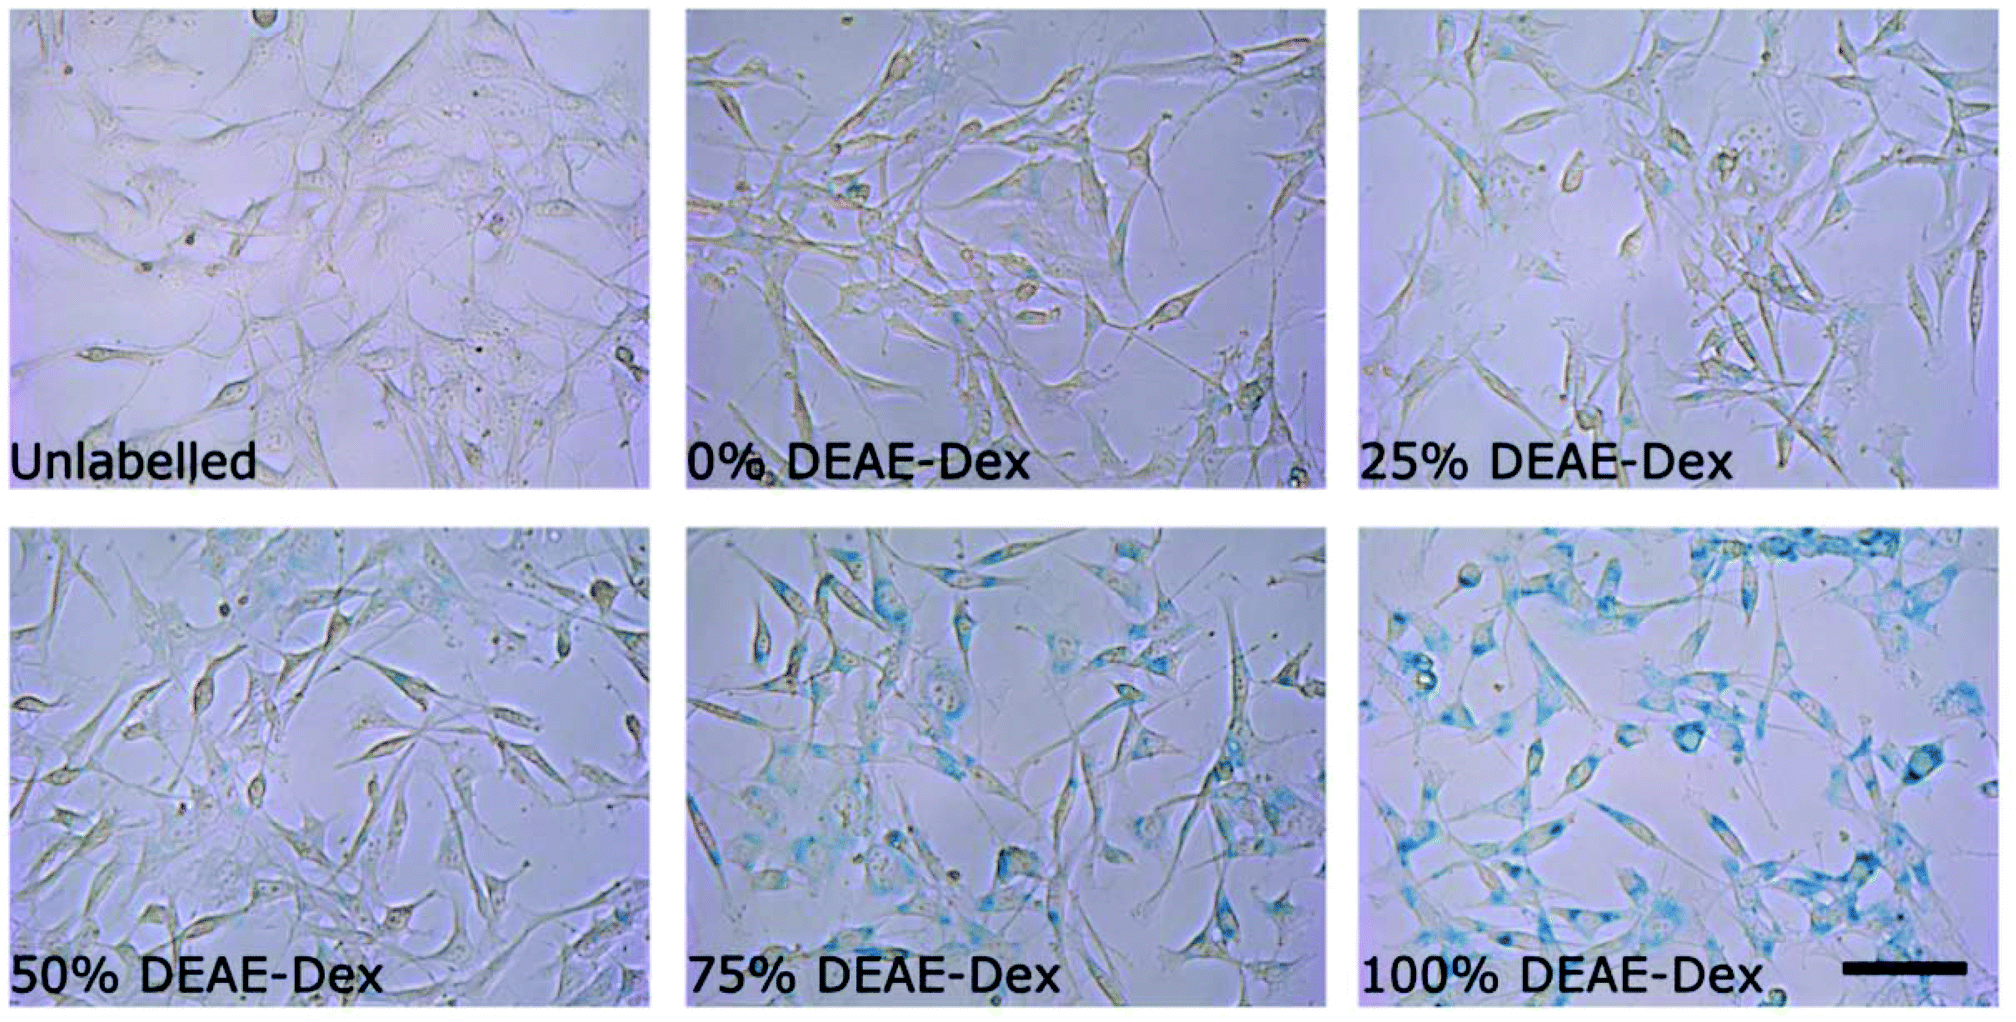
Interestingly, cells labelled with SPIONs synthesised with 25% DEAE-Dextran exhibit a magnetic velocity that is lower than cells labelled with SPIONs produced with 0% DEAE-Dextran, although colorimetric assays showed a higher intracellular amount of iron. This is attributed to the intrinsic lower magnetisation of those SPIONs, as shown by the measurements at 2 T (Fig. 3). This highlights the benefits of this technique as it is sensitive not only to the bulk amount of iron taken up by cells, but also the cell's magnetisation, which arises from SPION uptake and their physical properties.48 Importantly, we have not seen any changes in cell viability when cells were labelled with the different SPIONs (Fig. 5B), suggesting no cytotoxic effects originating from these materials at the concentrations and timescale studied here. The iron-specific Prussian blue staining (Fig. 6) displays a typical perinuclear staining confined to the intracellular space only, without evidence of any extracellular aggregates, as expected from the colloidal stability of these SPIONs in cell medium. The staining intensity is correlated to the amount of DEAE-Dextran present in the samples, and in agreement with the intracellular iron quantification, that is, a weak staining for samples labelled with particles synthesised with 0, 25 or 50% DEAE-Dextran and a more intense staining for samples synthesised with 75 and 100% DEAE-Dextran. Importantly, no changes in cell morphology and/or proliferation are seen for the labelled cells. The enhanced uptake for positively charged SPIONs was also observed for mouse and human kidney derived stem/progenitor cells (KSPCs) (Fig. S10†). To assess whether SPION labelling was effective as a means to generate contrast using magnetic resonance, cells labelled with each of the SPIONs were imaged via MRI using a T2-weighed sequence. Fig. 7A presents images of tubes containing three layers of agarose, were the middle layer contains 3 × 10⁵ labelled cells. A negative contrast is observed for cells that have been labelled with SPIONs in respect to control (unlabelled) cells. This is most evident for those containing 75% and 100% of DEAE-Dextran, reflecting their higher uptake. SPIONs generate contrast by reducing the T2 relaxation time. The relaxation time of all labelled cells was shorter than that of control (unlabelled cells) as plotted in Fig. 7B. The decay in relaxation time is proportional to the amount of SPIONs taken up, with the exception of cells labelled with the samples containing 25% DEAE-Dextran.
 | ||
| Fig. 6 Prussian blue staining images of cells labelled for 24 h with 50 μg ml−1 [Fe] of each sample of SPIONs. Scale bar corresponds to 25 μm. | ||
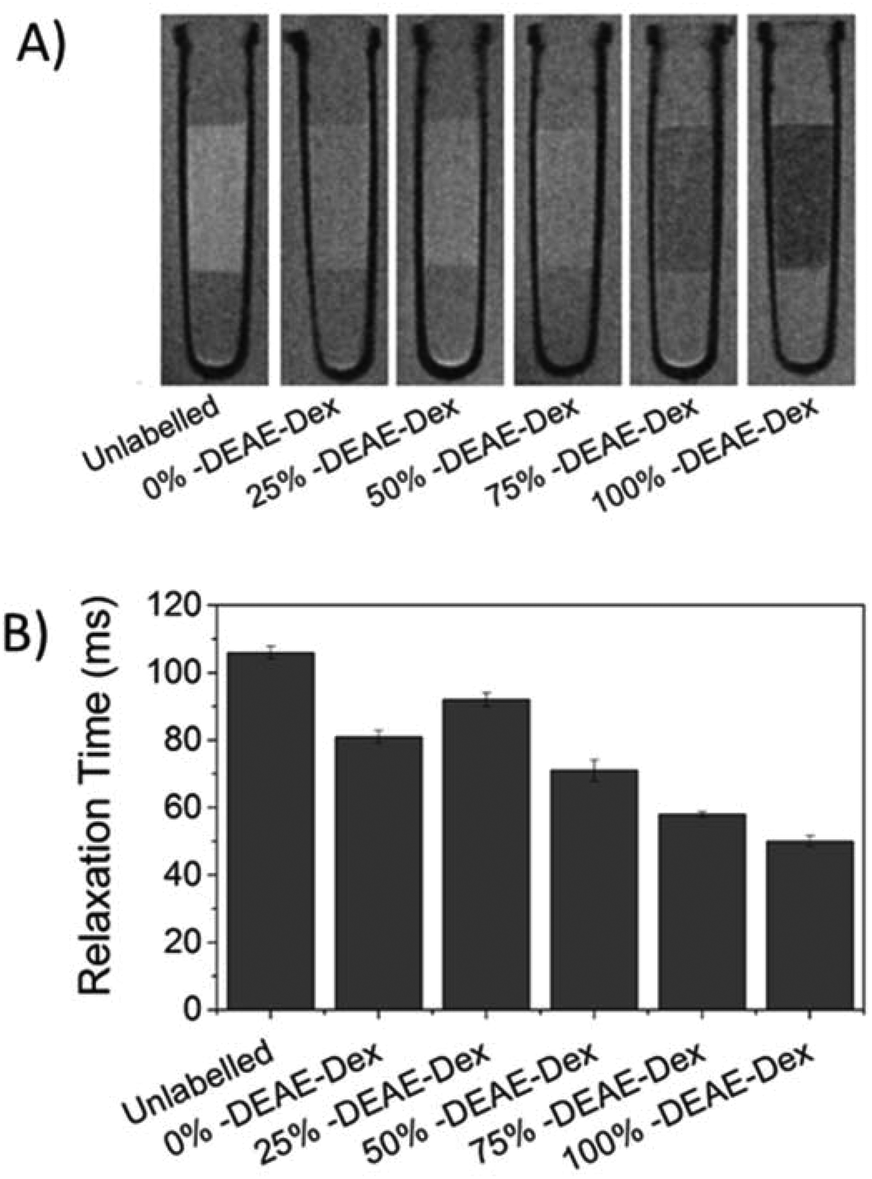 | ||
| Fig. 7 (A) 7 T MR scan of 3 × 10⁵ MSCs suspended in a 40 μl agarose phantom, after 24 h labelling with 50 μg ml−1 [Fe] of each SPION (images as obtained with a RARE sequence). (B) Relaxation times of the region of interest containing the cells. Error bars represent the standard deviation. | ||
This is likely to be a consequence of lower saturation magnetisation measured for these SPIONs (Fig. 3), and is also consistent with the reduced mean magnetic velocity (Fig. 5A). The magnetically induced cell velocity, as well as relaxation, is largely determined by the saturation magnetisation of the SPIONs, whereas the nominal iron measurements as obtained via colorimetric methods do not probe the magnetic response. We thus suggest that when comparing cells labelled with magnetic materials that might have substantial differences in their magnetic properties, CTV is a better proxy for predicting cell MRI contrast than the nominal uptake of iron. This is the first time magnetophoretic mobility of cells has been correlated with their MRI contrast.
Conclusions
To study the effect of surface charge, focussing on one variety and molecular weight of polymer is important as cellular uptake of SPIONs have been shown to be both coating and charge dependant. We have synthesised a series of colloidally stable SPIONs with surface charges ranging from −1.5 mV to +18.2 mV using commercially available 40000 Da dextran polymers in a co-precipitation approach. We have demonstrated that manipulating the surface charge by varying the amine content within the polymer coating can give a degree of control over stem cell uptake. The most positively charged SPIONs provided a 6-fold uptake in MSCs with respect to neutral dextran and this was also observed for other stem cells. Importantly, magnetophoretic mobility of cells was shown to accurately predict the resultant MRI contrast of stem cells after labelling compared to other characterisation methods, as it is sensitive to both uptake and magnetisation of individual cells. We acknowledge that DEAE-Dextran is not clinically approved and may face the same hurdles as other polymer coatings prior to its use in the clinic. However, the functionalisation strategy presented here allows for control of safe uptake into stem cells, which is a requirement before its clinical assessment.
Acknowledgements
George Miller is thanked for ICP measurements for concentration determination of iron. Maciej Zborowski is thanked for providing the magnet for the CTV instrument. This work was supported by the UK EPSRC (grant EP/H046143) and the UK Regenerative Medicine Platform Safety and Efficacy Hub (MR/K026739/1). The support of BBSRC is acknowledged for funding the 7 T MRI console used in this work (BB/F011350/1).Notes and references
- S. M. Cromer Berman, P. Walczak and J. W. M. Bulte, Wiley Interdiscip. Rev.: Nanomed. Nanobiotechnol., 2011, 3, 343–355 CrossRef PubMed.
- R. Qiao, C. Yang and M. Gao, J. Mater. Chem., 2009, 19, 6274–6293 RSC.
- A. Taylor, K. M. Wilson, P. Murray, D. G. Fernig and R. Levy, Chem. Soc. Rev., 2012, 41, 2707–2717 RSC.
- L. H. Reddy, J. L. Arias, J. Nicolas and P. Couvreur, Chem. Rev., 2012, 112, 5818–5878 CrossRef CAS PubMed.
- L. Li, W. Jiang, K. Luo, H. Song, F. Lan, Y. Wu and Z. Gu, Theranostics, 2013, 3(8), 595–615 CrossRef PubMed.
- O. Veiseh, J. W. Gunn and M. Zhang, Adv. Drug Delivery Rev., 2010, 62, 284–304 CrossRef CAS PubMed.
- V. Hirsch, C. Kinnear, M. Moniatte, B. Rothen-Rutishauser, M. J. D. Clift and A. Fink, Nanoscale, 2013, 5, 3723–3732 RSC.
- J. S. Basuki, A. Jacquemin, L. Esser, Y. Li, C. Boyer and T. P. Davis, Polym. Chem., 2014, 5, 2611–2620 RSC.
- A. Petri-Fink, B. Steitz, A. Finka, J. Salaklang and H. Hofmann, Eur. J. Pharm. Biopharm., 2008, 68, 129–137 CrossRef CAS PubMed.
- W.-S. Cho, F. Thielbeer, R. Duffin, E. M. V. Johansson, I. L. Megson, W. MacNee, M. Bradley and K. Donaldson, Nanotoxicology, 2014, 8, 202–211 CrossRef CAS PubMed.
- U. Sakulkhu, M. Mahmoudi, L. Maurizi, J. Salaklang and H. Hofmann, Sci. Rep., 2014, 4 Search PubMed.
- U. Sakulkhu, M. Mahmoudi, L. Maurizi, G. Coullerez, M. Hofmann-Amtenbrink, M. Vries, M. Motazacker, F. Rezaee and H. Hofmann, Biomater. Sci., 2015, 3, 265–278 RSC.
- C. Boyer, M. R. Whittaker, V. Bulmus, J. Liu and T. P. Davis, NPG Asia Mater., 2010, 2, 23–30 CrossRef.
- K. Yan, P. Li, H. Zhu, Y. Zhou, J. Ding, J. Shen, Z. Li, Z. Xu and P. K. Chu, RSC Adv., 2013, 3, 10598–10618 RSC.
- J. S. Basuki, A. Jacquemin, L. Esser, Y. Li, C. Boyer and T. P. Davis, Polym. Chem., 2014, 5, 2611–2620 RSC.
- D. L. J. Thorek and A. Tsourkas, Biomaterials, 2008, 29, 3583–3590 CrossRef CAS PubMed.
- L. K. Bogart, A. Taylor, Y. Cesbron, P. Murray and R. Lévy, ACS Nano, 2012, 6, 5961–5971 CrossRef CAS PubMed.
- C. Tassa, S. Y. Shaw and R. Weissleder, Acc. Chem. Res., 2011, 44, 842–852 CrossRef CAS PubMed.
- M. Song, W. K. Moon, Y. Kim, D. Lim, I.-C. Song and B.-W. Yoon, Korean J. Radiol., 2007, 8, 365–371 CrossRef.
- M. M. Lin, S. Li, H.-H. Kim, H. Kim, H. B. Lee, M. Muhammed and D. K. Kim, J. Mater. Chem., 2010, 20, 444–447 RSC.
- A. Solanki, J. D. Kim and K.-B. Lee, Nanomedicine, 2008, 3, 567–578 CrossRef CAS PubMed.
- Y.-q. Ke, C.-c. Hu, X.-d. Jiang, Z.-j. Yang, H.-w. Zhang, H.-m. Ji, L.-y. Zhou, Y.-q. Cai, L.-s. Qin and R.-x. Xu, J. Neurosci. Methods, 2009, 179, 45–50 CrossRef PubMed.
- K. Kiefer, J. Clement, P. Garidel and R. Peschka-Süss, Pharm. Res., 2004, 21, 1009–1017 CrossRef CAS.
- J.-i. Jo, I. Aoki and Y. Tabata, J. Controlled Release, 2010, 142, 465–473 CrossRef CAS PubMed.
- S. K. Samal, M. Dash, S. Van Vlierberghe, D. L. Kaplan, E. Chiellini, C. van Blitterswijk, L. Moroni and P. Dubruel, Chem. Soc. Rev., 2012, 41, 7147–7194 RSC.
- C. C. Berry, S. Wells, S. Charles and A. S. G. Curtis, Biomaterials, 2003, 24, 4551–4557 CrossRef CAS.
- N. Singh, G. J. S. Jenkins, R. Asadi and S. H. Doak, Nano Rev., 2010, 1, 5358 Search PubMed.
- M. Mahmoudi, H. Hofmann, B. Rothen-Rutishauser and A. Petri-Fink, Chem. Rev., 2011, 112, 2323–2338 CrossRef PubMed.
- M. P. Calatayud, B. Sanz, V. Raffa, C. Riggio, M. R. Ibarra and G. F. Goya, Biomaterials, 2014, 35, 6389–6399 CrossRef CAS PubMed.
- A. Vaheri and J. S. Pagano, Virology, 1965, 27, 434–436 CrossRef CAS.
- P. G. Rigby, Nature, 1969, 221, 968–969 CrossRef CAS.
- J. H. McCutchan and J. S. Pagano, J. Natl. Cancer Inst., 1968, 41, 351–357 CAS.
- R. S. Molday and D. Mackenzie, J. Immunol. Methods, 1982, 52, 353–367 CrossRef CAS.
- K. G. Paul, T. B. Frigo, J. Y. Groman and E. V. Groman, Bioconjugate Chem., 2004, 15, 394–401 CrossRef CAS PubMed.
- W. W. fish, in Methods in Enzymology, ed. B. L. V. James and F. Riordan, Academic Press, 1988, pp. 357–364 Search PubMed.
- J. J. Chalmers, Y. Zhao, M. Nakamura, K. Melnik, L. Lasky, L. Moore and M. Zborowski, J. Magn. Magn. Mater., 1999, 194, 231–241 CrossRef CAS.
- A. Monshi, Modified Scherrer Equation to Estimate More Accurately Nano-Crystallite Size Using XRD, Scientific Research Publishing, 2012 Search PubMed.
- A. A. Coelho, J. Appl. Crystallogr., 2003, 36, 86–95 CAS.
- A. Coelho, TOPAS Academic: General Profile and Structure Analysis Software for Powder Diffraction Data, Version 4.1, Bruker AXS, Karlsruhe, Germany, 2007 Search PubMed.
- M. Fleet, Acta Crystallogr., Sect. B: Struct. Crystallogr. Cryst. Chem., 1981, 37, 917–920 CrossRef.
- S. Ko, H. Liu, J. Wu and Y. Kim, in Magnetics Conference, 2006. INTERMAG 2006. IEEE International, 2006, pp. 744–744.
- J.-H. Wu, S. P. Ko, H.-L. Liu, S. Kim, J.-S. Ju and Y. K. Kim, Mater. Lett., 2007, 61, 3124–3129 CrossRef CAS PubMed.
- W. Jiang, K.-L. Lai, H. Hu, X.-B. Zeng, F. Lan, K.-X. Liu, Y. Wu and Z.-W. Gu, J. Nanopart. Res., 2011, 13, 5135–5145 CrossRef CAS.
- A. Taylor, A. Herrmann, D. Moss, V. Sée, K. Davies, S. R. Williams and P. Murray, PLoS One, 2014, 9, e100259 Search PubMed.
- G. Simon, J. Bauer, O. Saborovski, Y. Fu, C. Corot, M. Wendland and H. Daldrup-Link, Eur. Radiol., 2006, 16, 738–745 CrossRef PubMed.
- H. Suzuki, T. Toyooka and Y. Ibuki, Environ. Sci. Technol., 2007, 41, 3018–3024 CrossRef CAS.
- Y. Jing, N. Mal, P. S. Williams, M. Mayorga, M. S. Penn, J. J. Chalmers and M. Zborowski, FASEB J., 2008, 22, 4239–4247 CrossRef CAS PubMed.
- J. J. Chalmers, Y. Xiong, X. Jin, M. Shao, X. Tong, S. Farag and M. Zborowski, Biotechnol. Bioeng., 2010, 105, 1078–1093 CAS.
Footnotes |
| † Electronic supplementary information (ESI) available: DLS, TEM, pXRD, TGA, SQUID, relaxivity plots, prussian blue staining images of cells and magnetic velocity instrument setup. See DOI: 10.1039/c5bm00011d |
| ‡ Authors contributed equal amounts to publication. |
| This journal is © The Royal Society of Chemistry 2015 |