 Open Access Article
Creative Commons Attribution 3.0 Unported Licence
A composite of a graphene oxide derivative as a novel sensing layer in an organic field-effect transistor
Yebyeol
Kim†
a,
Tae Kyu
An†
a,
Jiye
Kim
a,
Jihun
Hwang
a,
Seonuk
Park
a,
Sooji
Nam
a,
Hyojung
Cha
a,
Won Jeong
Park
b,
Jeong Min
Baik
b and
Chan Eon
Park
*a
aPOSTECH Organic Electronics Laboratory, Polymer Research Institute, Department of Chemical Engineering, Pohang University of Science and Technology, Pohang 790-784, Korea. E-mail: cep@postech.ac.kr; Fax: +82-54-279-8298; Tel: +82-54-279-2269
bSmart Convergence Materials Laboratory, School of Mechanical and Advanced Materials Engineering, Ulsan National Institute of Science and Technology (UNIST), Banyeon-ri 100, Ulsan 689-805, Korea. Tel: +82-52-217-2391
First published on 8th April 2014
Abstract
We report the fabrication of a gas sensor with an oleylamine-modified graphene oxide (OA-GO)/poly(9-9′-dioctyl-fluorene-co-bithiophene) (F8T2) composite as an active layer and demonstrate that it has better sensing ability than a comparable device with an F8T2-only active layer. OA-GO was chosen as the receptor material because of its enhanced interaction with gas analytes and its easy mixing with F8T2. OA-GO was synthesized by a simple condensation reaction between GO and oleylamine (9-octadecylamine), and characterized by Fourier transform infrared spectroscopy. The sensitivities of the gas sensors with respect to acetone and ethanol analytes were investigated by measuring the electrical parameters of the corresponding organic field effect transistor at room temperature. The sensitivity of the OA-GO/F8T2 composite device was up to 34 times that of the F8T2 device for the mobility change of acetone.
1. Introduction
Gas sensors based on organic semiconductors are more suitable for practical applications than inorganic sensors, which usually require high operation temperatures,1 because they operate stably at room temperature and have other advantages such as light weight, mechanical flexibility,2 easy chemical modification,3 and low-cost processing (e.g. ink-jet printing, spin coating).4 Gas analytes interact with organic semiconductor active layers as follows: (i) the analyte molecules adsorb onto the active layer surface; (ii) the adsorbed analytes migrate into the active layer;5 (iii) the analytes undergo various interactions such as van der Waals forces, dipole–dipole interactions, and hydrogen bonding with the active layer. The analytes can be attributed to additional charge carriers as dopants through charge transfer interactions between the inter-grains or can act as carrier trap sites through electrostatic dipole interactions with the active material.6Researchers have attempted to improve the sensitivities of organic sensors. One basic strategy is to use an organic field effect transistor (OFET), which can be characterized with diverse electrical parameters such as the field effect mobility, the threshold voltage, the on-current, and the subthreshold swing during one sweep.7 When the OFET-based gas sensor is exposed to gas analytes, the parameters of the OFET vary with the gas species and quantity. These changes in the parameters can be used to provide qualitative and quantitative analyses of gas analytes. Another strategy is to incorporate a receptor material with polar functional groups, which can improve the sensitivity of the sensor because of the resulting stronger interactions, such as dipole–dipole interactions or hydrogen bonding, between the active layer and gas analytes.8–11 To combine the use of a receptor material with the use of an OFET, many researchers have suggested a bilayer structure consisting of a receptor layer and the active layer;12,13 in such a system, the sensitivity of the sensor is enhanced because analytes are easily adsorbed onto the receptor molecules. However, the fabrication of a bilayer structure requires an additional processing step to deposit the receptor material, which can damage the bottom active layer.
In this paper, we suggest a novel and simple strategy that uses a new active layer consisting of a composite of oleylamine-modified graphene oxide (OA-GO) as the receptor material and poly(9-9′-dioctyl-fluorene-co-bithiophene) (F8T2) as the polymer semiconductor. We synthesized OA-GO, which is well dispersed in the hydrophobic F8T2 domain material and improves the sensor's interactions with polar analytes. We also fabricated an OA-GO/F8T2 composite active layer by performing a simple and easy one-step spin coating. The sensitivity of the OFET-based gas sensor with an OA-GO/F8T2 composite active layer was assessed by measuring the variations of the OFET parameters before and after exposure to various analytes. We demonstrated that the sensor with an OA-GO/F8T2 composite active layer has superior sensitivity to analytes than a sensor with an F8T2-only active layer. Further, we were able to achieve selectivity with respect to analyte species by analyzing the variations in the field effect mobility and the threshold voltage of the OFET.
2. Experimental
2.1. Materials
Graphite was purchased from Alfa Aesar (LOT:K23U009) and all other chemicals were purchased from Sigma-Aldrich.2.2. Preparation of graphene oxide
Graphene oxide was prepared from flake graphite by using a modified Hummers method.14 The oxidation reaction was performed as a two-step reaction. In the pre-oxidation step, graphite (2.5 g), K2SO8 (5 g) and P2SO4 (5 g) were placed in a flask, then H2SO4 (20 mL) was added with stirring at 80–85 °C for 6 h, and the solution was cooled to room temperature overnight. Second, in the oxidation step, H2SO4 (60 mL) was added to the preoxidized graphite solution. In the next step, KMnO4 (15 g) was carefully added over approximately 5 min with stirring at 35 °C. The mixture was further stirred for 2 days, and then DI water and H2O2 were added and stirred at room temperature for several hours. After allowing the solution to stand for 2 days, the lower portions were collected.In order to remove the ions from the acquired portions, particularly manganese ions, the solution was purified by repeating the following processes at least 5 times: (i) addition of mixed aqueous solution HCl–H2O (1![[thin space (1/6-em)]](https://www.rsc.org/images/entities/char_2009.gif) :
:![[thin space (1/6-em)]](https://www.rsc.org/images/entities/char_2009.gif) 9) and (ii) centrifugation (4000–5000 rpm for over 30 min). The solution was then washed and neutralized with DI-water at least 5 times. The resultant solution was dispersed in DI-water and sonicated for 30 min to form an exfoliated GO sheet. GO monolayer sheets were gathered in the supernatant through centrifugation.
9) and (ii) centrifugation (4000–5000 rpm for over 30 min). The solution was then washed and neutralized with DI-water at least 5 times. The resultant solution was dispersed in DI-water and sonicated for 30 min to form an exfoliated GO sheet. GO monolayer sheets were gathered in the supernatant through centrifugation.
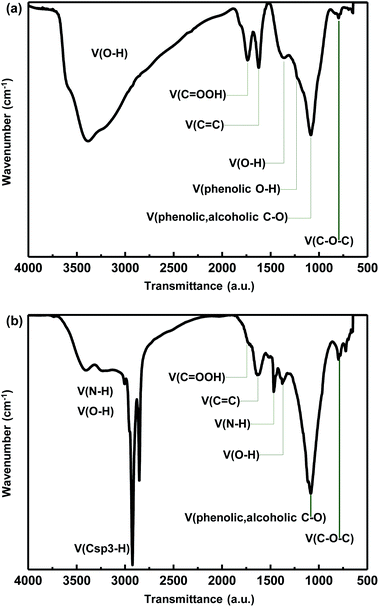
Fig. 1a shows the Fourier transform infrared (FTIR: NICOLET 6700, Thermo electron corporation) spectrum of the synthesized GO. The spectrum contains peaks for edge carboxylic acid groups ((HO)C![[double bond, length as m-dash]](https://www.rsc.org/images/entities/char_e001.gif) O stretching at 1743 cm−1, O–H vibration at 3000–3500 cm−1), tertiary hydroxyl groups (O–H stretching at 3000–3500 cm−1, bending at 1356 cm−1), phenolic groups (C–O stretching at 1100 cm−1, O–H vibration at 3000–3500 cm−1) and epoxy groups (C–O stretching at 1250 cm−1, C–O bending at 800 cm−1), which are consistent with previous results.15
O stretching at 1743 cm−1, O–H vibration at 3000–3500 cm−1), tertiary hydroxyl groups (O–H stretching at 3000–3500 cm−1, bending at 1356 cm−1), phenolic groups (C–O stretching at 1100 cm−1, O–H vibration at 3000–3500 cm−1) and epoxy groups (C–O stretching at 1250 cm−1, C–O bending at 800 cm−1), which are consistent with previous results.15
2.3. Synthesis of chemically modified GO
OA-GO was synthesized according to the method reported by Howard Wang et al.16 A GO/H2O (50 mg/8.5 mL) suspension was mixed with an OA–ethanol solution. The appropriate OA/GO mass ratios generate amphiphilic properties. The mixtures were vigorously stirred at room temperature for 24 h and vacuum dried at 80 °C for 12 h.2.4. Fabrication of the OFET
Heavily n-type doped silicon wafers with 3000 Å oxide were cleaned with piranha solution (6![[thin space (1/6-em)]](https://www.rsc.org/images/entities/char_2009.gif) :
:![[thin space (1/6-em)]](https://www.rsc.org/images/entities/char_2009.gif) 4 H2SO4
4 H2SO4![[thin space (1/6-em)]](https://www.rsc.org/images/entities/char_2009.gif) :
:![[thin space (1/6-em)]](https://www.rsc.org/images/entities/char_2009.gif) H2O2). The SiO2 substrates were chemically modified with octadecyltrichlorosilane (ODTS) to increase the hydrophobicity of gate dielectric surfaces. The OA-GO/F8T2 composite was prepared in chloroform (1.35 mL) with a feeding weight ratio of 1
H2O2). The SiO2 substrates were chemically modified with octadecyltrichlorosilane (ODTS) to increase the hydrophobicity of gate dielectric surfaces. The OA-GO/F8T2 composite was prepared in chloroform (1.35 mL) with a feeding weight ratio of 1![[thin space (1/6-em)]](https://www.rsc.org/images/entities/char_2009.gif) :
:![[thin space (1/6-em)]](https://www.rsc.org/images/entities/char_2009.gif) 9 (OA-GO
9 (OA-GO![[thin space (1/6-em)]](https://www.rsc.org/images/entities/char_2009.gif) :
:![[thin space (1/6-em)]](https://www.rsc.org/images/entities/char_2009.gif) F8T2) and deposited on top of the ODTS-treated dielectric layer. The active layer was constructed by spin-coating at 2000 rpm for 30 s with the solution comprising 0.2% in chloroform. The thickness of the active layer was characterized as 50 nm for ellipsometry. The surface morphology was visualized via tapping mode atomic force microscopy (AFM: Multimode SPM, Digital Instruments). Gold electrodes were thermally evaporated onto the active layer. The electrode dimensions were defined by a shadow mask and the width (W)/length (L) ratio of all devices is 10.
F8T2) and deposited on top of the ODTS-treated dielectric layer. The active layer was constructed by spin-coating at 2000 rpm for 30 s with the solution comprising 0.2% in chloroform. The thickness of the active layer was characterized as 50 nm for ellipsometry. The surface morphology was visualized via tapping mode atomic force microscopy (AFM: Multimode SPM, Digital Instruments). Gold electrodes were thermally evaporated onto the active layer. The electrode dimensions were defined by a shadow mask and the width (W)/length (L) ratio of all devices is 10.
2.5. The variation of the OFET characteristics with gas exposure
Each OFET gas sensor was exposed to acetone and ethanol analytes for ten minutes under saturation vapor pressure conditions. In order to measure the characteristic drain current–gate voltage (ID–VG) signal output of the sensor, the device was connected and controlled with a probe station (Keithley 2361). For the transfer curves, a constant drain voltage of −80 V and a gate voltage on the forward sweep (20 to −80 V) were applied to the device while the current was recorded. The ID–VG curves were obtained before and after exposure to each gas analyte. The field-effect mobility and threshold voltage were extracted in the saturation regime by using the following formula:| ID = μFETCdiel(W/2L)/(VGS − Vth)2 |
3. Results and discussion
3.1. Synthesis of OA-GO
The synthesis of OA-GO was confirmed by examining the recorded FTIR spectrum. As shown in Fig. 1b, various oxygen functional groups remain after the condensation reaction between GO and OA. The peak at ∼1356 cm−1 corresponds to the bending vibration of the tertiary alcohol and the peaks at ∼1100 and ∼1250 cm−1 are due to C–O stretching vibrations. The C![[double bond, length as m-dash]](https://www.rsc.org/images/entities/char_e001.gif) O stretching was confirmed at 1700 cm−1 as the shoulder peak was blue-shifted relative to the peak of GO (1743 cm−1) because when a nitrogen atom is attached to the carbonyl carbon, the lone pair of electrons of nitrogen stabilize the resonance form. Therefore the carbonyl stretching peak was partially overlapped with the aromatic C
O stretching was confirmed at 1700 cm−1 as the shoulder peak was blue-shifted relative to the peak of GO (1743 cm−1) because when a nitrogen atom is attached to the carbonyl carbon, the lone pair of electrons of nitrogen stabilize the resonance form. Therefore the carbonyl stretching peak was partially overlapped with the aromatic C![[double bond, length as m-dash]](https://www.rsc.org/images/entities/char_e001.gif) C bending (1623 cm−1).15 Furthermore, there are new bands at ∼3400 and ∼1465 cm−1, which indicate the formation of amide groups in the condensation with OA. The bands with reduced intensities at ∼1737 cm−1 and 3000–3500 cm−1 are assigned to the condensation between the carboxylic acid group of graphene oxide and the amine group of OA. The alkyl C–H stretching vibration peak at ∼2925 cm−1 is due to the OA long alkyl chain.18
C bending (1623 cm−1).15 Furthermore, there are new bands at ∼3400 and ∼1465 cm−1, which indicate the formation of amide groups in the condensation with OA. The bands with reduced intensities at ∼1737 cm−1 and 3000–3500 cm−1 are assigned to the condensation between the carboxylic acid group of graphene oxide and the amine group of OA. The alkyl C–H stretching vibration peak at ∼2925 cm−1 is due to the OA long alkyl chain.18
3.2. Fabrication of the OA-GO/F8T2 composite
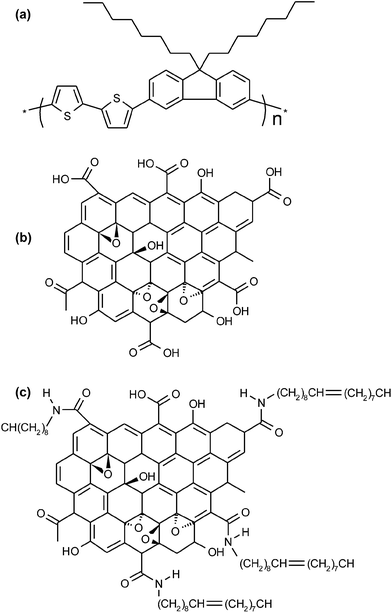
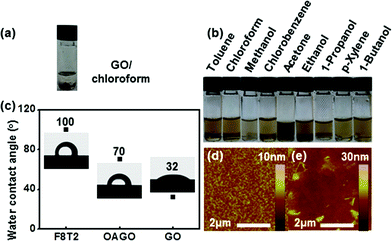
The chemical structures of F8T2, GO, and OA-GO are presented in Fig. 2. In contrast to F8T2, GO and OA-GO have many polar functional groups (according to the widely accepted Lerf–Klinowski model19), which indicates their potential as receptor materials. However, Fig. 3a shows that GO is undispersed in the organic solvent chloroform because of its excessively hydrophilic characteristics. In contrast, as shown in Fig. 3b, OA-GO is well dispersed in diverse organic solvents because of its hydrophobic alkyl chain20 (see Fig. 1c). Depending on the solvent, OA-GO is stably dispersed for 2 h to 1 week. Fig. 3c also shows the varying hydrophilicity of these materials. The water contact angles of F8T2 and GO are 100° and 32° respectively. This difference in hydrophilicity means that there is phase separation between GO and F8T2. The lower water contact angle of OA-GO (70°, in Fig. 3c) corresponds to lower hydrophilicity and increased compatibility with F8T2. In Fig. 3e, it can be seen that OA-GO is well dispersed with F8T2 on the micro-scale and that the OA-GO sheet is oriented in a parallel conformation with the film plane rather than in the vertical conformation because of the large shear stress during spin-coating deposition.21–233.3. OFET characteristics
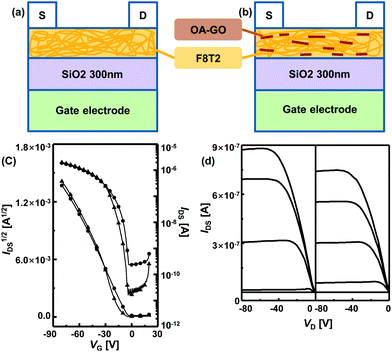
We fabricated top-contact bottom-gate OFET with F8T2-only and OA-GO/F8T2 composite active layers; schematic structures of the devices are shown in Fig. 4a and b.Fig. 4c and d show the drain current–gate voltage (ID–VG) transfer curves and the drain current–drain voltage (ID–VD) output characteristics of these devices. Both devices exhibit good linear/saturation behavior, which indicates stable transistor operation and that the transfer curves were obtained in the saturation regime (VD = −80 V). For the F8T2-only OFET devices, the average μFET value was 1.72 × 10⁻² with a high value of 2.19 × 10⁻² cm2 V−1 s−1, and the average Vth value was −16.27 V. For the OA-GO/F8T2 composite OFET devices, the average μFET was 7.31 × 10⁻³ with a high value of 7.82 × 10⁻³ cm2 V−1 s−1, and the average Vth was −6.15 V. The mobility of the composite device is slightly lower than that of the F8T2-only device because OA-GO has insulating properties. The OA-GO/F8T2 composite OFET operates satisfactorily and can be used in an OFET-based gas sensor.
3.4. Sensitivity of the OFET-based gas sensor with an OA-GO/F8T2 active layer
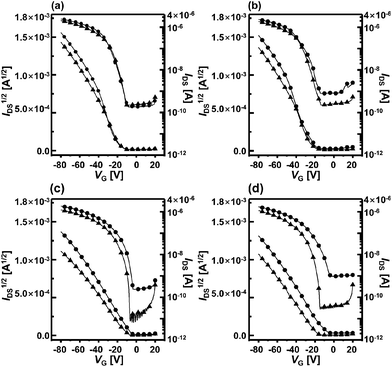
The sensor devices were exposed to acetone and ethanol analytes and the sensitivities of each OFET were determined by measuring ID during an applied gate bias sweep. Fig. 5a and b show the transfer characteristics of the F8T2-only-based OFET and Fig. 5c and d show the characteristics of the OA-GO/F8T2 composite-based OFET before and after the gas analyte exposures. The F8T2-only devices exhibit little or no noticeable response to the analytes, whereas the composite devices undergo dramatic changes in the presence of both analytes. The shifts in mobility and threshold voltage after vapor exposure were confirmed by examining the ID1/2–VG transfer curves in the saturation regime for both types of OFET devices. The transistor parameters for all cases are summarized in Table 1. The parameters of the F8T2-only-based OFET changed only slightly. F8T2 contains few polar moieties, so the analytes interact with F8T2 through weak van der Waals forces and only very few are adsorbed onto the active layer. In other words, the analytes produce only weak changes in the F8T2-only OFET parameters.| Analytes | Active layer | Condition | V th [V] | μ [10−3 cm2 V−1 s−1] |
|---|---|---|---|---|
| Acetone | F8T2 | Fresh | −15.94 | 18.94 |
| Gas | −16.70 | 18.62 | ||
| Composite | Fresh | −4.87 | 7.82 | |
| Gas | −7.09 | 3.22 | ||
| Ethanol | F8T2 | Fresh | −21.99 | 21.85 |
| Gas | −23.40 | 21.25 | ||
| Composite | Fresh | −7.84 | 7.37 | |
| Gas | −16.91 | 6.23 |
In contrast, in the composite-based OFET, Vth is shifted by a maximum of 9.1 V (ethanol exposure) and μFET is changed by a maximum of 4.6 × 10⁻³ cm2 V−1 s−1 (acetone exposure). The mobility decreases and the threshold voltage shifts after exposure to acetone and ethanol mean that the analytes reduce the mobile hole carrier concentration.12,24,25 The analytes interact with the active layer and act as charge carrier trap sites.26 Thus, mobile hole carriers are captured by the analytes during the gate voltage sweep, which alters the electrical parameters of the OFET.27–29 This significant change in the composite-based OFET is attributed to the polar moieties of OA-GO, which intensify interactions such as dipole–dipole interactions or hydrogen bonding with the analytes. The analytes are easily adsorbed onto the OA-GO/F8T2 composite active layer surface and undergo more and stronger interactions with the OA-GO/F8T2 active layer than with the F8T2-only active layer. As a result, the composite OFET is much more strongly affected by the analytes than in the case of the F8T2-only OFET.
To investigate the selectivity with respect to gas analyte species, the degrees of change in the OFET parameters were normalized with simple equations as follows and the results are shown in Fig. 6:
| %ΔVth = ((Vth_e − Vth_f)/Vth_f) × 100 | (1) |
| %Δμ = ((μe − μf)/μf) × 100 | (2) |
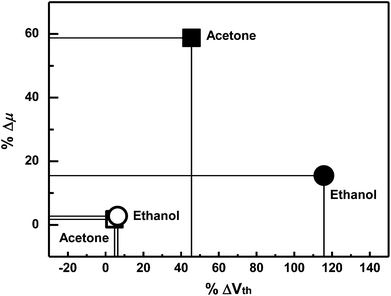 | ||
| Fig. 6 The degrees of shift for the gas analytes. The filled symbols are for the F8T2-only device and emptied symbols are for the composite device. | ||
Compared to the F8T2 device, the sensitivity of the OA-GO/F8T2 composite device was 10 times higher in %ΔVth and 34 times higher in %Δμ for acetone and 18 times higher in %ΔVth and 6 times higher in %Δμ for ethanol.
When the composite device is exposed to acetone, the threshold voltage and mobility are changed (%ΔVth: 45.5%, %Δμ: 58.78%). In the case of ethanol exposure, the threshold voltage changes significantly (115.7%), whereas the mobility undergoes a smaller change (15.49%). Particularly %ΔVth in an ethanol exposure is much larger than %ΔVth in an acetone exposure. The different responses to different analyte species are related to the intensity of the interactions between the analytes and OA-GO, which has potential for different interactions with each analyte through its various polar moieties. The analytes that interact strongly with the active layer require a long time for desorption and migration. As a result, the holes that are trapped by the analytes with stronger interactions require a longer time for de-trapping.
Acetone undergoes various types of intermolecular interactions such as dipole–dipole interactions and dipole-induced dipole interactions with the diverse polar functional groups of OA-GO, particularly the hydroxyl, amide, and epoxide groups. Analytes with different interaction types exhibit different de-trap time scales. In a trap with weak interactions, the trapped hole is easily de-trapped during operation. Thus, hole transport is interrupted by repeated trapping and de-trapping on gate bias sweep. As a result, the mobility is significantly decreased. On the other hand, the threshold voltage is shifted by long life time traps due to strong interactions between analytes and OA-GO. The trapped hole carriers with strong interaction cannot release during operation time. Therefore, acetone produces traps with various time scales, and the mobility and threshold voltage are altered. Ethanol contains a hydroxyl group, which is likely to undergo stronger interactions than acetone through hydrogen bonding with the amide and hydroxyl groups of OA-GO.30 The high magnitude of the threshold voltage change for ethanol is interpreted to mean that the ethanol analytes act as long time traps.
Although acetone and ethanol produce mobility and threshold voltage changes with the same direction, it is very easy to distinguish these analytes because of the differences between the responses of the OFET sensor devices.
4. Conclusion
We have fabricated an OFET-based gas sensor with enhanced sensitivity by using a new composite consisting of OA-GO and F8T2 as the receptor material. We synthesized OA-GO, which has a hydrophobic alkyl chain to improve its dispersion with hydrophobic F8T2. The composite OFET-based gas sensor was found to be more sensitive than the F8T2-only device because the polar functional groups of OA-GO undergo stronger interactions with gas analytes. To analyze the electrochemical effects of the gas analytes, the changes in the mobility and threshold voltage were investigated for each gas species. Acetone analytes affect the mobility and threshold voltage to similar extents. In contrast, ethanol analytes mainly interact with the active layer through strong hydrogen bonding, which results in a threshold voltage shift that is larger than the shift in the mobility. This difference between the changes in the OFET parameters induced by different analytes corresponds to the different types of traps that are formed by different gas analyte species. The use of OA-GO as the receptor material means that the electrical sensitivity of the OFET is amplified and its selectivity with respect to gas analytes is improved.Acknowledgements
This research was supported by a grant (2011-0031639) from the Center for Advanced Soft Electronics under the Global Frontier Research Program of the Ministry of Education, Science and Technology, Korea.References
- Y. Zhang, J. Xu, Q. Xiang, H. Li, Q. Pan and P. Xu, J. Phys. Chem. C, 2009, 113, 3430–3435 CAS.
- G. Eda, G. Fanchini and M. Chhowalla, Nat. Nanotechnol., 2008, 3, 270–274 CrossRef CAS PubMed.
- N. Cernetic, O. Acton, T. Weidner, D. O. Hutchins, J. E. Baio, H. Ma and A. K. Y. Jen, Org. Electron., 2012, 13, 3226–3233 CrossRef CAS PubMed.
- B. K. C. Kjellander, W. T. T. Smaal, K. Myny, J. Genoe, W. Dehaene, P. Heremans and G. H. Gelinck, Org. Electron., 2013, 14, 768–774 CrossRef CAS PubMed.
- T.-S. Chung, L. Y. Jiang, Y. Li and S. Kulprathipanja, Prog. Polym. Sci., 2007, 32, 483–507 CrossRef CAS PubMed.
- W. Huang, J. Sinha, M.-L. Yeh, J. F. M. Hardigree, R. LeCover, K. Besar, A. M. Rule, P. N. Breysse and H. E. Katz, Adv. Funct. Mater., 2013, 23, 4094–4104 CrossRef CAS.
- L. Torsi, A. Dodabalapur, L. Sabbatini and P. G. Zambonin, Sens. Actuators, B, 2000, 67, 312–316 CrossRef CAS.
- I. Simon, N. Bârsan, M. Bauer and U. Weimar, Sens. Actuators, B, 2001, 73, 1–26 CrossRef CAS.
- F. Tavoli and N. Alizadeh, Sens. Actuators, B, 2013, 176, 761–767 CrossRef CAS PubMed.
- C. Wang, L. Yin, L. Zhang, D. Xiang and R. Gao, Sensors, 2010, 10, 2088–2106 CrossRef CAS PubMed.
- N. Yamazoe, Sens. Actuators, B, 2005, 108, 2–14 CrossRef CAS PubMed.
- D. Duarte and A. Dodabalapur, J. Appl. Phys., 2012, 111, 044509 CrossRef PubMed.
- A. N. Sokolov, M. E. Roberts, O. B. Johnson, Y. Cao and Z. Bao, Adv. Mater., 2010, 22, 2349–2353 CrossRef CAS PubMed.
- O. C. Compton, B. Jain, D. A. Dikin, A. Abouimrane, K. Amine and S. T. Nguyen, ACS Nano, 2011, 5, 4380–4391 CrossRef CAS PubMed.
- Y. Gao, H.-L. Yip, K.-S. Chen, K. M. O'Malley, O. Acton, Y. Sun, G. Ting, H. Chen and A. K. Y. Jen, Adv. Mater., 2011, 23, 1903–1908 CrossRef CAS PubMed.
- K. Yang, S. Liang, L. Zou, L. Huang, C. Park, L. Zhu, J. Fang, Q. Fu and H. Wang, Langmuir, 2012, 28, 2904–2908 CrossRef CAS PubMed.
- H. Klauk, Chem. Soc. Rev., 2010, 39, 2643–2666 RSC.
- B. Ivanova and T. Kolev, in Linearly Polarized IR Spectroscopy; Theory and Applications for Structural Analysis, CRC Press, 2011, DOI:10.1201/b11197–5, pp. 73–122.
- A. Lerf, H. He, M. Forster and J. Klinowski, J. Phys. Chem. B, 1998, 102, 4477–4482 CrossRef CAS.
- D. V. Leff, L. Brandt and J. R. Heath, Langmuir, 1996, 12, 4723–4730 CrossRef CAS.
- G. Eda and M. Chhowalla, Adv. Mater., 2010, 22, 2392–2415 CrossRef CAS PubMed.
- S. Watcharotone, D. A. Dikin, S. Stankovich, R. Piner, I. Jung, G. H. B. Dommett, G. Evmenenko, S.-E. Wu, S.-F. Chen, C.-P. Liu, S. T. Nguyen and R. S. Ruoff, Nano Lett., 2007, 7, 1888–1892 CrossRef CAS PubMed.
- G. Eda, H. Emrah Unalan, N. Rupesinghe, G. A. J. Amaratunga and M. Chhowalla, Appl. Phys. Lett., 2008, 93, 233502 CrossRef PubMed.
- W. Huang, J. Sinha, M.-L. Yeh, J. F. M. Hardigree, R. LeCover, K. Besar, A. M. Rule, P. N. Breysse and H. E. Katz, Adv. Funct. Mater., 2013, 23, 4094–4104 CrossRef CAS.
- J. E. Royer, E. D. Kappe, C. Zhang, D. T. Martin, W. C. Trogler and A. C. Kummel, J. Phys. Chem. C, 2012, 116, 24566–24572 CAS.
- Z. Hsiao-Wen, T. Wu-Wei, L. Yen-ren, W. Yu-Mei and Y. Yuh-Shyong, IEEE Sens. J., 2012, 12, 594–601 CrossRef.
- R. Di Pietro, D. Fazzi, T. B. Kehoe and H. Sirringhaus, J. Am. Chem. Soc., 2012, 134, 14877–14889 CrossRef CAS PubMed.
- G. Gu, M. G. Kane, J. E. Doty and A. H. Firester, Appl. Phys. Lett., 2005, 87, 243512 CrossRef PubMed.
- N. Karl, Synth. Met., 2003, 133–134, 649–657 CrossRef CAS.
- S. Konwer, A. Guha and S. Dolui, J. Mater. Sci., 2013, 48, 1729–1739 CrossRef CAS.
Footnote |
| † Yebyeol Kim and Tae Kyu An equally contributed as first authors. |
| This journal is © The Royal Society of Chemistry 2014 |

