 Open Access Article
Creative Commons Attribution 3.0 Unported Licence
Electrochemically color tunable poly(N-isopropylacrylamide) microgel-based etalons†
Wenwen
Xu
,
Yongfeng
Gao
and
Michael J.
Serpe
*
Department of Chemistry, University of Alberta, Edmonton, Alberta T6G 2G2, Canada. E-mail: michael.serpe@ualberta.ca
First published on 14th April 2014
Abstract
In this submission, pH responsive poly(N-isopropylacrylamide)–based microgels were used to fabricate optical devices (etalons). We demonstrate that the optical properties of the etalons could be manipulated upon the application of an appropriate electric potential between the etalon and a counter electrode, both in an electrolyte solution. An appropriate electrical potential hydrolyzes the water of the electrolyte solution, which subsequently changes the pH of the electrolyte solution. Since solution pH is able to change the solvation state of the microgels, and the etalon's optical properties depend on the microgel's solvation state, the etalon's optical properties can be tuned with an applied electrical potential. We show that the etalon's optical properties (color) is stable for many hours, until an appropriate potential is applied to bring the solution pH back to its initial value. The device's color switching kinetics were also probed, and showed significant color changes on the minute time scale. The dramatic optical property changes coupled with the reversibility of the device's color makes this system potentially useful for display device applications.
Display devices that utilize light emission to produce high quality images have enormous utility, but do not produce high fidelity images when used in certain environments, e.g., bright sunlight. In contrast, electronic paper (e-paper) utilizes reflected light from an external light source to generate an image. The effect leads to a display that is more like “real” paper, allowing it to be used more effectively in bright environments. However, up to now, commercialized e-paper devices are available in black-and-white, while it is still difficult to develop and commercialize multicolor e-paper.
Photonic materials (PMs), consisting of at least two different periodically arranged dielectric materials, can exhibit color by affecting light propagating through its structure.1–3 Specifically, light interacting with ordered elements in a material leads to constructive and destructive interference of light waves propagating through it, yielding color. This kind of material is inherently bright under strong light illumination, and is not subject to photobleaching making it is more durable than pigments/chromophores and an ideal candidate for colored e-paper.4–9 Along these lines, Ozin and coworkers reported that iron based metallopolymer films display voltage-dependent color due to a redox reaction.7 The Kang group fabricated polystyrene-block-poly(2-vinyl pyridine) (PS-b-P2VP) block copolymer based photonic gel where recorded information can be maintained for longer than 96 h.8 The Yin group embedded silica-coated Fe3O4 colloids into poly(ethylene glycol) diacrylate (PEGDA) films to make rewritable photonic paper.9 All of the above materials are capable of maintaining their recorded information (e.g., color, image) without the use of an external power supply. Hence, lower power consumption is one of the major advantages of e-paper displays, compared to light emitting diode (LED) and liquid crystal display (LCD) technologies. Therefore this relatively new area is worth much more research attention.
Our group has previously fabricated and characterized “one dimensional” PMs using pNIPAm-based microgels sandwiched between two semi-transparent metal layers.10,11 Specifically, a single layer of poly(N-isopropylacrylamide)-based microgels can be deposited on a Au-coated glass substrate followed by the deposition of another thin Au layer on top of the microgels. Such a device (referred to as an etalon) displays vivid colors, which are dynamically tunable over a large range of visible wavelengths. The devices operate by light impinging on the etalon entering the microgel-based cavity and resonating between the two Au layers. This behavior leads to constructive and destructive interference, which leads to color. This is a direct result of interference, where specific light wavelengths are reflected, while others are transmitted. The specific reflected wavelengths lead to peaks in a reflectance spectrum, where the peak position(s) can be predicted by eqn (1):
mλ = 2nd![[thin space (1/6-em)]](https://www.rsc.org/images/entities/char_2009.gif) cos(β) cos(β) | (1) |
Since discovering these devices, they have been used to sense pH,12 glucose,13 temperature,14 and macromolecules.15 Here, we expand the utility of these devices by showing that their color can be made tunable to electric fields for possible e-paper display applications. To accomplish this, we treated the etalon as one electrode in an electrochemical cell. It has been proven that the application of a suitable potential between two electrodes in water leads to water electrolysis (reduction potential for water is 1.23 V at pH 7 (ref. 16)), which leads to a pH change near both the anode and the cathode. To make our devices electrochemically active, we fabricated etalons from pH responsive pNIPAm-co-acrylic acid (pNIPAm-co-AAc) microgels. These microgels, and etalons, respond to pH by swelling at pH > 4.25 (pKa for AAc). This swelling is a result of the microgels becoming negatively charged at high pH, leading to electrostatic repulsion and osmotic pressure effects. At pH < 4.25, the AAc groups are protonated, and the microgels deswell back to their initial diameter. We have shown that the solvation state modulation as a function of pH leads to an etalon color change and a shift in the position of the peaks in the reflectance spectra.17 As such, we hypothesize that the pH change of the solution in response to water hydrolysis should lead to a color change, and a shift in the peak positions.
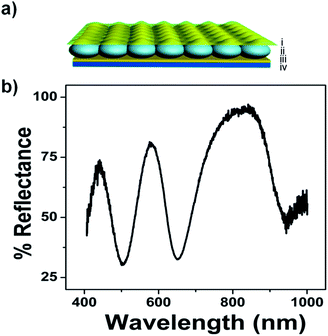
For this investigation, pNIPAm-co-AAc microgel-based etalons were fabricated and displayed characteristic multipeak reflectance spectra. A schematic of the device structure and a representative reflectance spectrum is shown in Fig. 1. For all experiments here, the position of the peak centered at ∼574 nm was monitored. As depicted in Fig. 2(a), the etalons were connected to a power supply and used as the working electrode, while an indium tin oxide (ITO) glass slide functioned as a counter electrode. An insulator separated the two electrodes and a selected electrolyte was introduced into the space between the ITO slide and etalon. We point out that the spacer was able to seal in the liquid very effectively, therefore allowing the device to function for long periods of time. This is important for display applications. We found the selection of the electrolyte solution to be critical. First, the electrolyte solution should swell the microgels in the etalon; still allowing them to respond to the electrochemically-induced pH changes. Second, ITO glass has been shown to react with water hydrolysis products, leading to a decrease in its conductivity and transparency.18,19 For our experiments we found that a solution of 0.1 M LiOOCCH3 in a mixture of water and ethanol (1![[thin space (1/6-em)]](https://www.rsc.org/images/entities/char_2009.gif) :
:![[thin space (1/6-em)]](https://www.rsc.org/images/entities/char_2009.gif) 9 by volume, respectively) yielded all of the desired properties. As mentioned above, application of a DC voltage with the appropriate magnitude to electrodes in water leads to electrolysis, which results in a change in the solution's pH.20 In this case, when an appropriate negative potential was applied to the etalon, water reduction occurred, leading to hydrogen gas generation and an increase in the water pH in the vicinity of etalon. On the contrary, when the etalon was held at positive potential, oxygen gas will be produced, resulting in a decrease in the water pH near the etalon. In all of the experiments, voltages were carefully controlled so that the gas generation is minimized and does not damage the optical properties of our device. This process is depicted schematically in Fig. 2(b). Thus, pNIPAm-co-AAc microgel-based etalons should change their optical properties (color) when the respective potentials are applied to the etalon.
9 by volume, respectively) yielded all of the desired properties. As mentioned above, application of a DC voltage with the appropriate magnitude to electrodes in water leads to electrolysis, which results in a change in the solution's pH.20 In this case, when an appropriate negative potential was applied to the etalon, water reduction occurred, leading to hydrogen gas generation and an increase in the water pH in the vicinity of etalon. On the contrary, when the etalon was held at positive potential, oxygen gas will be produced, resulting in a decrease in the water pH near the etalon. In all of the experiments, voltages were carefully controlled so that the gas generation is minimized and does not damage the optical properties of our device. This process is depicted schematically in Fig. 2(b). Thus, pNIPAm-co-AAc microgel-based etalons should change their optical properties (color) when the respective potentials are applied to the etalon.
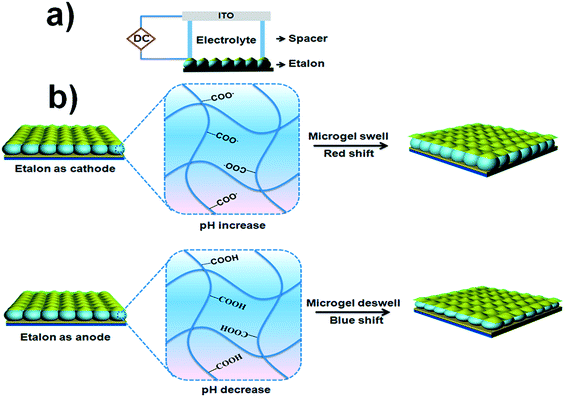 | ||
| Fig. 2 (a) Schematic of the etalon-based electrochemical cell and (b) schematic representation of the responsivity of the etalon when it behaves as a cathode and anode. | ||
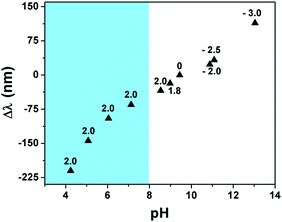
To investigate this, we exposed the etalons to an aqueous solution with a pH of 9.4 and varied the voltage applied to the etalon. Specifically, the etalon was initially held at a more negative voltage and scanned to a more positive voltage while the pH near the etalon was monitored using a miniature pH electrode. In addition, the reflectance spectrum was monitored as the voltage was varied. The results are shown in Fig. 3 and show that the application of different voltages to the etalon was enough to yield water electrolysis and a concomitant change in the solution pH. Specifically, application of increasingly positive voltages to the etalon leads to a decrease in the solution pH, which leads to protonation of the microgel's AAc groups and a concomitant blue shift of the monitored reflectance peak. On the other hand, when increasingly negative potentials are applied to the etalon, the solution pH increases, leading to deprotonation of the microgel's AAc groups and a concomitant red shift of the monitored reflectance peak. It is worth pointing out here that we were only able to vary the solution pH in the range of ∼9–13 electrochemically. Over this pH range, we don't expect AAc to be significantly protonated/deprotonated since the pKa for AAc is ∼4.25. While this is the case, we believe that even at this high pH, there is enough change in the protonation state of the microgels to yield the appropriate amount of relative deswelling/swelling required to give a significant blue/red shift of the reflectance peaks. There have been literature reports supporting this behavior; AAc-based gels swelling at pHs well beyond their pKa.20
To further support this hypothesis, we monitored the etalon's optical response to changes in solution pH in the range of 9 to 13, in the absence of an applied electric field. The results, which are shown in the ESI,† show that the etalon is able to respond to solution pH changes in this range. It is worth pointing out though that the etalon's response to pH alone is not as pronounced as its response to pH change induced by the applied potential. While it is not completely understood why this is the case,21–23 we believe that the electrode's electrostatic interactions with the counterion Li+ results in electrodiffusion phenomena, yielding the enhanced response. Specifically, when a negative voltage is applied to the etalon, the Li+ will move to the etalon due to electrophoretic migration and facilitate the ionization of the microgels AAc groups. This yields more Coulombic repulsion and osmotic swelling of the polymer layer, and a greater optical response. Finally, we point out that there is no response to pH changes for pNIPAm microgel-based etalons, i.e., etalons composed of microgels with no AAc. We add here that since pNIPAm is thermoresponsive, the solution temperature was monitored throughout this process, and no significant temperature change was observed. Therefore, we attribute the changes of the etalon's optical properties to the both the solution pH changes and the apparent sensitivity of the microgel solvation state to the applied electric field.
While the etalon is capable of responding to solution pH changes well above AAc's pKa, it should be capable of significantly more response if the pH of the solution could be further decreased to below AAc's pKa. To investigate this, we maintained the etalon's potential at 2 V while varying the pH of the solution by the addition of a dilute solution of HCl to the etalon while monitoring the position of the monitored reflectance peaks. As can be seen in the shaded region of Fig. 3, the device is capable of significant response as the pH of the solution is varied near AAc's pKa.
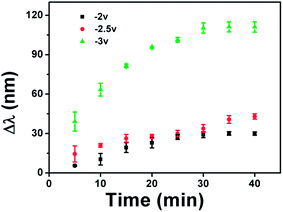
We also investigated the kinetics of the etalon's spectral response to the application of a potential and how the response kinetics varied with the magnitude of the applied potential. In this part of experiment, we assembled the cell and waited for the optical spectra to stabilize with no voltage applied. After the spectra were stable, we applied various voltages to the etalon. Fig. 4 shows that the rate of the monitored reflectance peak shift depended dramatically on the applied voltage. Specifically, when the applied potential is relatively low (−2.0 and −2.5 V) the monitored reflectance peak shifts slowly with time, while it is significantly faster at −3.0 V. We hypothesize that this is a result of the increased rate of water hydrolysis at −3.0 V, which is capable of changing the solution pH in a shorter time period. It is important to point out that the etalons are stable after 30 minutes.
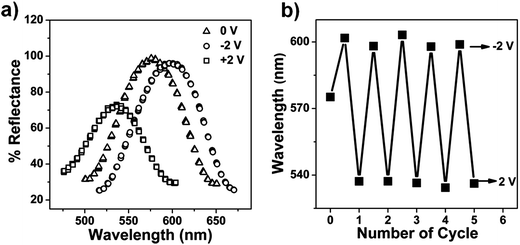
The reversibility of the etalon's response to the voltage induced solution pH changes was also investigated. Initially, we determined if the device's optical properties were stable after the application of a specific voltage to the etalon, followed by the removal of the applied voltage. We found that the reflectance peak shifts 70 nm back toward its initial position after application and removal of −3 V followed by overnight incubation. We point out though that the etalon's optical properties could not return to their initial state by simply waiting, even though the solution pH returned to its initial value, see ESI.† We attribute this to ion-induced hysteresis that has been previously observed by our group and others.24,25 In this case, we investigated if the etalon could be made reversible by applying the opposite polarity on the etalon. That is, immediately after the application of a negative voltage to the etalon, a positive voltage was applied, while monitoring the etalon's optical properties. The results are shown in Fig. 5, which reveal that the etalon is capable of reversible red/blue shifts in response to systematic voltage variations from negative to positive voltages. The kinetics of the reversibility are shown in Tables 1 and 2, which reveal that the reversibility was faster when the applied voltage to trigger the reversibility increased. This is most likely due to the faster solution pH changes at the larger applied potential. We again attribute the reversibility to both pH change from water electrolysis and electrokinetic process. That is, when a positive voltage is applied to etalon, Li+ will move away from the etalon, making AAc protonation more efficient. We also point out that since a voltage of <1.8 V cannot hydrolyze water, and a voltage >2 V dissolves the gold layer, we must work in a narrow voltage range.
| Voltage (V) | Time (min) | Total shift (nm) | Rate (nm min−1) |
|---|---|---|---|
| −2 | 3.8 ± 0.3 | 61 ± 1 | 16 |
| −2.5 | 5.1 ± 0.8 | 77 ± 3 | 15 |
| −3 | 12 ± 4 | 140 ± 10 | 12 |
| Voltage (V) | Time (min) | Total shift (nm) | Rate (nm min−1) |
|---|---|---|---|
| −2 | 9 ± 2 | 49 ± 6 | 5 |
| −2.5 | 12 ± 1 | 68 ± 7 | 5.7 |
| −3 | 16 ± 2 | 110 ± 10 | 6.9 |
Finally, we wanted to show that the change in the device's spectral properties could translate into visual color changes. To demonstrate this, we fabricated a patterned etalon, where the patterned portion of the etalon was constructed from pH responsive microgels while the rest of the device was constructed from non-pH responsive microgels. Therefore, when a potential is applied to the device, it should only change color in the patterned region. As shown in Fig. 6, when an appropriate voltage is applied to the system, the patterned region changes color, while the background remains largely unchanged. The patterned region is capable of reverting to its initial color upon the application of the opposite potential. We acknowledge that the maple leaf pattern is not completely uniform, which may be a result of the nonuniformity of the painting protocol, e.g., some non-pH responsive microgel may be painted at the edges of the pattern. This, combined with the slight imperfections in the etalon itself, could lead to the observed imperfections. We point out here that the device's color is stable for many hours upon removal of the initial “color changing” voltage, see ESI.† We attribute the color stability to previously studied ion-dependent hysteresis.17
 | ||
| Fig. 6 Photographs of a patterned etalon in an electrochemical cell at: (a) 0 V, (b) 2 V, and (c) −2 V. | ||
In conclusion, we demonstrated that microgel-based etalons could be made to respond to the application of an electric field by incorporating pH responsive microgels into their structure. Water hydrolysis at the etalon surface upon the application of a suitable potential to the device is able to change the pH of the surrounding solution enough to make the microgels change size, changing the etalon's color as a result. The observed spectral shifts and color changes were attributed to both the etalon's sensitivity to pH and the applied potential itself. We showed that the color change is stable for many hours, until an appropriate potential is applied to make the solution pH revert to its initial value, combined with the potential-induced effect. The device color switching kinetics were also probed, and showed significant color changes on the minute time scale. In the future, we will investigate the electrochemically-triggered response of devices composed of microgels with higher pKa values, which are closer to the electrolyte solution's range of pH tunability. Furthermore, the influence of AAc content in the microgels on the color tunability will be investigated. Regardless, the devices exhibit color tunability over a large range, which is a significant step forward for photonics-based display technologies.
Experimental section
Materials
N-Isopropylacrylamide (NIPAm) was purchased from TCI (Portland, Oregon) and purified by recrystallization from hexanes (ACS reagent grade, EMD, Gibbstown, NJ) prior to use. N,N′-Methylenebisacrylamide (BIS) (99%), acrylic acid (AAc) (99%), ammonium persulfate (APS) (98+%) and lithium acetate (99%) were obtained from Aldrich (St. Louis, MO) and were used as received. Deionized (DI) water with a resistivity of 18.2 MΩ cm was used. Cr/Au annealing was done in a Thermolyne muffle furnace from ThermoFisher Scientific (Ottawa, Ontario). Fisher's finest glass coverslips were 25 × 25 mm and obtained from Fisher Scientific (Ottawa, Ontario). Indium tin oxide (ITO) coated glass slide were 25 × 25 × 1.1 mm with a resistivity of 30–60 Ω from Delta technologies. Cr was 99.999% and obtained from ESPI as flakes (Ashland, OR), while Au was 99.99% and obtained from MRCS Canada (Edmonton, AB). Spacers with thickness: 2.5 mm were purchased from Life Technologies (Eugene, OR) and cut into suitable sizes for the particular experiment. Polydimethylsiloxane (PDMS) was purchased from Dow Corning Corporation (Midland, MI).Instruments
Reflectance spectra were collected by a Red Tide USB650 spectrometer, using a reflectance probe connected to a LS-1 tungsten light source (Ocean Optics, Dunedin). The spectra were collected over a wavelength range of 400–1000 nm and analyzed by Ocean Optics Spectra Suite Spectroscopy software. pH was measured with a Jenco model 6173 pH meter (San Diego, CA).Microgel synthesis
Microgels were prepared as previously described.11 A 3-necked round bottom flask was fitted with a reflux condenser, nitrogen inlet, and temperature probe, and charged with a solution of NIPAm (11.9 mmol) and BIS (0.703 mmol) in 99 mL DI water, previously filtered through a 0.2 μm filter. The solution was purged with N2 gas and allowed to heat to 70 °C for ∼1 hour. AAc (1.43 mmol) was added to the heated reaction mixture in one aliquot. The reaction was then initiated with a solution of APS (0.2 mmol) in 1 mL of DI water. The reaction proceeded at 70 °C for 4 hours under N2 atmosphere. The resulting suspension was allowed to cool overnight, and then it was filtered through a Whatman #1 paper filter to remove any large aggregates. The microgel solution was then distributed into centrifuge tubes and purified via centrifugation at ∼8300 rcf to form a pellet, followed by removal of the supernatant and resuspension with DI water, 6×. The diameter of the microgels were ∼1 μm.11Preparation of electrochemically color tunable devices
Au coated coverslips were generated by thermally evaporating 2 nm Cr followed by 15 nm of Au onto a 25 × 25 mm ethanol rinsed and N2 gas dried glass coverslip (Fisher's Finest, Ottawa, ON) at a rate of 0.2 Å s−1, and 0.1 Å s−1, respectively (Torr International Inc., thermal evaporation system, Model THEUPG, New Windsor, NY). The Cr/Au substrates were annealed at 250 °C for 3 h (Thermolyne muffle furnace, Ottawa, ON) and cooled to room temperature prior to microgel film deposition. A 40 μL aliquot of concentrated microgels (obtained via centrifugation of a microgel solution) was added to the substrate and then spread toward each edge using the side of a micropipet tip. The substrate was rotated 90°, and the microgel solution was spread again. The spreading and rotation continued until the microgel solution became too viscous to spread due to drying. The microgel solution was allowed to dry completely on the substrate for 2 h with the hot plate temperature set to 35 °C. After that, the dry film was rinsed copiously with DI water to remove any excess microgels not bound directly to the Au. The film was then placed into a DI water bath and allowed to incubate overnight on a hot plate set to ∼30 °C. Following this step, the substrate was again rinsed with DI water to further remove any microgels not bound directly to the Au substrate surface. The samples were then rinsed with deionized water, dried with N2, and then another Au over layer (2 nm Cr for adhesion, followed by deposition of Au) was evaporated onto microgel layer. The electrochemical cell was constructed as depicted in Fig. 2a. The two electrodes (etalon and ITO substrate) were separated using a spacer and clamped together. Electrolyte solution was then injected into the gap between the two slides. Finally, two leads from a power supply were clipped to the two electrodes.Patterned etalon fabrication
PDMS elastomer was molded and cured in Petri dish. The PDMS base was first mixed with curing agent at a ratio of 10![[thin space (1/6-em)]](https://www.rsc.org/images/entities/char_2009.gif) :
:![[thin space (1/6-em)]](https://www.rsc.org/images/entities/char_2009.gif) 1 in volume. The PDMS mixture was then poured into the Petri dish, which formed a thin layer, and allowed to cure overnight at 70 °C. Finally, the PDMS layer was mechanically peeled off from the Petri dish and cut into a shape of maple leaf (12 mm × 15 mm). The prepared PDMS maple leaf pattern was used as follows. First, the PDMS mask was used to cover the Au, while pNIPAm microgels (non-pH responsive) microgels were painted on the uncovered portions of the substrate. The PDMS mask was removed and pNIPAm-co-AAc microgels were painted on the patterned area. Then following the normal etalon fabrication process described above to yield the patterned device – a maple leaf structure composed of pNIPAm-co-AAc microgels surrounded by non-pH responsive microgels.
1 in volume. The PDMS mixture was then poured into the Petri dish, which formed a thin layer, and allowed to cure overnight at 70 °C. Finally, the PDMS layer was mechanically peeled off from the Petri dish and cut into a shape of maple leaf (12 mm × 15 mm). The prepared PDMS maple leaf pattern was used as follows. First, the PDMS mask was used to cover the Au, while pNIPAm microgels (non-pH responsive) microgels were painted on the uncovered portions of the substrate. The PDMS mask was removed and pNIPAm-co-AAc microgels were painted on the patterned area. Then following the normal etalon fabrication process described above to yield the patterned device – a maple leaf structure composed of pNIPAm-co-AAc microgels surrounded by non-pH responsive microgels.
Acknowledgements
MJS acknowledges funding from the University of Alberta (the Department of Chemistry and the Faculty of Science), the Natural Science and Engineering Research Council of Canada (NSERC), the Canada Foundation for Innovation (CFI), the Alberta Advanced Education & Technology Small Equipment Grants Program (AET/SEGP) and Grand Challenges Canada. MJS acknowledges Mark McDermott for the use of the thermal evaporator.References
- J. Ge and Y. Yin, Angew. Chem., Int. Ed., 2011, 50, 1492–1522 CrossRef CAS PubMed.
- A. Tikhonov, R. D. Coalson and S. A. Asher, Phys. Rev. B: Condens. Matter Mater. Phys., 2008, 77, 235404 CrossRef PubMed.
- M. Honda, T. Seki and Y. Takeoka, Adv. Mater., 2009, 21, 1801–1804 CrossRef CAS.
- Z. Wang, J. Zhang, J. Xie, Z. Wang, Y. Yin, J. Li, Y. Li, S. Liang, L. Zhang and L. Cui, J. Mater. Chem., 2012, 22, 7887–7893 RSC.
- J. J. Walish, Y. Kang, R. A. Mickiewicz and E. L. Thomas, Adv. Mater., 2009, 21, 3078–3081 CrossRef CAS.
- H. Fudouzi and Y. Xia, Langmuir, 2003, 19, 9653–9660 CrossRef CAS.
- A. C. Arsenault, D. P. Puzzo, I. Manners and G. A. Ozin, Nat. Photonics, 2007, 1, 468–472 CrossRef CAS.
- K. Hwang, D. Kwak, C. Kang, D. Kim, Y. Ahn and Y. Kang, Angew. Chem., Int. Ed., 2011, 50, 6311–6314 CrossRef CAS PubMed.
- J. Ge, J. Goebl, L. He, Z. Lu and Y. Yin, Adv. Mater., 2009, 21, 4259–4264 CrossRef CAS.
- I. N. Heppner and M. J. Serpe, Colloid Polym. Sci., 2013, 1557–1562 CAS.
- C. D. Sorrell and M. J. Serpe, Adv. Mater., 2011, 23, 4088–4092 CrossRef CAS PubMed.
- K. C. Johnson, F. Mendez and M. J. Serpe, Anal. Chim. Acta, 2012, 739, 83–88 CrossRef CAS PubMed.
- C. D. Sorrell and M. J. Serpe, Anal. Bioanal. Chem., 2012, 402, 2385–2393 CrossRef CAS PubMed.
- M. C. Carter, C. D. Sorrell and M. J. Serpe, J. Phys. Chem. B, 2011, 115, 14359–14368 CrossRef CAS PubMed.
- M. R. Islam and M. J. Serpe, Chem. Commun., 2013, 49, 2646–2648 RSC.
- S. G. Bratsch, Standard electrode potentials and temperature coefficients in water at 298.15 K, American Chemical Society and the American Institute of Physics for the National Institute of Standards and Technology, 1989 Search PubMed.
- L. Hu and M. J. Serpe, Chem. Commun., 2013, 49, 2649–2651 RSC.
- K. Sierros, N. Morris, S. Kukureka and D. Cairns, Wear, 2009, 267, 625–631 CrossRef CAS PubMed.
- M. Raes and M. Smeets, International Symposium on Advanced Packing materials: process, properties and interfaces, IEEE, 2005 Search PubMed.
- K. Ueno, K. Matsubara, M. Watanabe and Y. Takeoka, Adv. Mater., 2007, 19, 2807–2812 CrossRef CAS.
- J. Gong, T. Nitta and Y. Osada, J. Phys. Chem., 1994, 98, 9583–9587 CrossRef CAS.
- P. Grimshaw, J. Nussbaum, A. Grodzinsky and M. Yarmush, J. Chem. Phys., 1990, 93, 4462–4472 CrossRef CAS PubMed.
- T. Tanaka, I. Nishio, S. T. Sun and S. Ueno-Nishio, Science, 1982, 218, 467–469 CAS.
- E. Kim, C. Kang, H. Baek, K. Hwang, D. Kwak, E. Lee, Y. Kang and E. L. Thomas, Adv. Funct. Mater., 2010, 20, 1728–1732 CrossRef CAS.
- J. Yan, K. Chaudhary, S. C. Bae, J. A. Lewis and S. Granick, Nat. Commun., 2013, 4, 1516 CrossRef PubMed.
Footnote |
| † Electronic supplementary information (ESI) available. See DOI: 10.1039/c4tc00271g |
| This journal is © The Royal Society of Chemistry 2014 |

