Doubly crosslinked poly(vinyl amine) microgels: hydrogels of covalently inter-linked cationic microgel particles†
Sineenat
Thaiboonrod
,
Amir H.
Milani
and
Brian R.
Saunders
*
Biomaterials Research Group, Manchester Materials Science Centre, School of Materials, The University of Manchester, Grosvenor Street, Manchester, M1 7HS, UK
First published on 19th November 2013
Abstract
Doubly crosslinked (DX) microgels are macroscopic hydrogels comprised of covalently inter-linked singly crosslinked (colloidal) microgel particles. In this study we demonstrate for the first time that DX microgels can be prepared from concentrated dispersions of singly crosslinked (SX) poly(vinyl amine) (PVAM) microgel particles. The latter were of micrometer size, cationic and contained high primary amine contents. The DX PVAM morphologies contained extensive inter-connected porosity as determined by optical microscopy and SEM. The effective porosity ranged from 76 to 93 vol% and was tuneable through microgel particle concentration. The mechanical properties of the DX PVAM microgels were investigated using dynamic rheology. The best DX PVAM microgel had a storage modulus (G′) of 41 kPa and yield strain of 46%, which are a good combination of elasticity and ductility. This gel had an internal porosity of 76 vol%. The dependence of G′ on the effective volume fraction (ϕeff) for the DX PVAM microgels was tuneable and followed the equation: G′ ∼ exp(bϕeff), with b = 16.4. The latter value indicated low particle softness. The DX PVAM gels were also injectable and could be prepared at 37 °C. Furthermore, the gel mechanical properties after swelling for 3 days at physiological pH and ionic strength were similar to those before swelling. Because these injectable DX PVAM microgels have high primary amine contents they are well suited to functionalisation and should have potential applications in areas including catalysis, composite hydrogels and biomaterials.
Hydrogels are covalently crosslinked swellable polymers and continue to attract an increasing amount of interest especially in catalysis, sensing and biomaterials applications.1–3 As their structures become increasingly complex, so too does the range of properties available. Their mechanical properties can be greatly improved by preparing composite hydrogels containing inorganic nanoparticles,4 incorporating uniform elastically effective chain lengths5 or through double network formation.6 The majority of the hydrogel research conducted to date has focused on the bottom up formation of hydrogels, i.e., co-polymerisation of monomers. There has been much less work involving construction of hydrogels from pre-formed colloid-sized gel particles (e.g., microgels). However, the latter provide a unique and exciting opportunity to manipulate the macroscopic properties of hydrogels at the colloidal size scale. Moreover, minimal chemistry is involved in transforming the fluid form of a microgel dispersion to a covalent gel, which renders this general approach potentially attractive for biomaterial use.7 Work at Manchester established a method for covalently interlinking microgel particles to form doubly crosslinked (DX) microgels,8 which is a new approach for gel formation. Microgels are crosslinked polymer colloid particles that swell when the pH approaches the pKa of the polyacid or polybase chains9 or when dispersed in a good solvent.10–12 Here, we refer to the precursor microgel particles as singly crosslinked (SX) because of the copolymerisation of di-vinyl crosslinking monomer within their structure during particle formation (Scheme 1(a)). The motivations for the present study were to demonstrate that the DX microgel formation process previously established for anionic SX microgels8 was generally applicable as well as to demonstrate that new DX PVAM microgels could be prepared at 37 °C and remain intact when swollen under physiological conditions. Here, we selected a new microgel system that had a high primary amine content13 and should provide potential to prepare a wide range of functionalised hydrogels in future work.
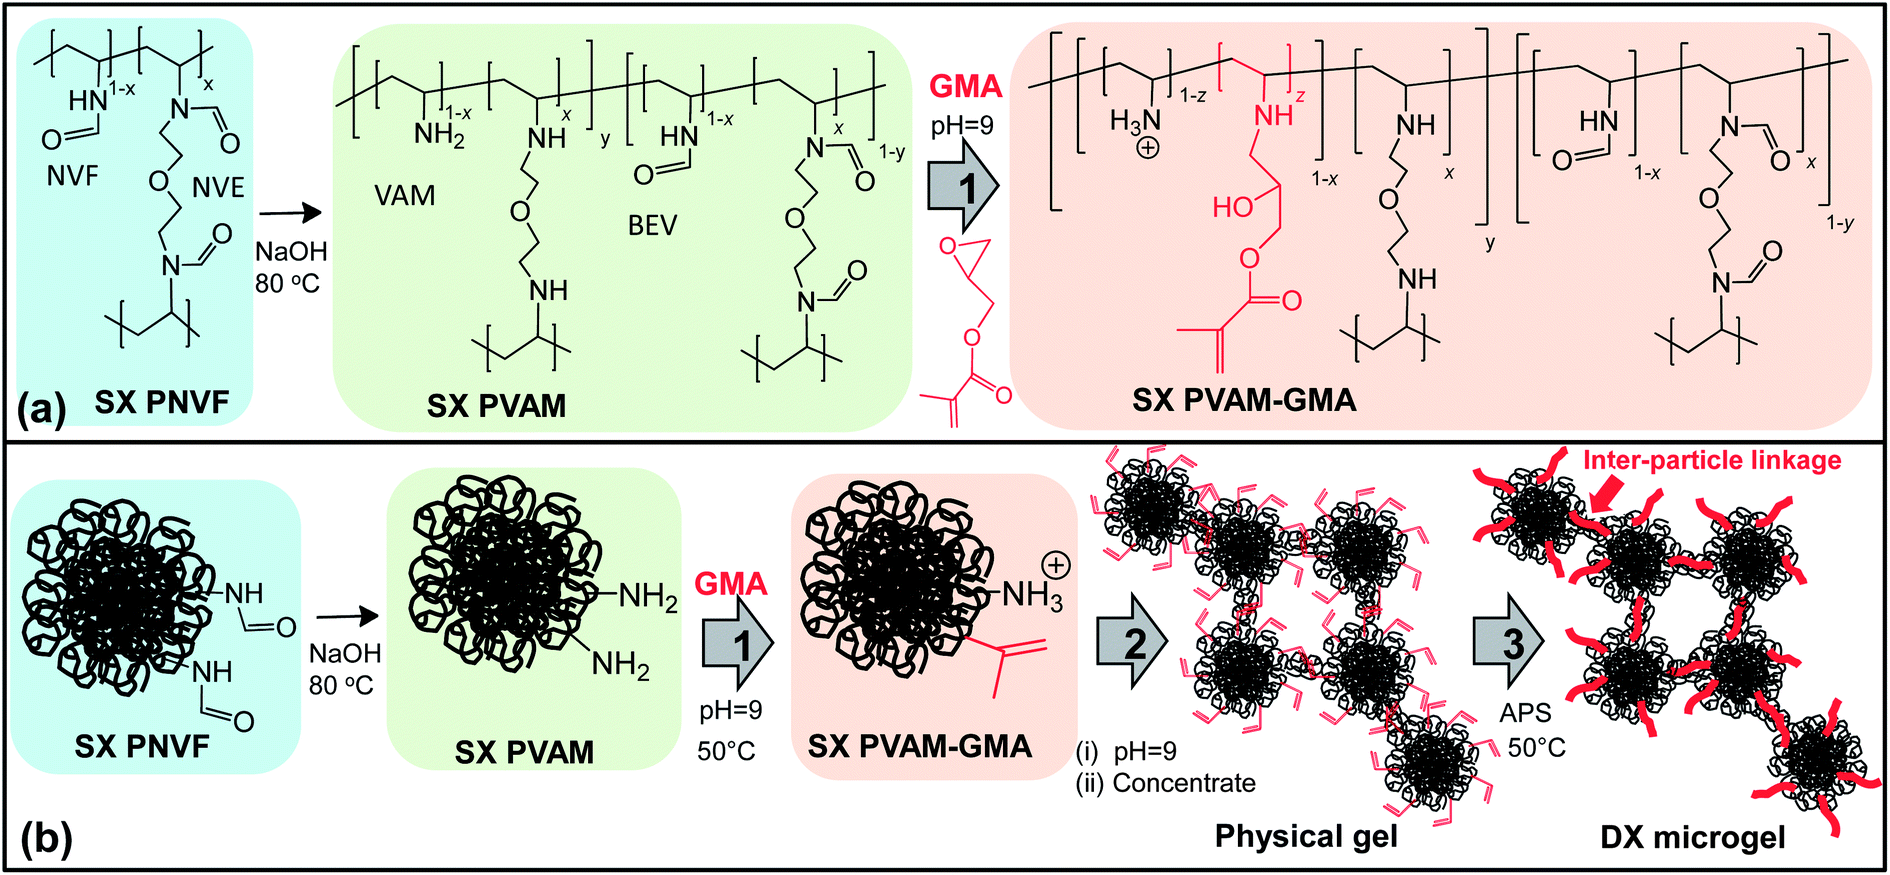 | ||
| Scheme 1 Method used for preparation of DX microgels. (a) Shows the reactions involved and (b) depicts the functionalisation of the microgel particles and DX microgel formation. Step 1 is GMA functionalisation. Step 2 is the inter-particle crosslinking (double crosslinking) of the GMA-functionalised microgels. Step 2 involved rotary evaporation of the microgel dispersion to form a physical gel of vinyl functionalised, inter-connected, particles. The neighbouring vinyl groups were then crosslinked by free-radical reaction (step 3) to produce the DX microgel. Note that BEV and APS are bis(ethyl vinyl amine)ether) and ammonium persulfate, respectively. | ||
The earliest report of a DX microgel was by Hu et al. Their approach relied upon an addition reaction of the microgel particles with epichlorohydrin within a concentrated, crystalline, SX poly(N-isopropylacrylamide-co-acrylic acid) gel. Their covalent gels consisted of inter-linked microgels and had photonic properties.14 An aggregation based DX microgel was later reported by Cho et al.15 where a linear polymer was added to the microgels prior to crosslinking. Other microgel composites have also attracted interest.16
In 2011 our group reported a simple preparation of DX microgels using glycidyl methacrylate (GMA) functionalised SX poly(methyl methacrylate-co-methacrylic acid-co-ethyleneglycol dimethacrylate) microgels.8 The latter are abbreviated here as PMMA-MAA-GMA. pH-triggered swelling of concentrated dispersions was used to prepare physical gels that consisted of inter-penetrating microgel particles. Free-radical reaction using added initiator (ammonium persulfate, APS) was used to covalently link GMA groups of neighbouring microgels to form DX microgels. The precursor dispersions were injectable and a biocompatible version was used to demonstrate load support for degenerated intervertebral discs.7 Until now, the number of these DX microgels reported to date was limited to two microgel types8,17 and both were based on anionic MAA-containing microgel particles. If the DX microgel approach is generally applicable, then it should be possible to prepare DX microgels using a cationic SX microgel system. Our recent discovery of a method to prepare high primary-amine content SX poly(vinyl amine) (PVAM) microgels13 provides the possibility for preparing DX PVAM microgels. The latter is the subject of this study. PVAM and related systems have attracted interest in the contexts of a platform for functionalisation,18 paper strengthening,19 nanoparticle reactors20 and CO2 capture.21
PVAM contains the highest primary amine content of all synthetic polymers and has a wide range of potential functionalisation reactions.18 However, it cannot be synthesised from vinyl amine. PVAM is usually produced by post-polymerisation hydrolysis, e.g. by alkali-hydrolysis of the corresponding poly(N-vinylformamide) (PNVF).18 Unfortunately, it has been difficult to prepare macroscopic PVAM hydrogels because of the necessity to subject the precursor PNVF hydrogels to alkaline hydrolysis. This can result in hydrolysis (and hence the PVAM phase) being confined to the outer surface of gel particles.22 The assembly of a macroscopic hydrogel from PNVF microgel particles that have been fully hydrolysed to PVAM is an attractive alternative to overcome this problem and was an aim of the present study. Accordingly, the present study fills an important gap for hydrogels. Because PVAM is structurally related to polyethylene imine (PEI), which has been widely investigated for delivery applications,23 there should be potential future biomaterials applications for DX PVAM microgels.
Here, we prepare physically gelled dispersions of SX PVAM microgel particles and show that it is possible to convert them into DX PVAM microgels. The method used is shown in Scheme 1. Physically gelled microgel dispersions have attracted considerable research interest.24–26 The poly(N-vinyl formamide-co-2-(N-vinylformamido)ethyl ether) microgels (abbreviated as SX PNVF) were prepared by non-aqueous dispersion polymerisation. The SX PNVF microgel was hydrolysed to poly(VAM-co-bis(ethyl vinyl amine)ether) (abbreviated as SX PVAM) using alkaline hydrolysis. Although a very high extent of hydrolysis occurred, the process was not fully complete and a minor proportion of SX PNVF remained (Scheme 1(a)). After GMA functionalisation, the dispersion of SX PVAM-GMA particles was concentrated to form a shear-thinning physical gel and then heated in the presence of APS to give a DX PVAM microgel. The DX PVAM microgels were connected by polymer bridges and this is depicted in Scheme 1(b).
The study begins by characterisation of the SX PVAM-GMA particles used to prepare the DX PVAM microgels (Scheme 1). The size of these microgel particles was larger than the previously studied SX PMMA-MAA-GMA microgel particles8 by a factor of 5, which provided the opportunity to directly study the morphology of hydrated DX microgels. The optical microscopy data enabled estimation of the effective volume fraction occupied by the microgel particles (ϕeff) within the gels. We also measured the mechanical properties of the DX PVAM microgels. A simple model was fitted to the relationship between the storage modulus (G′) and ϕeff. The injectability of the DX PVAM gels was demonstrated and the swelling behaviour at pH = 7.4 was studied. We also demonstrate that DX PVAM gels can be prepared at 37 °C. The data imply that our DX microgel preparation method is general. The new gels studied here should have potential applications which range from composite hydrogels27 and catalysis28 to biomaterials.7 Whilst polymers with very high primary amine contents can be cytotoxic, the literature shows a number of strategies that could be used to render PVAM gels cytocompatible.29,30
Experimental
Reagents
APS (purity greater than 98%), GMA (97%), N,N,N′,N′-tetramethylethylenediamine (TEMED, 99%) and ethanol (99.9%) were purchased from Aldrich and used as received. The synthesis and characterisation of NVE (2-(N-vinylformamido)ethyl ether) has been described previously.13 High purity water that was distilled and deionised was used.Preparation of SX PNVF and SX PVAM microgel
The preparation of the SX PNVF and SX PVAM microgels was described in detail earlier.13 SX PNVF particles containing 9 mol% NVE were prepared in latex form by non-aqueous dispersion polymerisation in ethanol. The particles were redispersed in water to give a microgel dispersion. SX PVAM microgel was prepared by alkaline hydrolysis of SX PNVF particles in aqueous NaOH solution (1 M) at 80 °C under a nitrogen atmosphere for 16 h. The hydrolysed dispersions (SX PVAM) were purified using sequential dialysis against phosphate buffered saline, aqueous 0.15 M NaCl and water, respectively.Preparation of SX PVAM-GMA microgel
The SX PVAM microgel was vinyl-functionalised using GMA. SX PVAM (50 g, ϕhs = 0.015) containing 0.19 g. of added GMA was heated to 50 °C at a pH of 9 with mechanical stirring for 24 h. Note that ϕhs is the hard sphere volume fraction. The GMA-functionalised dispersion was washed three times with chloroform to remove unreacted GMA.Preparation of SX PVAM and SX PVAM-GMA physical gels
SX PVAM or SX PVAM-GMA microgel was concentrated from a dilute dispersion (ϕhs of 0.015) to the required ϕhs value using rotary evaporation at 32 °C. Unless otherwise stated the preparation pH was 9.0 and the final ϕhs value was 0.10.Preparation of DX PVAM microgel
DX microgels were prepared from SX PVAM-GMA. Briefly, aqueous APS solution (0.31 mL, 1 wt%) was added to SX PVAM-GMA (10 g, 1.5 wt%) at pH = 9 with vigorous mixing for about 5 min before rotary-evaporation was used at 32 °C to concentrate the dispersion. Then, the physical gel (shear-thinning) was placed in an O-ring (internal diameter = 19 mm, thickness = 2.2 mm) between two clean microscope slides, sealed and heated in an oven at 50 °C for 24 h. The ϕhs value used was 0.10 unless otherwise stated.In the case of the injectable DX PVAM system the same procedure was used as described above. However, in this case 0.40 mL of TEMED was added with the APS solution and rotary evaporation was conducted at 30 °C to give ϕhs of 0.15. The physical gel was injected into the sealed O-ring/microscope slide arrangement discussed above and then cured at 37 °C for 24 h.
Physical measurements
Optical microscopy was conducted with an Olympus BX41 microscope. Fast Fourier Transformation (FFT) of the images was obtained using Image J (National Institute of Health). Photon correlation spectroscopy (PCS) measurements were performed using a BI-9000 Brookhaven light scattering instrument (Brookhaven Instrument Cooperation), fitted with a 20 mW HeNe laser and the detector was set at a scattering angle of 90°. SEM measurements were obtained using a Philips FEGSEM instrument. The gels were freeze-dried using liquid nitrogen and coated with platinum. In the case of dilute dispersions, the particles were deposited from aqueous dispersions. Dynamic rheology measurements were performed using a TA Instruments AR G2 temperature-controlled rheometer with an environmental chamber. A 20 mm diameter plate geometry with a solvent trap was used. The gap was 2000 μm. For the strain-amplitude measurements a frequency of 1 Hz was used. A strain of 0.1% was used for the frequency-sweep measurements.Results and discussion
GMA functionalised microgel composition and properties
Because the vinyl-functionalised SX PVAM-GMA microgel is new it was important to establish its composition and properties prior to considering the DX PVAM microgels. The SX PVAM-GMA microgel was prepared in two steps starting from SX PNVF, or in one step from SX PVAM (Scheme 1(a)). The compositions for SX PVAM-GMA and SX PVAM are shown in Table 1 and the general structures appear in Scheme 1(a). The values for x, y and z were determined from elemental analysis data (Table S1, ESI†) using the ratios of the %N to %C values, i.e., RNC. The procedures and equations used are described in the ESI. SX PNVF microgel contained x = 0.09, as calculated from elemental analysis data (ESI). The preparation of SX PVAM resulted in high conversion with approximately 84 mol% of the NVF segments being hydrolysed to VAM (i.e., y = 0.84) (Table 1). The SX PVAM-GMA microgel had a calculated GMA content of 13 mol%. This value is within the range of vinyl contents reported for anionic vinyl-functionalised microgels.7,8| Sample | Compositiona | Mol% Hydr.b | Mol% GMAc | M rep/(g mol−1)d | R NC |
|---|---|---|---|---|---|
| a Calculated from elemental analysis data using equations shown in the ESI. b The extent of hydrolysis was 100y. c Extent of GMA functionalisation. d Calculated molar mass of repeat unit using the values for x, y and z. e R NC = %N/%C, where the latter values were obtained by elemental analysis (see Table S1, ESI). The error for these values was ±0.001. | |||||
| SX PVAM | [PVAM0.91–BEV0.09]0.84–[PNVF0.91–NVE0.09]0.16 | 84.0 | 0 | 60 | 0.472 |
| SX PVAM-GMA | [PVAM0.76–(VAM-GMA)0.15–BEV0.09]0.84–[PNVF0.91–NVE0.09]0.16 | 84.0 | 13.0 | 78 | 0.350 |
The compositions of the microgels were also studied using FTIR spectroscopy (Fig. S1, ESI†). The spectrum for SX PVAM showed bands due to RNH2 at31 1590, 3350 and 3275 cm−1 and contrasted to that for SX PNVF. Although a unique band for C![[double bond, length as m-dash]](https://www.rsc.org/images/entities/char_e001.gif) C groups32,33 was present in the spectrum of GMA at 1637 cm−1 (Fig. S1, ESI†), the band overlapped a strong band in the SX PVAM spectra and prevented a unique FTIR assessment for vinyl groups in SX PVAM-GMA. A weak band was evident at 1715 cm−1 in the spectrum for SX PVAM-GMA, which was due to ester groups of GMA (Fig. S1†) and supports incorporation of GMA. Furthermore, the epoxide band at34 905 cm−1 was absent in the SX PVAM-GMA FTIR spectrum implying reaction of those groups upon GMA incorporation and subsequent removal of unreacted GMA by the washing procedure employed.
C groups32,33 was present in the spectrum of GMA at 1637 cm−1 (Fig. S1, ESI†), the band overlapped a strong band in the SX PVAM spectra and prevented a unique FTIR assessment for vinyl groups in SX PVAM-GMA. A weak band was evident at 1715 cm−1 in the spectrum for SX PVAM-GMA, which was due to ester groups of GMA (Fig. S1†) and supports incorporation of GMA. Furthermore, the epoxide band at34 905 cm−1 was absent in the SX PVAM-GMA FTIR spectrum implying reaction of those groups upon GMA incorporation and subsequent removal of unreacted GMA by the washing procedure employed.
The sizes of the SX PVAM-GMA and SX PVAM microgels were measured using optical microscopy, SEM as well as PCS. Both SX PVAM-GMA (Fig. 1(a)) and SX PVAM (Fig. S2(a), ESI†) particles had number-average diameters of 1.48–1.52 μm as determined by optical microscopy (Dn(Opt), Table 2). Fig. 1(b) shows a representative SEM image for deposited SX PVAM-GMA particles. They were spherical and monodisperse. (An SEM image for the precursor SX PVAM microgel particles are shown in Fig. S2(b).†) The number-average diameters determined by SEM (Dn(SEM)) for SX PVAM-GMA and SX PVAM were close to 1.0 μm. These values were smaller than the respective Dn(Opt) values due to particle collapse that occurred during SEM sample preparation and measurement where high vacuums were used.
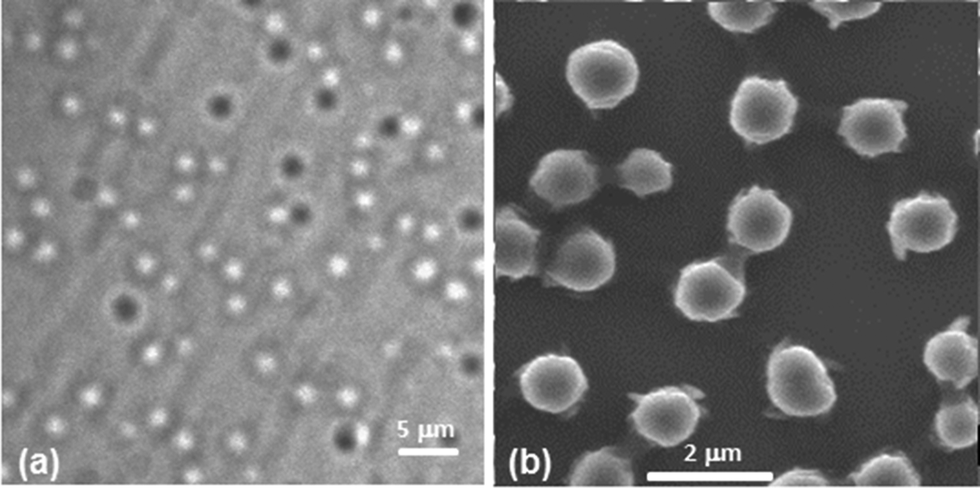 | ||
| Fig. 1 Optical microscopy and SEM images for various microgels. Optical microscopy (a) and SEM (b) images for SX PVAM-GMA particles. The microgel particles (white spheres) were dispersed in water at pH = 7 for (a) and were deposited from aqueous dispersion at pH = 9 for (b). | ||
| Sample | D n(Opt) /μm | D n(SEM)c/μm | d h /μm | d h(c) * /μm | Q p | μ /10−8 m2 V−1 s−1 |
|---|---|---|---|---|---|---|
| a The numbers after the ± symbols for optical microscopy and SEM are the standard deviations. b Number-average diameter determined from optical micrographs at pH = 7. c Number-average diameters determined from SEM images. d Hydrodynamic diameter measured at pH = 7. e Collapsed hydrodynamic diameters calculated using eqn (2). f Particle swelling ratio calculated at pH = 7 from eqn (1). g Electrophoretic mobility measured at pH = 7. | ||||||
| SX PVAM | 1.52 ± 0.13 | 0.98 ± 0.07 | 1.31 ± 0.038 | 0.59 ± 0.017 | 10.9 ± 0.9 | 3.60 ± 0.2 |
| SX PVAM-GMA | 1.48 ± 0.12 | 1.08 ± 0.10 | 1.38 ± 0.040 | 0.64 ± 0.019 | 10.0 ± 0.8 | 3.33 ± 0.2 |
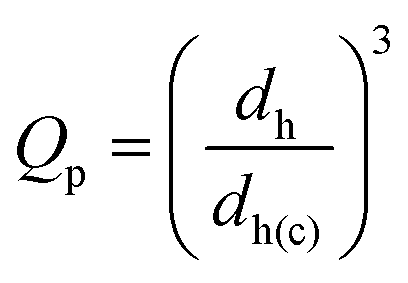
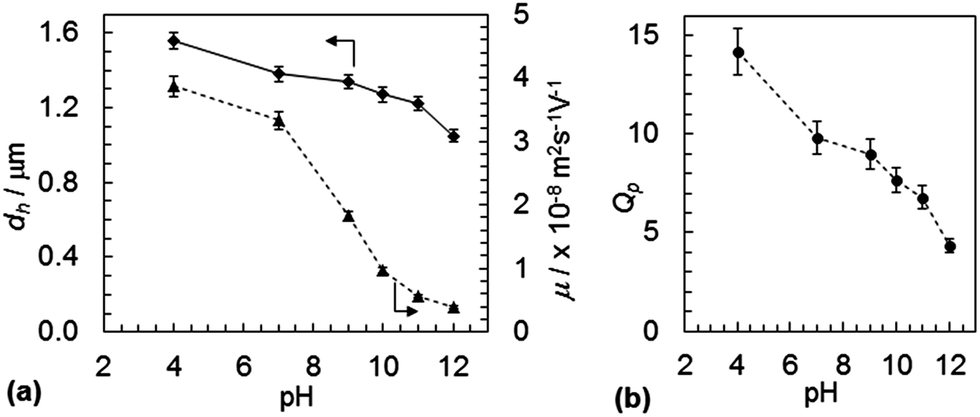
The variation of dh with pH for SX PVAM-GMA is shown in Fig. 2(a). (Data for the pre-cursor SX PVAM particles are shown in Fig. S3(a).†) The pKa for PVAM has been reported as35 10.0. The SX PVAM-GMA particles showed significant pH-triggered swelling as the pH approached 10 from higher values, which is due to protonation of the primary amine groups. The particle volume swelling ratio, Qp, is an important parameter for microgels and can be calculated using
 | (1) |
 | ||
| Fig. 2 pH-dependent properties for SX PVAM-GMA microgel particles. (a) Shows the variations of the hydrodynamic diameter and electrophoretic mobility with pH. (b) Shows the pH-dependence of the particle swelling ratio (see text). | ||
The dh(c) value for SX PNVF (dh(c,PNVF)= 0.66 μm) of the as-made particles in latex form dispersed in ethanol13 was used to estimate dh(c) values for SX PVAM and SX PVAM-GMA. This was an appropriate value to use because ethanol is a poor solvent for PNVF and the SX PNVF particles were not in contact with water prior to the PCS data in ethanol being measured. We term the estimated dh(c) value as d*h(c). Values for d*h(c) for SX PVAM-GMA (and SX PVAM) were estimated from eqn (2). This equation corrected for the respective particle mass losses due to hydrolysis (based on their compositions) and used their repeat unit molar masses (Mrep, Table 1).
 | (2) |
Eqn (2) was derived assuming the number of repeat units per particle did not change due to hydrolysis and that the polymer density was 1.0 g cm−3. The calculated value for Mrep(PNVF) was 84 g mol−1 based on its composition (see above). The d*h(c) values correspond to the fully collapsed particles dispersed in ethanol and appear in Table 2. The values for dh(c,PNVF) and d*h(c) enabled values of Qp for SX PVAM-GMA (and SX PVAM) to be calculated from eqn (1) using dh(c) = d*h(c). Fig. 2(b) shows the variation of Qp with pH. The microgel particle swelling that occurred at pH values less than 7 may have been due to protonation of BEV. The latter is the hydrolysis product of NVE (Scheme 1(a)).
The electrophoretic mobility (μ) vs. pH data are also shown in Fig. 2(a). The mobility increased with decreasing pH, as expected, which was due to increased protonation of the microgel particles. Although there was general agreement between the trends for dh and μ with pH, major differences in the relative changes were apparent in the pH region of 7 to 10. Exact agreement between the changes in hydrodynamic diameter (a whole particle measurement) and electrophoretic mobility (an outer shell sensitive parameter) is often not obtained for microgels.36 This is due in part to the multiple parameters that contribute to the mobility of charged microgels.37 Importantly, the present data show that the SX PVAM-GMA microgel particles were positively charged over the pH range of 4 to 12. Comparable data were obtained for the SX PVAM microgels (see Fig. S3(a)†). It is highly likely that the DX PVAM microgels were positively charged because their preparation only involved free-radical crosslinking of a minor proportion of GMA groups (Scheme 1).
DX PVAM microgel morphology
The preparation of DX PVAM microgels required use of relatively high ϕhs (≥0.05) SX PVAM-GMA dispersions in the presence of added APS. Those dispersions formed reversible physical gels unless covalently interlinked (below). Rotary evaporation was an effective method for providing shear-thinning (injectable) physical gels with high ϕhs values and DX PVAM microgels were prepared from concentrated SX PVAM-GMA physical gels by free-radical reaction (Scheme 1). The presence of interparticle crosslinking for DX PVAM microgels was tested by placing a gel in aqueous 0.1 M NaCl solution (pH = 7) for 24 h (Fig. 3(a)). A SX PVAM-GMA physical gel (no APS added) was used as a control. The latter re-dispersed; whereas, the DX PVAM microgel did not. This test demonstrated that a DX microgel had been successfully prepared.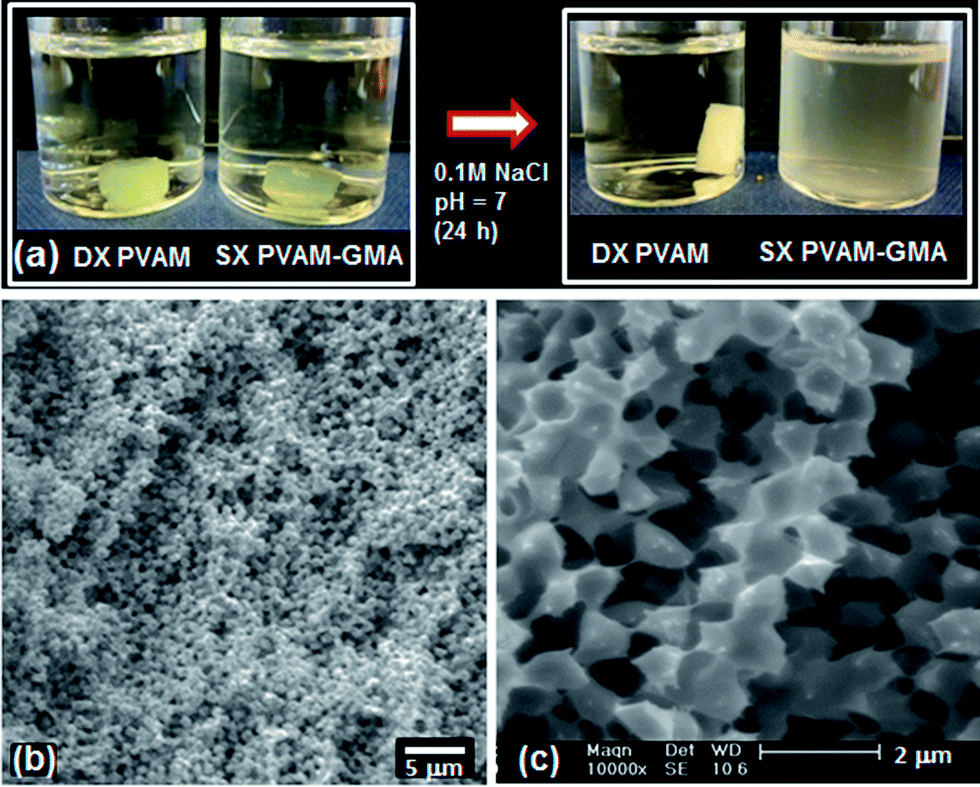 | ||
| Fig. 3 DX PVAM microgel dissolution test and morphology (a) shows images for DX PVAM microgel and physical gel of SX PVAM-GMA particles. Both samples were heated at 50 °C for 24 h prior to the dissolution experiment. (b) and (c) Show SEM images for DX PVAM. The value for ϕhs was 0.10. | ||
The DX and SX PVAM-GMA microgels had a yellow colour (Fig. 3(a)). The colour was evident for SX PVAM-GMA or PVAM gels heated with APS. For the latter, the yellow colour could be due to the oxidation of VAM groups by persulfate to give imine groups.38 In the case of GMA, the formation of imine groups by reaction of CO groups with primary amines is possible.39 The FTIR spectrum for DX PVAM (Fig. S4, ESI†) was similar to that for SX PVAM-GMA (Fig. S1, ESI†) confirming that the DX PVAM microgel was primary-amine rich and maintained its structural integrity upon double crosslinking. This was supported by elemental analysis data (Table S1, ESI†) which showed the same RNC value as SX PVAM-GMA.
We investigated the morphologies of freeze-dried DX PVAM microgels using SEM (see Fig. 3(b) and (c)). The SEM images clearly show space-filling, highly porous, particulate morphologies. The inter-connected, 3-dimensional, porosity present was of the order of micrometers in size. (SEM images for SX PVAM-GMA showed similar morphologies – see Fig. S5, ESI.†) This is different to the more homogeneous morphologies observed for anionic DX microgels.7 The higher magnification image (Fig. 3(c)) shows that the particles within the gels were connected to each other via polymer bridges. The bridges are proposed to act as elastically effective links that distribute load. The bridges for the DX PVAM microgel contained covalent linkages and opposed re-dispersion when placed in water (Fig. 3(a)).
The morphologies of the gels were also examined using optical microscopy (Fig. 4). These optical images are the first reported that show the morphology of a DX microgel in the hydrated state. The polymer bridges between neighbouring particles identified by SEM (above) can also be seen from the higher magnification optical image (Fig. 4(b)). The optical images also show evidence of local ordered packing. The face of a square-like lattice is sketched on top of four particles in Fig. 4(b). A FFT of the optical image is shown in Fig. 4(c), which reveals a central amorphous ring surrounded by points in a square-like arrangement (indicated with arrows). The latter is suggestive of square symmetry in the x–y plane. (Similar features were also apparent from optical images and FFT for SX PVAM – see Fig. S6, ESI.†) This demonstrates that the occasionally locally ordered lattices were present globally. The square-like arrangements were slightly stretched in the y direction. Microgels have been reported to have face-centred cubic lattices40 and can also form body centred tetraganol lattices (BCT) when subjected to an external field.41 Unfortunately, our optical images do not permit a clear assignment of the 3-dimensional unit cell.
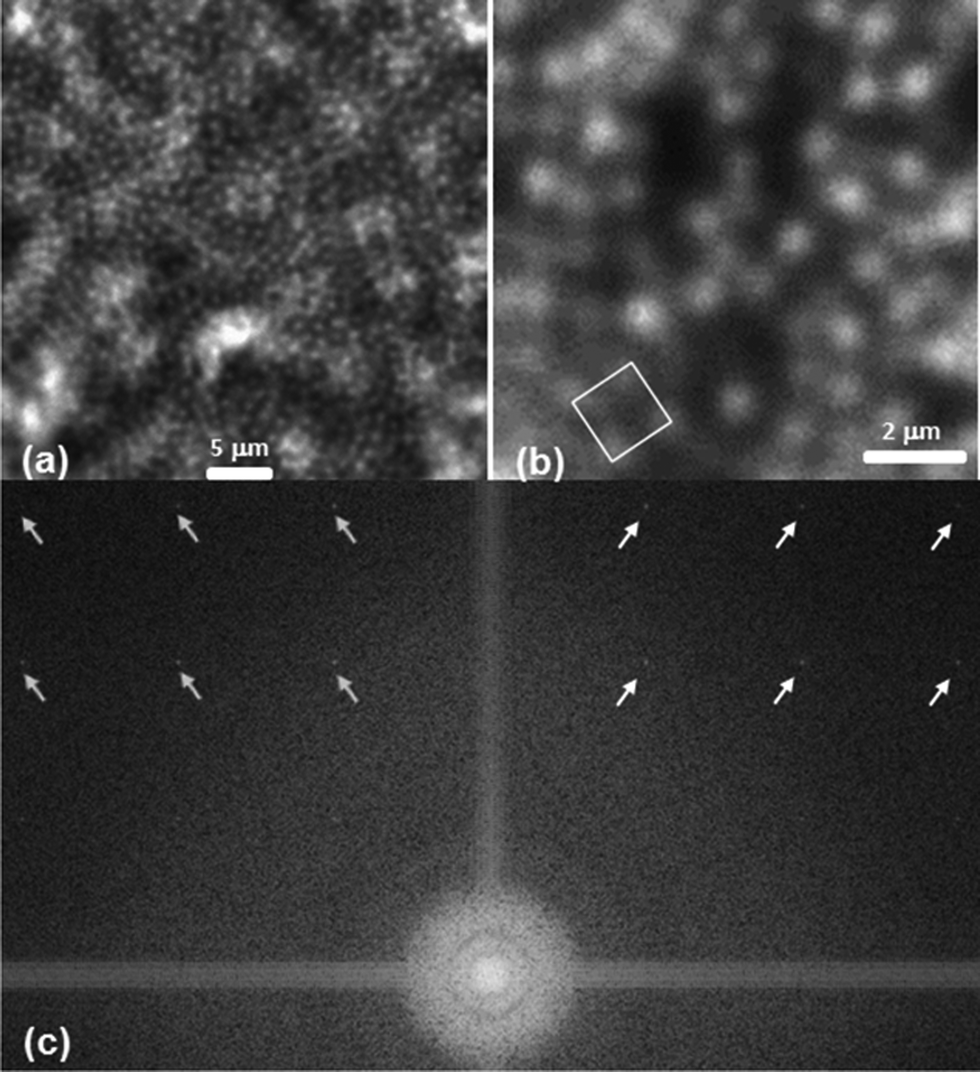 | ||
| Fig. 4 Morphologies of DX PVAM gel in the hydrated state. Optical micrographs are shown in (a) and (b). (c) Shows an FFT image from (a). The arrows highlight some of the bright points present (ϕhs = 0.10). | ||
In this study DX PVAM gels were prepared using a range of ϕhs values. Because particle sizes could be measured from the optical micrographs they provided an opportunity to estimate ϕeff for the gels. This was achieved by calculating Qp and applying the following equation.
| ϕeff = Qpϕhs | (3) |
We applied the same approach to calculate Qp from the gel optical micrographs as used above for the PCS data (eqn (1) and (2)). Accordingly, a value for the collapsed diameter of the microgel particles determined from optical microscopy, D*n(c,Opt), was required. Optical micrographs for the precursor PNVF particles dispersed in ethanol (see Fig. S7†) yielded the collapsed particle size determined by optical microscopy, Dn(c,PNVF,Opt) = 0.78 μm. The latter enabled D*n(c,Opt) values to be calculated using an equation equivalent to eqn (2). The calculated D*n(c,Opt) values for SX PVAM-GMA and SX PVAM particles were 0.76 and 0.70 μm, respectively. The former value was used to calculate Qp values from measured Dn(Opt) values (Fig. 5(a)) using an equation equivalent to eqn (1). Hence, ϕeff was then calculated for each ϕhs value using eqn (3). The latter data appear in Fig. 5(b). The same analysis methodology was applied for the PVAM gels and the Dn(opt), Qp and ϕeff data are shown in Fig. S8.†
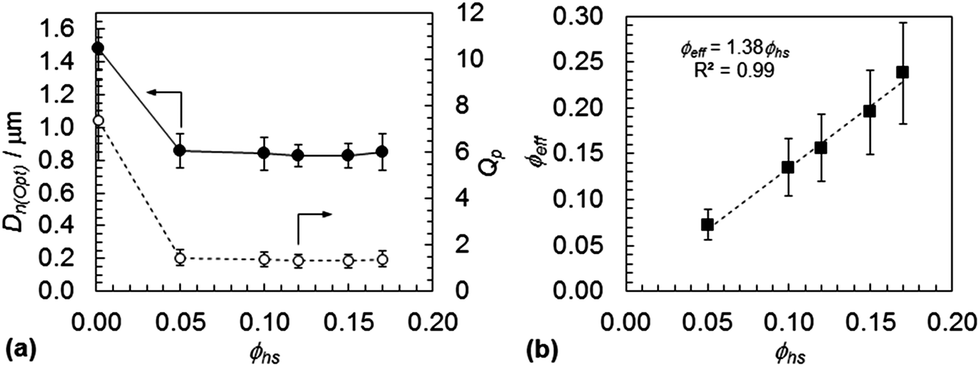 | ||
| Fig. 5 Particle size and swelling dependences on polymer volume fraction for DX PVAM microgels. (a) Shows the variation of the particle size and particle swelling ratio with ϕhs. (b) Shows the calculated variation of the effective polymer volume fraction with ϕhs. | ||
The microgel particle size decreased strongly from the dilute dispersion value when incorporated into the gels (Fig. 5(a) and S8(a)†). External electrolyte is well known to cause osmotic deswelling of polyelectrolyte microgel particles.42 For the present systems the maximum ionic strength due to PVAM microgel particles at ϕhs = 0.05 can be estimated as 0.4 M and this would have been an increasing function of ϕhs. Therefore, the decrease in Dn(opt) for the microgels within the gels is attributed to osmotic deswelling caused by the high ionic strength of the external water phase due to the mobile ions that originated from the microgel particles.
A high ionic strength coupled with low Qp values (Fig. 5(a)) could have led to some particle aggregation within the gels prior to DX formation. Particle–particle contacts would then form a space-filling network. Although the gels appeared visually homogeneous (Fig. 3(a)), particle networks with bridges between particles was apparent from SEM and optical microscopy images for the DX PVAM and SX PVAM gels (Fig. 3(c), 4(b), S5(b) and S6(b)†). Furthermore, the ϕeff values (Fig. 5(b)) were low compared to values for a cubic lattice (0.52) or randomly close packed lattice (0.64). This is because the microgel particles were not fully swollen in the gels. Rather, they formed space-filling networks with porosity between interconnected particle chains. The ϕeff values increased linearly with ϕhs for the gels (Fig. 5(b)). Consequently, the effective porosity of the DX PVAM gels (= 1 − ϕeff) could be tuned from 76 to 93 vol% simply using ϕhs.
DX PVAM microgel mechanical properties
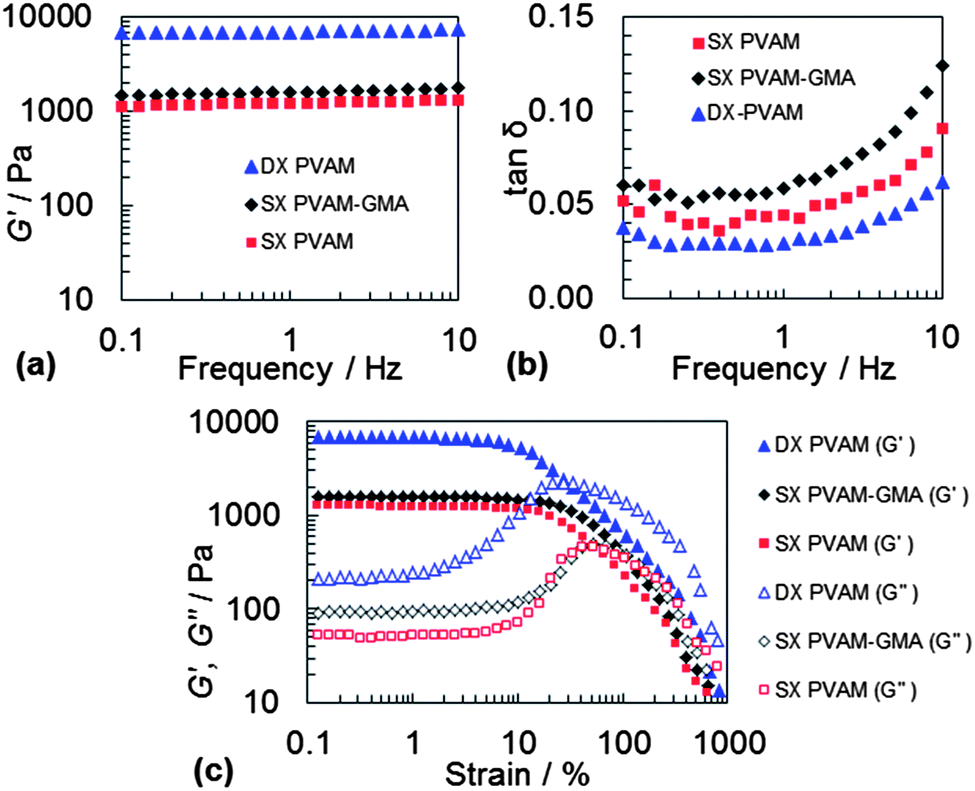
In this study the DX PVAM microgels were prepared and studied using a pH of 9.0. The gels would have been positively charged based on the μ values for the SX PVAM-GMA particles (Fig. 2(a)). The mechanical properties were probed using dynamic rheology. Frequency-sweep rheological data are shown for the DX PVAM microgel in Fig. 6(a) and (b). Data for the SX PVAM and SX PVAM-GMA physical gels are shown for comparison. All of these systems were heated at 50 °C for 24 h. The DX PVAM microgel showed low frequency dependences for both G′ (storage modulus) and tan![[thin space (1/6-em)]](https://www.rsc.org/images/entities/char_2009.gif) δ (= G′′/G′, G′′ is the loss modulus). Nearly frequency-independent G′ values have been reported for a range of colloidal gels.43 For the present systems, this implies the DX PVAM system behaved as the most elastically ideal network.44 We propose that double crosslinking decreased the proportion of elastically ineffective structures, such as loops and dangling chains. This conjecture is supported by the significantly lower tanδ value for DX PVAM compared to SX PVAM (Table 3). The latter system was not capable of forming covalent interparticle linkages.
δ (= G′′/G′, G′′ is the loss modulus). Nearly frequency-independent G′ values have been reported for a range of colloidal gels.43 For the present systems, this implies the DX PVAM system behaved as the most elastically ideal network.44 We propose that double crosslinking decreased the proportion of elastically ineffective structures, such as loops and dangling chains. This conjecture is supported by the significantly lower tanδ value for DX PVAM compared to SX PVAM (Table 3). The latter system was not capable of forming covalent interparticle linkages.
 | ||
| Fig. 6 Dynamic rheology data for a range of gels. Frequency-sweep ((a) and (b)) and strain-amplitude ((c)) dynamic rheology data for various gels (ϕhs = 0.10). | ||
The G′ value for DX PVAM was a factor of 4.2 greater than the value for SX PVAM-GMA (Table 3). This increase is due to additional elastically effective chains from covalently crosslinked GMA groups. Each PVAM-GMA microgel particle within the DX PVAM microgel acts as a covalent crosslinking centre via the GMA groups. The value of G′ for SX PVAM-GMA was significantly higher than the value for SX PVAM (Table 3). This increase may be due to some covalent inter-particle crosslinking for SX PVAM-GMA because air was not excluded during the heating process. In addition, there was a contribution to the elasticity for both the SX PVAM-GMA and SX PVAM gels from reversible particle–particle connections that were present. The tanδ values for the DX PVAM system were typically less than or equal to 0.065, and the lowest of the gels (Table 3 and Fig. 6(b)). About 95% of the energy from the applied shear was stored elastically within the DX PVAM microgel network.
Strain-sweep data were also obtained for the DX microgel and the two physical gels (see Fig. 6(c)). At strains greater than about 10% the G′ values decreased, which is an indication of the onset of strain-induced network failure. In each case the G′ data crossed the G′′ data at the maximum G′′ value. At the cross-over points G′ = G′′ (i.e., tanδ = 1.0) and those γ values are the critical yield strains (γc). At higher γ values more energy was lost through dissipation than energy storage. The value for γc was highest for the physical gels (SX PVAM and SX PVAM-GMA) and decreased to 30% for the DX microgel (Table 3). The high γc value of 100% for SX PVAM-GMA physical gel was unexpected. This may be due to a low level of inter-particle crosslinking that could have occurred within that system during rotary evaporation.
It can be seen from Fig. 6(c) that there were significant differences for the G′′ data for the DX PVAM and SX PVAM systems. The DX PVAM G′′ maximum has a larger breadth. This is proposed to be due to the presence of a range of relatively short inter-particle linkages that were broken over a wide range of strains. By contrast the G′′ maxima for the SX PVAM and SX PVAM-GMA systems were more narrow and similar, implying equivalent viscoelastic behaviours for those systems. Double crosslinking significantly changed the strain-induced network failure mechanism.
Effect of polymer volume fraction on DX PVAM microgel mechanical properties
In order to learn more about the origins of the DX PVAM elasticity and establish potential for tuning the mechanical properties we investigated the effect of ϕhs and ϕeff on the dynamic rheological properties. The frequency sweep G′ data are shown in Fig. 7. The G′ data showed low frequency dependencies. Fig. 7(b) shows the variation of tanδ with ϕhs for both systems. The frequency dependence for tanδ (i.e., range of the tanδ values at each ϕhs) decreased with increasing ϕhs. This was lowest for the DX microgel containing the highest microgel content, i.e., ϕhs = 0.17. The SX PVAM gels were also studied and they showed generally higher tanδ values and frequency dependence (see Fig. S9†) for a given ϕhs value. The combination of the low tanδ values and low frequency dependence for the DX PVAM gels imply that double crosslinking produced a network with relatively few elastically ineffective loops and trains.
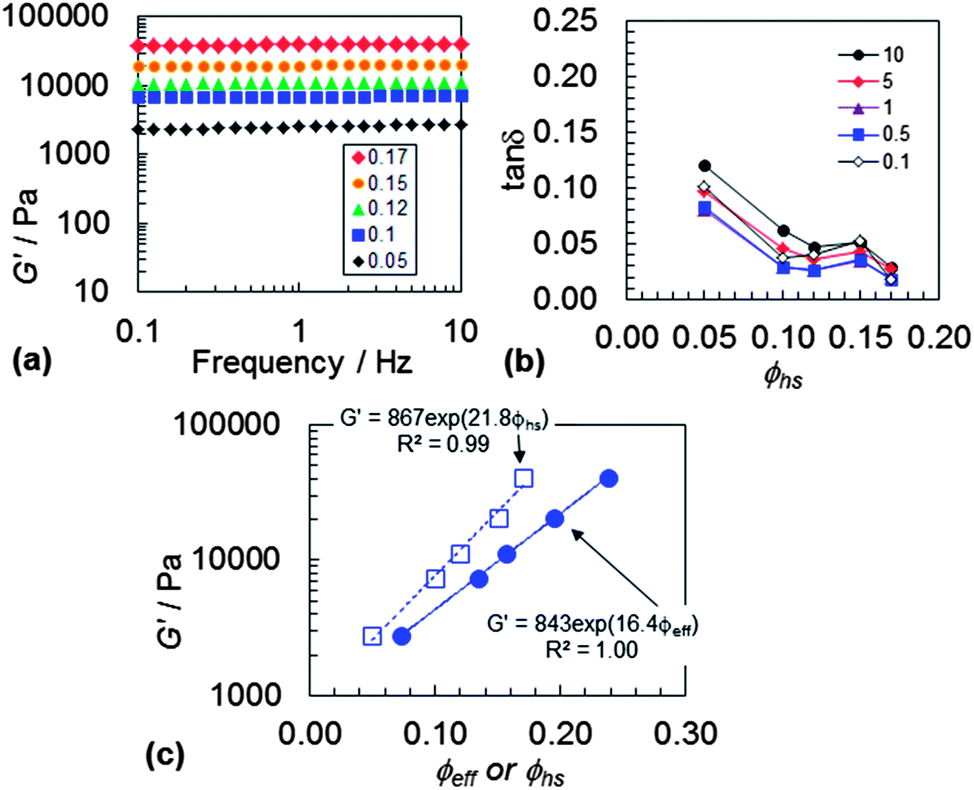 | ||
| Fig. 7 DX PVAM frequency sweep data. (a) Shows the frequency dependence for G′. (b) Shows the variation of tanδ with ϕhs at different frequencies which are shown in the legend in Hz. (c) Shows the variation of G′ with ϕhs and ϕeff plotted in semi-logarithmic form. | ||
Fig. 7(c) shows the variation of G′ plotted as a function of ϕhs and ϕeff for DX PVAM microgel. Both sets of data show exponential relationships for G′. Although an exponential dependence for G′ on ϕeff does have a theoretical basis,45 this is less clear for our DX PVAM microgels in the case of ϕhs. Those data and the exponential fit for ϕhs are shown here because they provide a practical tool to tune the elasticity for future DX PVAM gels. The G′ value was tuneable over more than an order of magnitude (2–41 kPa).
Zong et al.46 studied the mechanical properties for colloidal glasses of binary mixtures of poly(styrene-co-NIPAM) microgels. From their work, eqn (4) was applied to the rheological data for our DX PVAM microgels.
| G′ = a exp(bϕeff) | (4) |
The parameter b is a measure of particle softness46 and a is a pre-exponential constant. A relationship of this general type has also been predicted for particle–particle suspensions using mode coupling theory.45 Here, the data for DX PVAM microgel (Fig. 7(c)) gave a b parameter of 16.4. This value is comparable to the value of 13.8 reported for binary microgel mixtures.46 Our DX PVAM gels can be considered as a gel consisting of attractive particle–particle contacts which are strengthened by covalent crosslinking. Our b value is lower than the theoretical limit of 26 for hard-sphere systems45 and higher than the value of b = 9 for silica with long poly(dimethylsiloxane) grafts.45 Accordingly, the PVAM microgel particles have low softness within the DX PVAM gels. This is congruent with their relatively low Qp values of about 1.4 (Fig. 5(a)). We note that the data for the SX PVAM gel did not follow an exponential relationship (Fig. S9(c)†), which indicates major differences in the elasticity mechanisms that were operative for each system. These differences are due to double crosslinking within DX PVAM.
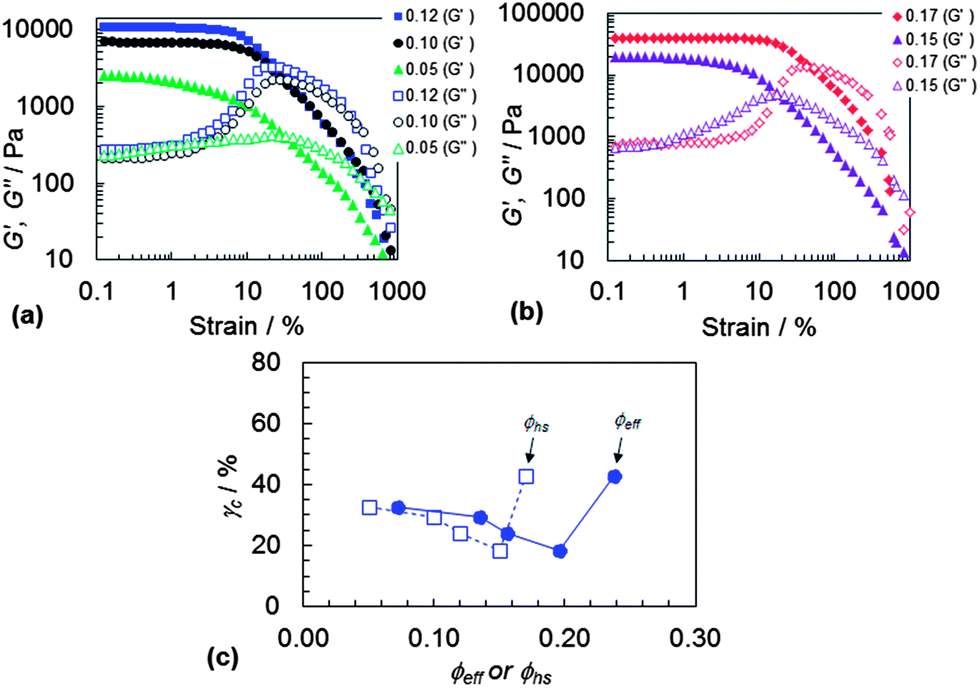
The strain-sweep rheological data for the DX PVAM gels obtained using a range of ϕhs values are shown in Fig. 8. (Strain-sweep data for the SX PVAM gels are shown in Fig. S10.†) The G′ data show strain induced decreases due to network disruption which began at a strain of about 10% for the gels prepared with ϕhs values greater than or equal to 0.10. There was no evidence for more than one distinct maximum within each DX PVAM data set and this is consistent with the view that there was one general network breaking process that occurred over a wide range of strain values. This was most likely bond breaking based on the three-dimensional particle network morphologies observed from the images shown in Fig. 3 and 4.
 | ||
| Fig. 8 DX PVAM strain-sweep data. (a) and (b) Show the variation of G′ and G′′ with strain at different ϕhs values (legend). (c) Shows the variation of the yield strain with ϕhs and ϕeff. | ||
The strain-sweep data enabled determination of γc values and the data are plotted as a function of both ϕhs and ϕeff in Fig. 8(c). A gradual decrease for γc with increasing ϕhs or ϕeff is evident which is followed by an unexpected (but reproducible) increase. The gradual decrease in γc is explainable in terms of an increasingly highly crosslinked network with shorter elastically effective chains. However, the increase for γc (to 46%) at the highest ϕhs or ϕeff values requires further comment. This system had a higher γc value than the SX PVAM microgel equivalent (Fig. S10(c), ESI†). For conventional hydrogels a more narrow distribution of linkage lengths results in relatively high yield strains.47 We speculate that an increase in overall order occurred for this system (ϕhs = 0.17) due to a higher ϕeff which caused the elastically effective chain lengths to become more uniform. We note that this system also had the lowest frequency dependent tanδ values for all the DX PVAM microgels studied (Fig. 7(b)), implying a more interconnected network. FFT analysis of those gels did show square-like lattice symmetry. Unfortunately, it was not possible to be certain from the optical images whether the relative proportion of ordered phase had increased for ϕhs = 0.17.
Injectable DX PVAM gels swollen at physiological pH
One potential application for future DX PVAM microgels is an injectable biomaterial for soft tissue repair. Two desirable properties for gels as biomaterials are the ability to be injected through a syringe needle and then to form a gel at 37 °C. The DX PVAM gels studied in this section were prepared using added TEMED in order for them to be crosslinked at 37 °C. Here, we demonstrated that a representative DX PVAM precursor physical gel was sufficiently shear-thinning to be injectable through a narrow gauge syringe (Fig. 9(a)). The digital photograph shows a shear-thinning SX VAM–GMA physical gel (containing APS and TEMED) being injected through a syringe needle. The DX PVAM gel was subsequently formed at 37 °C (Fig. 9(a)).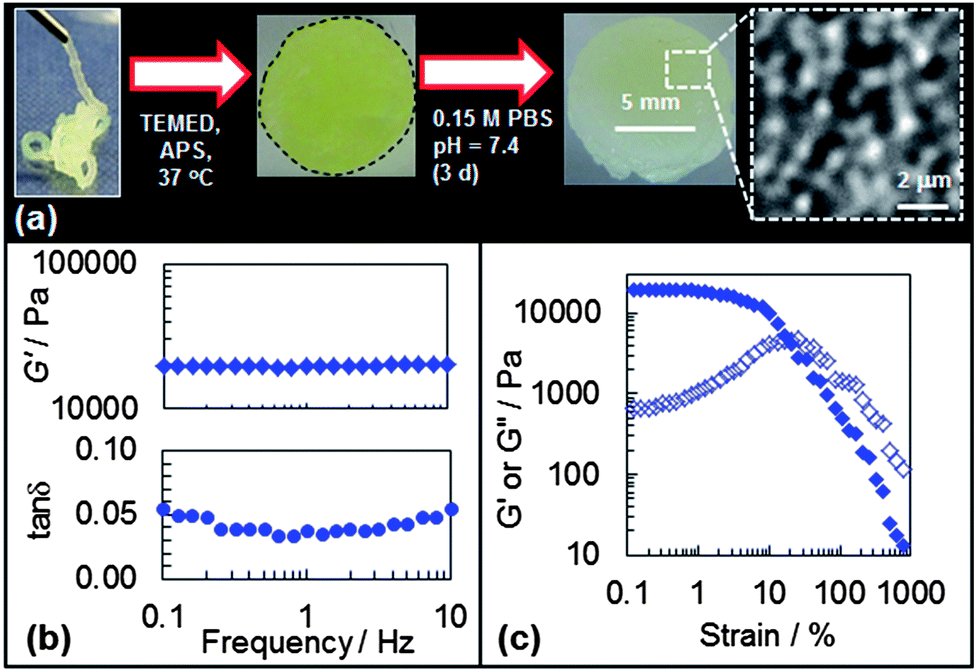 | ||
| Fig. 9 Properties for DX PVAM gels at physiological pH and ionic strength. (a) Shows injection of a concentrated dispersion through an 18 gauge needle used to prepare DX PVAM gel (ϕhs = 0.16). The gel disc (with outline added for clarity) was subjected to swelling for 3 days at pH = 7.4. The inset shows a high magnification optical image of the swollen gel. (b) Shows frequency-sweep data for the gel. (c) Shows the variation of G′ (closed symbols) and G′′ (open symbols) with strain for the swollen gel. | ||
The DX PVAM microgel was allowed to swell in pH = 7.4 phosphate buffered saline (PBS) solution for 3 days. The measured ϕhs values were 0.16 and 0.11, respectively, before and after swelling. A sol fraction of 0.06 was determined gravimetrically which meant that 94 wt% of the gel remained intact. Therefore, the decrease in ϕhs was primarily due to gel expansion. Optical micrographs taken from the swollen gel enabled a value for Dn(Opt) of 0.79 μm to be determined (CV = 11%). Following the method described above a Qp value of 1.4 was calculated. The Dn(opt) and Qp values were not significantly different to those measured for the DX PVAM prepared in the absence of TEMED without swelling (Fig. 5(a)). Accordingly, the expansion of the DX PVAM gel when placed in buffer was due to particle-network relaxation (“breathing in”) and not microgel particle swelling. Furthermore, a ϕeff value of (0.11 × 1.4 =) 0.15 was calculated. This shows that the DX PVAM gel retained a high effective porosity (ca. 85 vol%) under physiological conditions. High porosity is one criterion for potentially beneficial scaffold performance.48
The mechanical properties of the swollen DX PVAM gel were measured using frequency-sweep and strain-sweep dynamic rheology (see Fig. 9(b) and (c)). The G′, tanδ and γc values for the gel were 20.1 kPa, 0.055 and 19%, respectively. These values are comparable to the values of the DX PVAM microgel prepared without TEMED before swelling (cf.Fig. 7, ϕhs = 0.15). These data demonstrate that the DX PVAM microgels can be formulated as injectable gels that can be cured at physiological temperature and maintain their mechanical properties under physiological ionic strength and pH conditions. Future work will investigate their pH-dependent swelling.
Conclusions
This study has shown for the first time that DX microgels can be prepared from cationic, high primary amine content microgel particles. Accordingly, our double crosslinking strategy for preparing hydrogels from microgel particles appears to be generally applicable. We have shown that for DX PVAM microgels the dependence of the elastic modulus follows G′ ∼ exp(bϕeff) and b = 16.4. The b value implies that the particles within the gel had low softness and this was attributed to a relatively low extent of microgel particle swelling. The morphology of the gels consisted of inter-connected, space-filling networks of partially swollen microgel particles. Both G′ and the porosity were tuneable using ϕhs. The new DX PVAM microgel with the best mechanical properties had G′ = 41 kPa and γc = 46, implying good stiffness and ductility. That system was prepared using ϕhs = 0.17 and had an effective porosity of 76 vol% from Fig. 5(b). The microgel used here had a very high content of primary amine groups and, accordingly, is well suited to functionalisation.18 We demonstrated microgel functionalisation here by epoxide reaction and also earlier using a chromophore and carbodiimide chemistry.34 Accordingly, there are many potential applications for future versions of these new DX PVAM microgel hydrogels, spanning the range from composites, catalysis, membranes and biomaterials. Factors favouring the latter are that the precursor physical gels can be injected through a narrow-gauge needle (Fig. 9(a), inset) and crosslinked at 37 °C. Furthermore, the DX PVAM maintained a highly porous morphology at physiological pH and ionic strength. For one potential biomaterial application we note that injectable anionic DX microgels have been shown to restore load for damaged intervertebral discs.7 This approach could be available for a future version of the DX PVAM microgels. Of course, it will be necessary to reduce the cytotoxicity often associated with primary amines and a range of suitable strategies that have been successfully used for related primary amine-based systems have been established.28,29Acknowledgements
BRS and ST would like to thank the Royal Thai Government for sponsoring ST. We would also like to thank the reviewers for their helpful comments regarding this manuscript.References
- F. Hapiot, S. Menuel and E. Monflier, ACS Catal., 2013, 3, 1006 CrossRef CAS.
- C. M. Kirschner and K. S. Anseth, Acta Mater., 2013, 61, 931 CrossRef CAS PubMed.
- D. Buenger, F. Topuz and G. Juergen, Prog. Polym. Sci., 2012, 37, 1678 CrossRef CAS PubMed.
- K. Haraguchi, K. Murata and T. Takehisa, Macromolecules, 2012, 45, 385 CrossRef CAS.
- Y. Akagi, J. P. Gong, U.-I. Chung and T. Sakai, Macromolecules, 2013, 46, 1035 CrossRef CAS.
- J. P. Gong, Soft Matter, 2010, 6, 2583 RSC.
- A. H. Milani, T. J. Freemont, J. A. Hoyland, D. J. Adlam and B. R. Saunders, Biomacromolecules, 2012, 13, 2793 CrossRef CAS PubMed.
- R. Liu, A. H. Milani, T. J. Freemont and B. R. Saunders, Soft Matter, 2011, 7, 4696 RSC.
- B. R. Saunders, N. Laajam, E. Daly, S. Teow, X. Hu and R. Stepto, Adv. Colloid Interface Sci., 2009, 147, 251–262 CrossRef PubMed.
- T. Ngai, H. Auweter and S. H. Behrens, Macromolecules, 2006, 39, 8171 CrossRef CAS.
- R. H. Pelton and P. Chibante, Colloids Surf., 1986, 120, 247 CrossRef.
- R. Mansson, G. Frenning and M. Malmsten, Biomacromolecules, 2013, 14, 2317 CrossRef PubMed.
- S. Thaiboonrod, C. Berkland, A. H. Milani, R. Ulijn and B. R. Saunders, Soft Matter, 2013, 9, 3920 RSC.
- Z. Hu, X. Lu and C. Wang, Adv. Mater., 2000, 12, 1173–1176 CrossRef CAS.
- E. C. Cho, J.-Y. Kim, A. Fernandez-Barbero and D. A. Weitz, Nano Lett., 2008, 8, 168 CrossRef CAS PubMed.
- J. Meid, F. Dierkes, J. Cui, R. Messing, A. J. Crosby, A. Schmidt and W. Richtering, Soft Matter, 2012, 8, 4254 RSC.
- R. Liu, A. H. Milani, J. M. Saunders, T. J. Freemont and B. R. Saunders, Soft Matter, 2011, 7, 9297 RSC.
- R. K. Pinschmidt, J. Polym. Sci., Part A: Polym. Chem., 2010, 48, 2257 CrossRef CAS.
- C. Miao, X. Chen and R. Pelton, Ind. Eng. Chem. Res., 2007, 46, 6486 CrossRef CAS.
- Z. Mohammadi, A. Cole and C. Berkland, J. Phys. Chem. C, 2009, 113, 7652 CAS.
- H.-B. Wang, P. G. Jessop and G. Liu, ACS Macro Lett., 2012, 1, 944 CrossRef CAS.
- J. Kim, H.-J. Lim, Y. K. Hwang, H. Woo, J. W. Kim and K. Char, Langmuir, 2012, 28, 11899 CrossRef CAS PubMed.
- M. Jaeger, S. Schubert, S. Ochrimenko, D. Fischer and U. S. Schubert, Chem. Soc. Rev., 2012, 41, 4755 RSC.
- Z. Shao, A. S. Negi and C. O. Osuji, Soft Matter, 2013, 9, 5492 RSC.
- M. Siebenburger, M. Fuchs and M. Ballauff, Soft Matter, 2012, 8, 4014 RSC.
- B. H. Tan, K. C. Tam, Y. C. Lam and C. B. Tan, Polymer, 2005, 46, 10066 CrossRef CAS PubMed.
- K. Xu, Y. Tan, Q. Chen, H. An, W. Li, L. Dong and P. Wang, J. Colloid Interface Sci., 2010, 345, 360 CrossRef CAS PubMed.
- L. Zhang, S. Zheng, D. E. Kang, J. Y. Shin, H. Suh and I. Kim, RSC Adv., 2013, 3, 4692 RSC.
- W. Y. Seow, K. Liang, M. Kurisawa and C. A. E. Hauser, Biomacromolecules, 2013, 14, 2340 CrossRef CAS PubMed.
- H. Cai, X. An, J. Cui, J. Li, S. Wen, K. Li, M. Shen, L. Zheng, G. Zhang and X. Shi, ACS Appl. Mater. Interfaces, 2013, 5, 1722 CAS.
- B. Xia, C. Dong, Y. Lu, M. Rong, Y.-Z. Lv and J. Shi, Thin Solid Films, 2011, 520, 1120 CrossRef CAS PubMed.
- M. Yang, C. Liu, Z. Li, G. Gao and F. Liu, Macromolecules, 2010, 43, 10645 CrossRef CAS.
- D. Liu, B. Yu, X. Jiang and J. Yin, Langmuir, 2013, 29, 5307 CrossRef CAS PubMed.
- S. Thaiboonrod, F. Cellesi, R. V. Ulijn and B. R. Saunders, Langmuir, 2012, 28, 5227 CrossRef CAS PubMed.
- K. Samaru, H. Matsuoka and H. Yamaoka, J. Phys. Chem., 1996, 100, 9000 CrossRef.
- H. Dalmont, O. Pinprayoon and B. R. Saunders, Langmuir, 2008, 24, 2834 CrossRef CAS PubMed.
- H. Ohshima, K. Makino, K. Kato, K. Fujimoto, T. Kondo and H. Kawaguchi, J. Colloid Interface Sci., 1993, 159, 512 CrossRef CAS.
- J. B. Lee, C. Parkin, M. J. Shaw, N. A. Hamspon and K. I. MacDonald, Tetrahedron, 1973, 29, 751 CrossRef CAS.
- M. U. de la Orden, M. C. Matias and J. M. Urreaga, Polym. Degrad. Stab., 2004, 85, 697 CrossRef CAS PubMed.
- T. Hellweg, C. D. Dewhurst, E. Bruckner, K. Kratz and W. Eimer, Colloid Polym. Sci., 2000, 278, 972 CAS.
- S. Nojd, P. S. Mohanty, P. Bagheri, A. Yethiraj and P. Schurtenberger, Soft Matter, 2013, 9199 RSC.
- R. Borrega, M. Cloitre, I. Betremieux, B. Ernst and L. Leibler, Europhys. Lett., 1999, 47, 729 CrossRef CAS.
- M. E. Helgeson, S. E. Moran, H. Z. An and P. S. Doyle, Nat. Mater., 2012, 11, 344 CrossRef CAS PubMed.
- H. H. Winter and F. Chambon, J. Rheol., 1986, 30, 367 CrossRef CAS.
- V. Kobelev and K. S. Schweizer, Phys. Rev. E: Stat., Nonlinear, Soft Matter Phys., 2005, 71, 021401 CrossRef.
- Y. Zong, G. Yuan, C. Zhao and C. C. Han, J. Chem. Phys., 2013, 138, 184902 CrossRef PubMed.
- S. Kondo, H. Sakurai, U.-I. Chung and T. Sakai, Macromolecules, 2013, 46, 7027 CrossRef CAS.
- A. Galperin, T. J. Long and B. D. Ratner, Biomacromolecules, 2010, 11, 2583 CrossRef CAS PubMed.
Footnote |
| † Electronic supplementary information (ESI) available. See DOI: 10.1039/c3tb21579b |
| This journal is © The Royal Society of Chemistry 2014 |