 Open Access Article
Creative Commons Attribution 3.0 Unported Licence
Order vs. disorder—a huge increase in ionic conductivity of nanocrystalline LiAlO2 embedded in an amorphous-like matrix of lithium aluminate
D.
Wohlmuth
*a,
V.
Epp
a,
P.
Bottke
a,
I.
Hanzu
a,
B.
Bitschnau
b,
I.
Letofsky-Papst
c,
M.
Kriechbaum
d,
H.
Amenitsch
d,
F.
Hofer
c and
M.
Wilkening
*a
aChristian-Doppler Laboratory for Lithium Batteries, Graz University of Technology, Institute for Chemistry and Technology of Materials, NAWI Graz, Stremayrgasse 9, A-8010 Graz, Austria. E-mail: wohlmuth@tugraz.at; wilkening@tugraz.at; viktor.epp@tugraz.at
bGraz University of Technology, Institute of Physical Chemistry and Theoretical Chemistry, NAWI Graz, Stremayrgasse 9, A-8010 Graz, Austria
cGraz University of Technology, Institute for Electron Microscopy and Nanoanalysis, NAWI Graz, Steyrergasse 17, A-8010 Graz, Austria
dGraz University of Technology, Institute for Inorganic Chemistry, NAWI Graz, Stremayrgasse 9, A-8010 Graz, Austria
First published on 13th October 2014
Abstract
Coarse grained, well crystalline γ-LiAlO2 (P43212) is known as an electronic insulator and a very poor ion conductor with the lithium ions occupying tetrahedral voids in the oxide structure. The introduction of structural disorder such as point defects or higher-dimensional defects, however, may greatly affect ionic conduction on both short-range as well as long-range length scales. In the present study, we used high-energy ball milling to prepare defect-rich, nanocrystalline LiAlO2 that was characterized from a structural point of view by powder X-ray diffraction, TEM as well as small angle X-ray scattering (SAXS). Temperature-dependent conductivity spectroscopy revealed an increase of the room-temperature ionic conduction by several orders of magnitude when going from microcrystalline γ-LiAlO2 to its nanocrystalline form. The enhanced ion transport found is ascribed to the increase of Li ions near defective sites both in the bulk as well as in the large volume fraction of interfacial regions in nano-LiAlO2. The nanocrystalline ceramic prepared at long milling times is a mixture of γ-LiAlO2 and the high-pressure phase δ-LiAlO2; it adapts an amorphous like structure after it has been treated in a planetary mill under extremely harsh conditions.
1 Introduction
Diffusive motion of small particles is an omnipresent phenomenon in nature. In particular, it is of great interest when (ionic) solids are considered.1–3 In solid-state materials science the temperature-dependent diffusion behavior of cations and anions, such as H, Li, Na, F, and O, is of enormous importance for manifold technological processes. At present, solid electrolytes with high lithium-ion conductivity4 are feverishly searched to realize next generation rechargeable solid-state batteries that benefit from long lifetime, safety and reliability.5,6In the course of recent years, Li-bearing oxides and sulfides have been prepared and characterized that show extremely high bulk Li+ conductivities. Prominent ultrafast electrolytes are, for example, Li7La3Zr2O12,7,8 Li10GeP2S12 (ref. 9) (and related compounds10), β-Li3PS4,11 argyrodite-type sulfides such as Li6PS5Br,12,13 and glass ceramic Li7P3S11.14,15 Considering their electrochemical stability, economical viability, and versatility with respect to preparation techniques usually applied to manufacture, for example, all-solid-state (thin-film) batteries, further studies are urgently needed to throw light on these aspects. Even though other materials show lower bulk conductivities, if used as amorphous and/or very thin electrolyte films with low cell resistance, they may seriously compete with the ultrafast ion conductors discovered recently. This might be due to their easy and cheap preparation, chemical robustness, and electrochemical stability that result in an extremely good durability and cyclability of the batteries.
Lithium aluminium oxide, LiAlO2, if prepared in a defect-rich form, might serve as such an alternative against other oxides, see for e.g., the well-known lithium phosphorous oxy-nitride16 (LIPON) that is commonly applied in secondary lithium-ion batteries. Tetragonal γ-LiAlO2 (space group P43212) is known as an electronic insulator and, in its coarse grained and well crystalline form, a very poor ion conductor17 with the lithium ions fully occupying the tetrahedral voids in the oxide structure,18 thus being trapped on these sites. Besides a report to use LiAlO2 as coating for Lix(Ni,Co,Mn)O2-based cathodes,19,20 Goodenough and co-workers21 as well as Cheng et al.22 have recently shown that during the preparation of the highly conducting electrolyte Al-doped Li7La3Zr2O12 (Al-doped LLZ) the crystallites are often covered by an amorphous layer of LiAlO2. Such a grain-boundary phase can have a crucial effect on long-range ion transport of Al-doped LLZ-type electrolytes.
Considering these aspects, the present study is two-fold and combines the following fundamental and application-oriented questions: (i) how and to what extent does the introduction of structural disorder affect lithium-ion transport in γ-LiAlO2? The results shall be compared with those from a sample with μm-sized crystallites. Such information is also a key element of many applications where crystalline LiAlO2 is intentionally used to strictly prevent diffusion. As an example, besides Li2MeO3 (with Me = Ti or Zr) γ-LiAlO2 is considered as an advanced tritium breeding blanket material in fusion reactors.23 (ii) If the structure resulting after ball milling can be regarded as amorphous-like, how does ionic conductivity of such a sample with the composition LiAlO2 compare with that of structurally disordered electrolytes prepared by deposition techniques that can be used in thin-film micro-batteries? Moreover, with respect to its role forming amorphous grain-boundary phases in (Al-doped) LLZ-based electrolytes (see above), ionic conductivities of nanostructured or amorphous LiAlO2 have not been reported so far.
In the present case, we prepared nanocrystalline LiAlO2 following a top-down approach by employing high-energy ball milling. Starting from coarse-grained commercially available γ-LiAlO2 several nanocrystalline samples were prepared by dry milling in a planetary mill. Structural sample characterization was carried out via X-ray powder diffraction, small angle X-ray scattering (SAXS), 27Al magic angle spinning (MAS) nuclear magnetic resonance (NMR) as well as by scanning and high-resolution transmission electron microscopy (SEM, HR-TEM). SAXS patterns have been recorded to correlate the inner surface parameter with the results from ion transport measurements. Ion dynamics has been mainly evaluated by conductivity spectroscopy; first 7Li NMR line shape measurements complement the present study.
Indeed, it turned out that the introduction of structural disorder via mechanical treatment has a giant effect on Li ion dynamics in LiAlO2. The resulting defect-rich nanocrystalline material, which is equipped with a large volume fraction of amorphous material, reveals room temperature dc conductivity that is by several orders of magnitude larger than that of (single) crystalline LiAlO2. The results resemble those of previously studied nanocrystalline LiTaO3 and LiNbO3 (ref. 24–26) as well as single- and two-phase composites that are based on lithium oxide.27–29
2 Experimental
Pure lithium aluminum oxide (99.5%) was obtained from Alfa Aesar. The transparent crystallites, with diameters in the μm range, revealed the typical X-ray powder diffraction pattern of the well-known γ-phase of LiAlO2 (Fig. 1(a)). Nanocrystalline γ-LiAlO2 was prepared from the microcrystalline source material by ball milling using a high-energy planetary mill (Fritsch, Pulverisette 7). We used a grinding beaker made of zirconium dioxide (Fritsch) equipped with 180 milling balls (zirconium dioxide, 5 mm in diameter). The air-tight beaker was loaded and opened in an Ar-filled glove box with less than 0.1 ppm water vapor inside to avoid any contact with air or moisture. To obtain different nanocrystalline samples the milling time was varied from 5 min to 8 h; the rotational speed of the mill was set to 400 rpm in order to reduce the formation of side products as effectively as possible.Prior to our impedance measurements and for structural characterization X-ray powder diffraction patterns were recorded on a Bruker D8 Advance diffractometer with Bragg Brentano geometry using Cu Kα radiation (10 to 100 °2θ, step size 0.02 °2θ, and step time 1 s). Rietveld refinement was carried out with an X-PertHighScorePlus (PANalytical). In addition to XRD, TEM images were acquired with a TECNAI F20, Schottky cathode, operated at 200 kV. Samples were prepared using standard TEM preparation routines for powder samples. The particles were mounted on Cu grids covered with a carbon coated holey polymer film.
Small-angle X-ray scattering (SAXS) measurements complement the techniques applied to characterize our nanocrystalline samples. For this purpose, a high-flux SAXSess camera (Anton Paar, Graz, Austria) connected to a Debyeflex 3003 X-ray generator (GE-Electric, Germany), operating at 40 kV and 50 mA with a sealed-tube Cu anode was used. The Goebel-mirror focused and Kratky-slit collimated X-ray beam was line shaped (17 mm horizontal dimension at the sample) and scattered radiation from the sample measured in the transmission mode was recorded by highly X-ray sensitive image plates (Fuji, Japan) within a q-range (with q being the scattering vector) of 0.25 to 5 nm−1. After each SAXS measurement with an exposure time of 8 min, the image plates were transferred to a Cyclone Plus image plate reader (Perkin Elmer, USA), laser-scanned and converted digitally into intensity values (I). The 2D recorded intensity data were then integrated with a 10 mm width, normal to the direction of the scattering angle, to result in a 1D-scattering curve I(q) within the angular range mentioned above.
27Al MAS NMR spectra have been recorded at 130 MHz using a Bruker Avance III solid-state NMR spectrometer; a single pulse sequence has been used for data acquisition. We employed a 4 mm probe and rotors made of ZrO2 allowing rotation frequencies of 15 kHz. Spectra were referenced to aqueous Al(NO3)3. 7Li NMR spectra were recorded at 194 MHz with the same setup but using a probe designed for static temperature-variable NMR experiments. Non-selective excitation with a single pulse was carried out.
For the broadband impedance measurements dense tablets were prepared by cold-pressing the milled LiAlO2 samples with a uniaxial pressure of 10 kN in a 10 mm press set. It is important to note that the samples have not been densified and that the overall conductivity measured might slightly differ from that of pellets that are sintered additionally. Due to the amorphous character of the nanocrystalline samples, which has been revealed by XRD and TEM, we anticipate that this influence is of minor importance and that the conductivity values measured (see below) are close to the intrinsic ones.
To ensure electrical contact of the pellets pressed, Au electrodes of about 100 nm thickness were applied with a sputter coater (Leica EM SCD050). The impedance measurements were carried out with a Novocontrol Concept 80 broadband analyzer (Alpha-AN, Novocontrol). The analyzer was connected to a BDS 1200 cell in combination with an active ZGS cell interface from Novocontrol, which allows temperature-variable 2-electrode measurements. The temperature is automatically controlled by using a QUATRO cyrosystem (Novocontrol). In order to create a highly constant nitrogen gas flow the cryosystem is working with a heating element that builds up a specified pressure in a liquid nitrogen dewar. After heating by using a gas jet, the freshly evaporated nitrogen flows directly through the sample cell that is mounted in the cryostat. Such a setup allows very stable system operation with an accuracy of ±0.01 K. In summary, the whole device is able to record impedance and the permittivities at frequencies ranging from few μHz up to 20 MHz at temperatures ranging from 150 K to 570 K.
3 Results and discussion
3.1 Analysis via X-ray diffraction and TEM
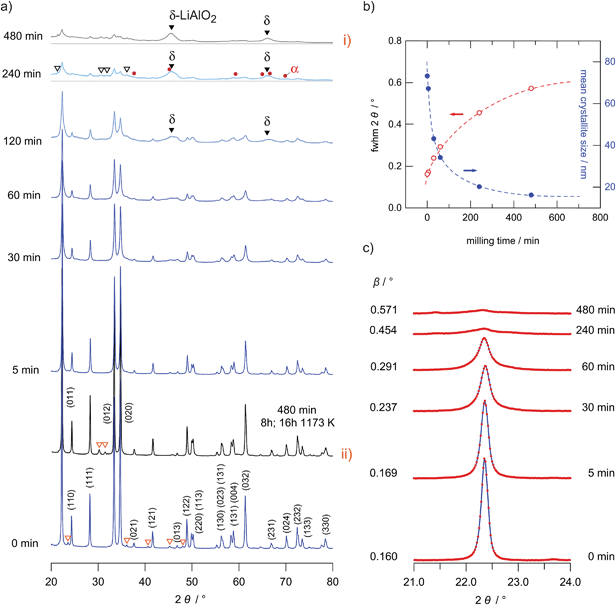
Nanostructured γ-LiAlO2 was prepared from the microcrystalline source material, which was obtained from Alfa Aesar (99.5%). The coarse grained microcrystalline γ-LiAlO2 consists of irregularly shaped crystallites with an average crystallite size in the order of 100 nm. Although γ-LiAlO2 is known to be stable in air the whole procedure was performed under an Ar atmosphere to avoid a reaction of the hygroscopic nanocrystalline powder with moisture and to keep the influence of water on the subsequent conductivity measurements as small as possible.By varying the milling times, powders with different mean particle sizes were obtained. The effect of ball milling on the XRD patterns is shown in Fig. 1(a) to (c). The value of the mean crystallite size was roughly estimated from the broadening of the XRD patterns using the well-known Scherrer equation30
L0 = Kλ/(β![[thin space (1/6-em)]](https://www.rsc.org/images/entities/char_2009.gif) cos(θ)) cos(θ)) | (1) |
In this equation K is a dimensionless shape factor with a value close to unity. The shape factor has a typical value of 0.89 for spherical particles. λ is the X-ray wavelength, θ is the Bragg angle and β represents the line broadening at half magnitude (FWHM); it is already corrected for any instrumental line broadening. For the estimation of L0 we used the XRD peaks at 2θ = 22.3°, 28.3°, 34.8° and 61.3° (hkl = 011, 111, 012 and 032). β is calculated according to β = Bm − Bref where Bm is the measured line width and Bref is the width of the reference which was obtained by using microcrystalline LaB6. In Fig. 1(c) the broadening of the reflection at 2θ = 34.8° (012) is shown as an example. In Fig. 1(b) a quantitative analysis of the broadening of the reflection at 22.3° is shown together with the corresponding L0 values.
Anyway, it should be noted that a possible influence of stress caused by high-energy ball milling is not taken into the account by the Scherrer equation. Hence, the calculated crystallite sizes should be seen as a rough estimation indeed. For example, milling times of 4 and 8 h lead to mean crystallite sizes of about 16 and 20 nm, respectively. The mean crystallite size is only slightly reduced at milling times of about 5 min. The largest change in crystallite size was between the starting sample (ca. 70 nm) and those milled for 30 and 60 minutes (approximately 40 nm). The corresponding decrease in L0 is associated with a huge increase in Li ion dynamics as probed via conductivity measurements (see the next section).
For milling times longer than 60 minutes further XRD reflections than those assigned to LiAlO2 arise pointing to the formation of a small amount of other nanocrystalline and structurally disordered phases (see Fig. 1(a) and the magnification in Fig. 2); these reflections may stem from the high-pressure phases α-LiAlO2, δ-LiAlO2 or even LiAl5O8. α-LiAlO2 can be synthesized at 3.5 GPa and 850 °C; it crystallizes with a NaHF2 structure.31–33 Besides this high-pressure phase a monoclinic one34 is known that can be obtained at an intermediate pressure and temperature.
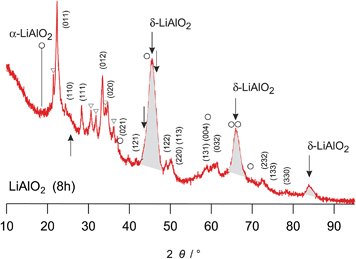 | ||
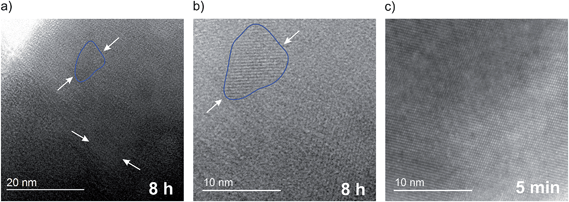
| Fig. 2 Magnification of the X-ray powder diffraction pattern shown in Fig. 1(a), labelled (i). The hkl indices refer to the reflections of γ-LiAlO2; triangles indicate small amounts of impurities showing up after 8 h of milling. Most importantly, the arrows indicate the peak positions of δ-LiAlO2. In particular the peaks highlighted in grey are very similar to those observed by Li et al. (see the powder pattern labelled ‘955’ in Fig. 1 of ref. 31). Since the strong reflection of α-LiAlO2 at diffraction angles smaller than 20° is missing, we tend to assign the new peaks to the high-pressure modification of LiAlO2. The strong background signal indicates the amorphous material as is verified by HR TEM, see Fig. 5. The rather broad reflexes of δ-LiAlO2 point to extremely small nanocrystals that are hardly seen by HR TEM. | ||
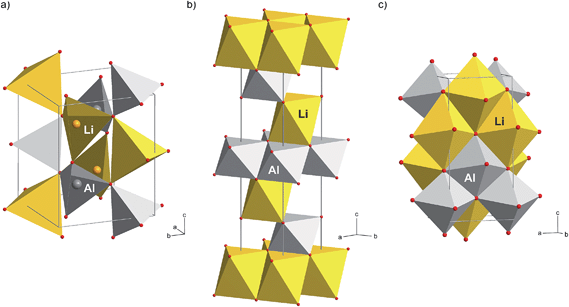
Here, the additional XRD peaks, marked by black triangles in Fig. 1(a) and by arrows in Fig. 2, most likely reflect the formation of the δ-modification of LiAlO2. Although there is some overlap with those peaks being attributed to α-LiAlO2, with regard to our XRD patterns measured down to very low 2θ values, one of the characteristic XRD reflections of the α-form, which shows up slightly below 20°, is missing (see Fig. 2). This confirms our anticipation that mainly the δ-modification is formed during mechanical treatment at long milling times. The positions of the reflections marked by filled triangles resemble those reported by Li et al.31 for a sample with a certain amount of δ-LiAlO2 (I41/amd). The latter has been prepared by impact technology using pressures of up to 48 GPa with hot spots of 1570 K. δ-LiAlO2 prepared in such a way, that is, shock compressing of γ-LiAlO2, crystallizes with a distorted NaCl structure being similar to that of the tetragonal phase of LiFeO2 (see Fig. 3). This δ-form (3.51 g cm−3) is denser than the α-phase (3.40 g cm−3) and much denser than the γ-modification (2.62 g cm−3).31 Obviously, during high-energy ball milling the oxide was exposed to similar reaction conditions as it is the case during the high-energy impact experiments reported previously.31
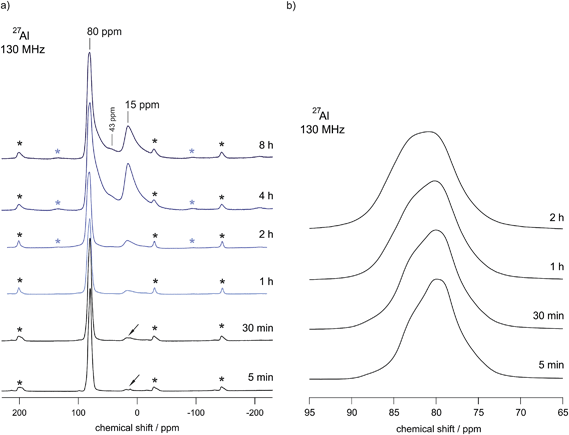
In order to underpin the assignment of the new peaks to the δ-form of LiAlO2, we have recorded 27Al MAS NMR spectra (see Fig. 4). While in the low-pressure γ-modification (as well as in the orthorhombic β-form of LiAlO2) Li and Al are solely tetrahedrally coordinated by oxygen anions, in δ-LiAlO2 both Li and Al ions are six-fold coordinated (see Fig. 3). The same is found for α-LiAlO2;32 in the monoclinic form of LiAlO2 the lithium cations are six-fold coordinated and aluminum cations display both four-and six-fold coordination (Fig. 3). Thus, if we assume that high-pressure phases of LiAlO2 have been formed during ball-milling, characteristic NMR lines representing octahedrally coordinated Al should show up – and indeed, this is found here. The spectrum of microcrystalline γ-LiAlO2 as well as those of the samples milled for 5 min and 30 min are mainly composed of a single signal at 80 ppm representing Al ions being tetrahedrally coordinated. This value is in agreement with the result by Müller et al.35 who found a 27Al NMR isotropic chemical shift of 82 ppm for the γ-form. Additional intensities, however, show up if the milling time is increased to 4 h and 8 h, respectively.
In the unit cell of γ-LiAlO2 there are four chemically equivalent but magnetically inequivalent Al sites; the same holds for the Li sites. In particular, the line at 15 ppm (see Fig. 3) is indicative of six-fold coordinated Al as expected for δ-LiAlO2 (for β-LiAlO2 a chemical shift of ca. 17 ppm is reported35). While the line with low intensity located at approximately 43 ppm points to five-fold coordinated Al, which is presumably located in the surface regions of nanocrystalline LiAlO2, see also ref. 36, the asymmetric broadening of the main intensities is (i) either due to second order quadrupole effects affecting the central transition of the spin-5/2 nucleus (a coupling constant of 3.2 MHz is reported for γ-LiAlO2 with an asymmetry parameter η ≠ 0 (ref. 35)) or (ii) stems from local structural disorder introduced during milling. The latter would easily lead to both a distribution of chemical shift values and electric field gradients at the Al sites. This is shown in detail in Fig. 4(b) presenting magnifications of the 27Al MAS NMR lines at around 80 ppm for the samples milled up to 2 h. Broadening of the signal as well as a shift of the center of the line by 2 ppm towards larger values is observed. The shape of the NMR line of micro-LiAlO2 is due to second order quadrupole effects only. The line at 82 ppm, observed after 2 h of milling, might represent both amorphous LiAlO2 and disordered nm-sized γ-LiAlO2 crystallites. According to our experience, see e.g., ref. 37, the NMR chemical shift values of an X-ray amorphous phase produced via milling do not vary much from those of the corresponding crystalline counterpart having the same overall chemical composition; this shows that local structures of the two phases are very similar.
Most importantly for our conductivity measurements presented below, mechanically induced phase transformations are almost absent for those samples treated only for 5 or 30 min in the planetary mill under the relatively harsh conditions chosen here. This can be seen by both XRD and 27Al MAS NMR. Thus, the samples prepared after 30 min of milling represent almost phase pure nanocrystalline LiAlO2 equipped with a large fraction of mechanically introduced defects.
As illustrated in Fig. 1(a)(i) and (ii), annealing of the 8 h milled sample for about 16 hours at 1173 K leads to significant narrowing of the XRD patterns due to grain boundary relaxation as well as grain growth. After annealing, almost phase pure γ-LiAlO2 is re-obtained. The same observation has been documented by Li and co-workers31 after annealing the δ-form of LiAlO2 at the same temperature; δ-LiAlO2 transforms into the γ-form, being stable at lower pressures, via α-modification. The mean crystallite size of our annealed sample is comparable to the initial microcrystalline sample purchased from Alpha Aesar. Some of the minor impurity phases of the original sample disappeared (see unfilled triangles in Fig. 1(a)). As in the case of Li et al. we cannot exclude that a small amount of spinel-type Al2.5Li0.5O4 (Li![[thin space (1/6-em)]](https://www.rsc.org/images/entities/char_2009.gif) :
:![[thin space (1/6-em)]](https://www.rsc.org/images/entities/char_2009.gif) Al ratio of 1
Al ratio of 1![[thin space (1/6-em)]](https://www.rsc.org/images/entities/char_2009.gif) :
:![[thin space (1/6-em)]](https://www.rsc.org/images/entities/char_2009.gif) 5) is formed during milling. The fact that, pure γ-LiAlO2 (Li
5) is formed during milling. The fact that, pure γ-LiAlO2 (Li![[thin space (1/6-em)]](https://www.rsc.org/images/entities/char_2009.gif) :
:![[thin space (1/6-em)]](https://www.rsc.org/images/entities/char_2009.gif) Al ratio of 1
Al ratio of 1![[thin space (1/6-em)]](https://www.rsc.org/images/entities/char_2009.gif) :
:![[thin space (1/6-em)]](https://www.rsc.org/images/entities/char_2009.gif) 1) is formed after annealing indicates that the Li
1) is formed after annealing indicates that the Li![[thin space (1/6-em)]](https://www.rsc.org/images/entities/char_2009.gif) :
:![[thin space (1/6-em)]](https://www.rsc.org/images/entities/char_2009.gif) Al ratio of the new phase showing up after severe mechanical treatment equals that of LiAlO2. As reported by Li et al.,31 Al2.5Li0.5O4 is a byproduct from high temperature decomposition of γ-LiAlO2 that would lead to the release of Li2O, while δ-LiAlO2 is the product of the high-pressure solid-solid phase transition. Here, we did not find enough credible evidence for the formation of a large amount of the spinel phase.
Al ratio of the new phase showing up after severe mechanical treatment equals that of LiAlO2. As reported by Li et al.,31 Al2.5Li0.5O4 is a byproduct from high temperature decomposition of γ-LiAlO2 that would lead to the release of Li2O, while δ-LiAlO2 is the product of the high-pressure solid-solid phase transition. Here, we did not find enough credible evidence for the formation of a large amount of the spinel phase.
Turning now back to the investigation of the morphology of the samples prepared, as shown in Fig. 5, scanning electron microscopy (SEM) pictures of the materials ball milled for 5 minutes and 8 hours are presented. The so-called microcrystalline sample shows particles with a size of around 100 nm which is in good agreement with the results estimated by the Scherrer equation. The sample mechanically treated for 8 hours exhibits a rather large distribution of particle sizes. Besides larger ones, rather small particles in the tens of nanometer range are visible. Large agglomerates result from compaction during high energy ball milling.
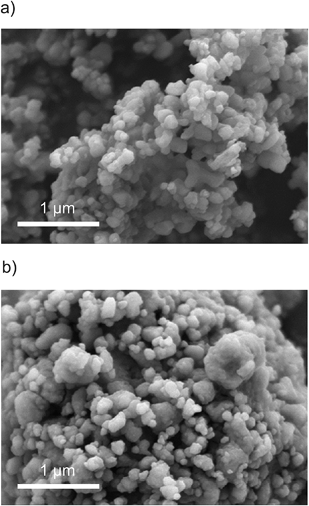 | ||
| Fig. 5 SEM micrographs of LiAlO2 ball milled for 5 min (top) as well as 8 hours (bottom). See the text for further explanations. | ||
As verified by HR-TEM (see Fig. 6) these agglomerates are clearly composed of differently orientated smaller crystallites. Most importantly, extended amorphous regions are visible in between these crystallites when LiAlO2 is treated for 8 h in a planetary mill at 400 rpm. For comparison, a similar observation is documented for mechanically treated LiNbO3; as has been shown in ref. 24, a layer of amorphous material with a thickness of about 2 nm covers the crystallites revealing a so-called core–shell structure of (nano-)crystalline and amorphous fractions. In our case, after 8 hours of milling the crystallites are completely embedded in an amorphous matrix of LiAlO2; the structure resembles that of a glass ceramic that can be prepared by thermal annealing of glassy materials, for example. Considering the XRD powder patterns and the broad reflexes of the δ-modification of LiAlO2 formed, the final product obtained seems to consist of three “phases”: (i) structurally disordered nanocrystalline γ-LiAlO2, (ii) amorphous material and (iii) extremely small nanocrystals of the δ-form that may cover the larger nm-sized γ-LiAlO2 particles. The structural disorder found for nano γ-LiAlO2 is supported by 27Al MAS NMR spectra revealing a broadening of the NMR line located at around 80 ppm.
3.2 Small-angle X-ray scattering
For our SAXS measurements the polycrystalline powders were filled into a vacuum-tight foil-sealed flat sample-cell. The beam path through the powdered sample was about 1 mm including the foils of 20 μm in thickness. All measurements, even that of the empty cell, were done in vacuum and at ambient temperature (ca. 293 K). The scattering of the foils was subtracted from the scattering of the samples after normalizing the two patterns to the same transmission intensity. In Fig. 7(a) the SAXS curves obtained are shown. Using CuKα radiation, having a wavelength of 0.154 nm, and a sample-to-detector distance of 265 mm this corresponds to a total 2θ region of 0.3° to 5° when the following conversion is applied:| q [nm−1] = 4π (sin(θ))/λ [nm] | (2) |
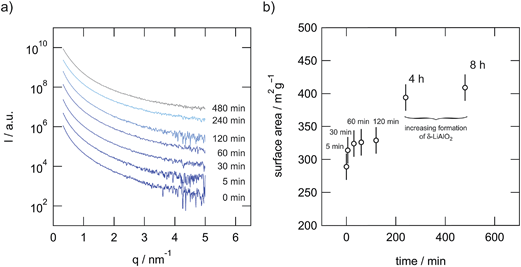 | ||
| Fig. 7 (a) SAXS pattern of microcrystalline and ball-milled LiAlO2. (b) Inner surface area per mass plotted vs. milling time as deduced from SAXS (ρ = 2.615 g cm−3, and see ref. 18, 31 and 32). | ||
Here, 2θ is the scattering angle with respect to the incident beam and λ denotes the wavelength of the X-rays.
The data were then analyzed in terms of the inner surface parameter (Si) according to the procedure of Porod.38,39 The inner surface area Si represents the total surface area of the porous or powdered compound with respect to its volume (or to its mass if the macroscopic density of the powder is known). From SAXS measurements this information on the nm-scale can be obtained by evaluating two parameters of the SAXS curve I(q). In our setup the vertical SAXS pattern I(q) were considered to be convoluted by an infinitely long horizontal beam profile (line focus). In that case Porod's law and the invariant can be applied to extract Si from the scattering curve I(q) convoluted by a infinitely long horizontal beam profile:
| I(q)q→∞ ∼ k/q3 | (3) |
 | (4) |
| Si = 1000(4/ρ)(k/Q) | (5) |
In Fig. 7(b) this surface area per mass is plotted versus the milling time. The mean surface areas per masses are in good agreement with the decreasing crystallite size as estimated by means of the Scherrer equation. Furthermore, the measurements indicate that the amount of amorphous material produced via milling increases with milling time. This corroborates the amorphous regions seen by HR TEM.
3.3 Long-range ion transport as probed by impedance spectroscopy
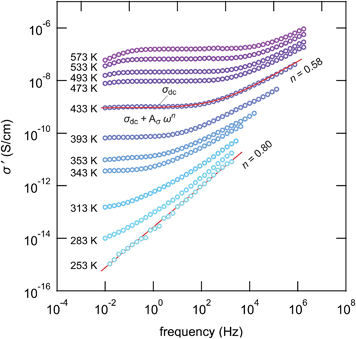
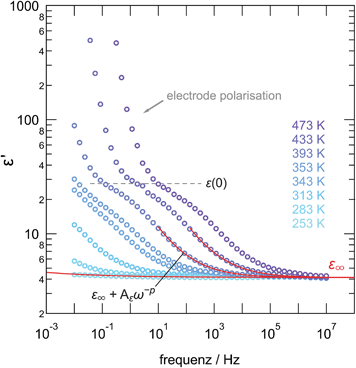
Impedance spectroscopy was used to characterize ion transport in ball-milled γ-LiAlO2 as a function of mechanical impact. The corresponding conductivity isotherms are shown in Fig. 8; they reveal the typical characteristics for structurally disordered materials. The sample milled for 30 min shall serve as an example here. Similar spectra were obtained for the other samples, however, with ion conductivities shifted towards higher or lower values.The same holds for the corresponding permittivity spectra ε′(ν) (see Fig. 9). Disregarding any electrode polarization at the lowest frequencies, permittivities ε′(0) of ca. 30 are obtained being typical for bulk ion conduction. ε′(∞) is approximately 4; values in the order of 10 or below are commonly expected for high-frequency permittivities of glasses. This gives Δε = ε′(0) − ε′(∞) ≈ 26, being the dielectric relaxation strength that is a measure for the dipole fluctuations.
The frequency dependent conductivity spectra, which are composed of a dc plateau and a Jonscher type dispersive region,40 can be approximated by a power law.
| σ′ = σdc + Aσωn | (6) |
As has been confirmed by preliminary potentiostatic polarization experiments carried out in our lab, the electronic fraction, σeon, of the overall conductivity σdc seems to be many orders of magnitude lower than the total value measured under a N2 atmosphere. To estimate σeon and σion, we placed the gold-sputtered pellets of the samples treated for 4 h and 8 h in airtight Swagelok cells, see also the procedure described in ref. 44. The polarization experiments were carried out at 293 K with a Parstat MC instrument from Princeton Applied Research; a constant voltage of 0.5 V was applied. Here, σdc is mainly determined by ion transport if measured in an oxygen-free, inert gas atmosphere. In a qualitative way the same holds for nanocrystalline LiTaO3 studied previously by some of us.25
To quantify thermal activation of the long-range ion transport, to which σdc is sensitive, the dc conductivity values (σdcT) have been plotted versus 1000/T, see Fig. 10. Solid lines represent fits according to an Arrhenius law:
| σdcT ∝ exp(−Ea/(kBT)) | (7) |
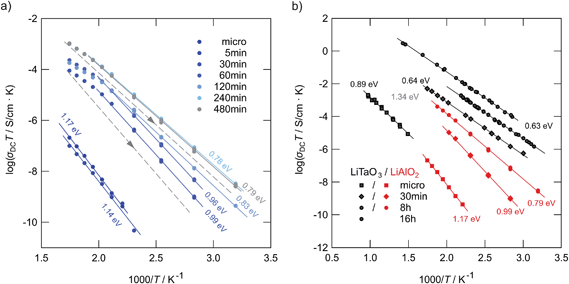 | ||
| Fig. 10 (a) Arrhenius plot of ion conductivities of high-energy ball-milled LiAlO2. Here, the 2nd heating runs are shown (see Fig. 11 for explanation). The solid lines represent fits with an Arrhenius law. For comparison, the non-milled sample is also shown. (b) Results from (a) compared with those previously obtained for nanocrystalline LiTaO3,25 which has also been prepared by high-energy ball milling but in a shaker mill from SPEX. The dashed lines in indicate the change of σdcT during cooling from high temperatures towards ambient (see also Fig. 11). For the sample milled for 8 h the activation energy slightly increases again. | ||
Comparing the samples milled for different durations, after approximately 4 hours of milling an upper limit of σdc is reached (see Fig. 10(a)). Further increase to 8 hours does not change ion dynamics much although X-ray peak broadening, and thus also the formation of the amorphous material, continues. This leads us to the conclusion that in the case of LiAlO2 additional nano-size effects, especially those of non-trivial nature,45,46 do not significantly contribute to the enhancement found after 30 min of milling. The defect level reached after 4 hours is fully sufficient to completely control long-range Li ion dynamics in nanocrystalline/amorphous LiAlO2 prepared by mechanical treatment.
As can be seen from the Arrhenius plot shown in Fig. 10(a), at elevated temperatures the σdcT values deviate from linear temperature behavior. This ‘sub-Arrhenian’ feature means that the conductivity properties of the sample steadily changes at sufficiently high T. If we, however, record σdcT during cooling the (linear) Arrhenius behavior, being characterized by relatively large activation energies, is re-observed. As an example, in the case of the sample milled for 8 h, after heat treatment the activation energy increases again. Note that the measuring time between each data point during heating was approximately 30 min. In Fig. 11 the heating and cooling runs measured for two samples, milled for 30 min and 8 h, respectively, are shown. While the initial conductivities are even larger than those shown in Fig. 10, heat treatment at elevated T leads to a continuous decrease of σdc and a slight increase of Ea. The bold lines show fits of those data points which are also presented in Fig. 10 (2nd heating run). All data points have been recorded after the samples were dried at 373 K inside the impedance cell.
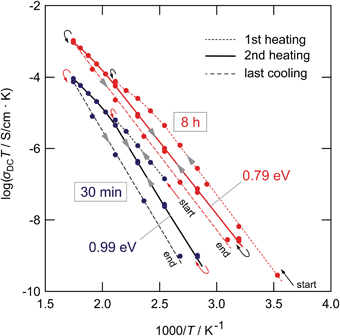 | ||
| Fig. 11 Heating and cooling runs of the LiAlO2 samples treated for 30 min and 8 h in a planetary mill. Data points have been recorded after the samples were dried at 373 K inside the impedance cell to remove any traces of moisture near the surface regions. The deviations from linear Arrhenius behavior at elevated T reflects healing of defects and points to re-organization of local structures. The 2nd heating runs (see bold lines) are used for the comparison shown in Fig. 10. | ||
The temperature effects observed here were also detected for LiTaO3 previously.25 Considering the samples milled only shortly these features might be ascribed to healing of defects and grain growth setting in. Interestingly, the larger the milling time, i.e., the larger the extent of structural disorder introduced, the less pronounced the effect observed. Obviously, the more the microstructure of the sample mechanically treated resembles that of the original structure, the easier the system transforms back. This view is supported by the above-mentioned fact that γ-LiAlO2 continuously transforms into high-pressure modifications, particularly the δ-form, crystallizing with different space groups.
For a brief overview, in Fig. 10(b) the σdcT values of micro- and nanocrystalline LiAlO2 of the 2nd heating run are compared with results from polycrystalline LiTaO3 treated in a shaker mill and studied previously.25 In contrast to LiAlO2, for LiTaO3 no phase transformations are known. Even though the increase of Li ion conductivity in LiAlO2 is less pronounced than that found for LiTaO3 the same characteristics show up: (i) a poor ion conductor can be transformed into a conducting one by mechanical treatment with a sufficiently high impact; (ii) the largest increase in σdc is already observed in the early stages of milling, that is, if high-energy ball mills are used, after milling periods of less than 1 hour. The ion conductors prepared in such a way reveal activation energies with values of ca. 0.8 eV or less.
The fact that lower ion conductivities are found for LiAlO2 after treatment for many hours (cf. the comparison with LiTaO3 in Fig. 10(b)) is presumably linked with the formation of the highly dense, high pressure phases of LiAlO2 limiting the increase in σdc compared to that found for LiXO3 with X = Nb, Ta.24,25 On the other hand, Li in α- and δ-LiAlO2 is coordinated octahedrally and the octahedra are connected by edge sharing. With regard to the LiO4-tetrahedra connected by sharing common edges in the γ-form, the arrangement in δ-LiAlO2 might be more beneficial for Li ion transport – even if long-range length scales are considered.
3.4 Ion self-diffusion as seen by 7Li NMR
7Li NMR line shape measurements (Fig. 12) can provide additional information on short- as well as long-range ion diffusivity.25 At sufficiently low temperatures, that is in the NMR rigid-lattice regime, the line width of the central line is dipolarly broadened due to the absence of rapid Li exchange; such exchange would lead to motional averaging of homonuclear Li–Li interactions. As soon as the Li jump rate reaches values in the order of 1 kHz (or larger) the NMR line starts to narrow.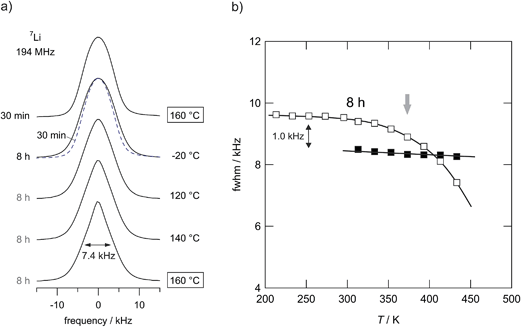 | ||
| Fig. 12 (a) Temperature-variable 7Li NMR spectra of LiAlO2 milled for 8 h and 30 min, respectively. Spectra have been recorded under static conditions. The sample milled for 8 h shows significant motional narrowing at temperatures above 350 K. Starting from about 9.6 kHz the line width decreases to 7.4 kHz at 433 K. At this temperature, LiAlO2 treated for only 30 min does not reveal any significant line narrowing (see also the spectrum shown by a dashed line). Thus, jump rates are still below 1 kHz in this T range. However, compared to the microcrystalline sample Li ion conductivity has increased drastically as shown in Fig. 9. (b) 7Li NMR line widths of microcrystalline (■) γ-LiAlO2 in comparison with the line narrowing of the sample milled for 8 h (□). | ||
As is illustrated by the 7Li NMR spectra shown in Fig. 12(a), line narrowing sets in at approximately 375 K (see Fig. 12(b)) for the sample that has been treated for 8 hours in the planetary mill. The corresponding NMR line of the microcrystalline source material, however, does not change up to temperatures as high as 430 K; compared to the nanocrystalline/amorphous sample motional narrowing is expected to occur at much higher temperatures. A slight motional narrowing effect is also detected for the sample milled for 30 min. It is, however, significantly less distinct than that observed for the samples treated for many hours. Even though the mean jump rates are still in the order of 1 kHz in this T range, which is as expected from the conductivity values probed, when referenced to the microcrystalline sample, σdc has drastically been increased after 30 min of milling (see Fig. 10). Altogether, in a qualitative way, the preliminary 7Li NMR line shape measurements corroborate enhanced ion diffusivity in ball-milled LiAlO2.
If we assume that at 375 K, this is the temperature at which MN starts, the mean jump rate is in the order of 103 s−1; we can estimate a Li diffusion coefficient according to the Einstein–Smoluchowski equation. Using a mean jump distance of 2.5 Å this yields, anticipating 3D uncorrelated motion, a self-diffusion coefficient D in the order of 6 × 10⁻¹⁸ m2 s−1. This result corresponds to a conductivity value of 8 × 10⁻⁹ S cm−1 if we use the Nernst–Einstein equation to correlate D with σ. Experimentally we found that σdc is ca. 2 × 10⁻⁹ S cm−1 at 375 K. Thus, the D value estimated from NMR agrees reasonably well with the result from conductivity spectroscopy. It gives further evidence that σdc, which has been determined from the plateau of the σ′(ω) isotherms, is mainly governed by ionic contributions as has been indicated by the preliminary polarization experiments mentioned above.
Noteworthy, the rigid-lattice line widths of the two samples shown in Fig. 12(b) differ from each other. The line widths of the ball milled samples exceeds that of the microcrystalline one. According to van Vleck's formula,47 see also ref. 48, the NMR line width in the rigid lattice regime is inversely proportional to the mean Li–Li distance r. Thus, one might conclude that the mean value of r in LiAlO2 that has been mechanically treated is slightly smaller than in the non-treated form or that heteronuclear 7Li–27Al dipolar couplings are somewhat larger than that in the crystalline starting material. A smaller distance r is consistent with the change of the crystal structure from γ-LiAlO2 towards δ-LiAlO2 having a much higher density. Independent of any phase transformations, a similar effect on the rigid-lattice line widths has also been observed for amorphous LiNbO3 (ref. 24) and ball-milled LiTaO3.25
4 Summary and conclusions
LiAlO2 is a new example that shows a drastic increase of the Li ion conductivity after it has been mechanically treated in a high-energy ball mill. We used the commercially available γ-modification of lithium aluminate to study the influence of high-energy ball milling on Li ion transport, specifically the Li ion conductivity by evaluating σ′ isotherms recorded over a broad frequency range.Already after 30 min of milling, the ion conductivity increased by four orders of magnitude when temperatures around 400 K are considered. This is related to the large number of defects introduced during milling. Another increase of σdc by approximately two orders of magnitude is detected after milling the source material for 8 h. Owing to the significant reduction in activation energy (0.79 eV (8 h, nanocrystalline/amorphous) vs. 1.13 eV (microcrystalline source material)), this corresponds to an increase of σdc at room temperature by a factor of 107. HR-TEM and XRD (as well as SAXS) measurements show that a large amount of amorphous LiAlO2 is responsible for the overall huge increase observed. After the starting material has been treated for many hours in a high-energy planetary mill, nanocrystallites of LiAlO2 are formed that seem to be embedded in an amorphous matrix of the same chemical composition. The latter is corroborated by the fact that after annealing the nanocrystalline/amorphous sample at 1173 K, phase-pure, microcrystalline γ-LiAlO2 is re-obtained. Recent work pointed out that in certain cases, and especially after annealing, thin layers of LiAlO2 cover the surfaces of polycrystalline LLZ. The conductivity of such thin layers formed after surface impurity segregation is key to the functionality of solid electrolytes and thus long-range ion transport in all-solid-state energy storage systems.
Besides studying ionic conductivity, we investigated the structural changes which occur during the milling process; they seem to be rather complex. For milling times longer than one hour further XRD reflections to those assigned to γ-LiAlO2 arise that point to the formation of another nanocrystalline and structurally disordered phase. Both XRD and 27Al MAS NMR measurements lead to the assumption that this new nanocrystalline phase can be identified with the high pressure phase δ-LiAlO2; it has been reported that δ-LiAlO2 is formed at extremely high pressures of up to 48 GPa combined with hot spots of 1570 K.
Summing up, microcrystalline lithium aluminate, which is a very poor ion conductor in its crystalline form, can be turned into an Li ion conductor by a mechanical action using high-energy ball milling. Mechanical treatment leads to the formation of amorphous LiAlO2 with drastically enhanced transport properties. By variation of the milling time it is possible to adjust the degree of structural disorder and, thus, also to control the ion conductivity of the oxide ceramic giving the freedom to design solid electrolytes with desired properties.
Acknowledgements
We thank our colleagues at the TU Graz and the Leibniz University Hannover for valuable discussions. We gratefully acknowledge the help of V. Pregartner (TU Graz, ICTM) to prepare and characterize the samples. Moreover, we thank Sanja Simic (Graz Centre for Electron Microscopy) for her help in taking the SEM pictures. Financial support by the Austrian Federal Ministry of Science, Research and Economy, and the Austrian National Foundation for Research, Technology and Development is greatly appreciated. Furthermore, we thank the Deutsche Forschungsgemeinschaft (DFG) for financial support within the DFG Research Unit 1277, grants no. WI3600/2-1 and 4-1, and the DFG Priority Program (SPP) 1415, grant no. WI3600/5-1.References
- P. Heitjans and S. Indris, J. Phys.: Condens. Matter, 2003, 15, R1257 CrossRef CAS.
- H. Mehrer, Diffusion in Solids, Springer, Berlin, Heidelberg, 2009 Search PubMed.
- Diffusion in Condensed Matter – Methods, Materials, Models, ed. P. Heitjans and J. Kärger, Springer, Berlin, Heidelberg, 2005 Search PubMed.
- P. Knauth, Solid State Ionics, 2009, 180, 911 CrossRef CAS.
- E. Quartarone and P. Mustarelli, Chem. Soc. Rev., 2011, 40, 2525 RSC.
- V. Thangadurai and W. Weppner, Ionics, 2006, 12, 81 CrossRef CAS.
- R. Murugan, V. Thangadurai and W. Weppner, Angew. Chem., Int. Ed., 2007, 46, 7778 CrossRef CAS PubMed.
- H. Buschmann, J. Dölle, S. Berendts, A. Kuhn, P. Bottke, M. Wilkening, P. Heitjans, A. Senyshyn, H. Ehrenberg, A. Lotnyk, V. Duppel, L. Kienle and J. Janek, Phys. Chem. Chem. Phys., 2011, 13, 19378 RSC.
- N. Kamaya, K. Homma, Y. Yamakawa, M. Hirayama, R. Kanno and M. Yonemura, Nat. Mater., 2011, 10, 628 CrossRef PubMed.
- P. Bron, S. Johansson, K. Zick, J. S. auf der Günne, S. Dehnen and B. Roling, J. Am. Chem. Soc., 2013, 135, 15694 CrossRef CAS PubMed.
- Z. Liu, W. Fu, E. A. Payzant, X. Yu, Z. Wu, N. J. Dudney, J. Kiggans, K. Hong, A. J. Rondinone and C. Liang, J. Am. Chem. Soc., 2013, 135, 975 CrossRef CAS PubMed.
- V. Epp, Ö. Gün, H.-J. Deiseroth and M. Wilkening, J. Phys. Chem. Lett., 2013, 4, 2118 CrossRef CAS.
- H.-J. Deiseroth, S.-T. Kong, H. Eckert, J. Vannahme, C. Reiner, T. Zaiss and M. Schlosser, Angew. Chem., Int. Ed., 2008, 47, 755 CrossRef CAS PubMed.
- A. Hayashi and M. Tatsumisago, Electron. Mater. Lett., 2012, 8, 199 CrossRef CAS.
- F. Mizuno, A. Hayashi, K. Tadanaga and M. Tatsumisago, Adv. Mater., 2005, 17, 918 CrossRef CAS.
- J. B. Bates, N. J. Dudney, G. R. Gruzalski, R. A. Zuhr, A. Choundhury, C. F. Luck and J. D. Robertson, Solid State Ionics, 1992, 53–56, 647 CrossRef CAS.
- S. Indris, P. Heitjans, R. Uecker and B. Roling, J. Phys. Chem. C, 2012, 116, 14243 CAS.
- M. Marezio, Acta Crystallogr., 1965, 19, 396 CrossRef CAS.
- H. Cao, B. Xia, Y. Zhang and N. Xu, Solid State Ionics, 2005, 176, 911 CrossRef CAS.
- K. Okada, N. Machida, M. Naito, T. Shigematsu, S. Ito, S. Fujiki, M. Nakano and Y. Aihara, Solid State Ionics, 2014, 255, 120 CrossRef CAS.
- Y. Li, J. T. Han, C. An Wang, H. Xie and J. B. Goodenough, J. Mater. Chem., 2012, 22, 15357 RSC.
- L. Cheng, J. S. Park, H. Hou, V. Zorba, G. Chen, T. Richardson, J. Cabana, R. Russo and M. Doeff, J. Mater. Chem. A, 2014, 2, 172 CAS.
- J.-P. Jacobs, M. A. San Miguel, L. J. Alvarez and P. B. Giral, J. Nucl. Mater., 1996, 232, 131 CrossRef CAS.
- P. Heitjans, M. Masoud, A. Feldhoff and M. Wilkening, Faraday Discuss., 2007, 134, 67 RSC.
- M. Wilkening, V. Epp, A. Feldhoff and P. Heitjans, J. Phys. Chem. C, 2008, 112, 9291 CAS.
- P. Heitjans, E. Tobschall and M. Wilkening, Eur. Phys. J.: Spec. Top., 2008, 97, 161 Search PubMed.
- P. Heitjans and M. Wilkening, Mater. Res. Bull., 2009, 34, 915 CrossRef CAS.
- P. Heitjans and M. Wilkening, Defect Diffus. Forum, 2009, 283–286, 705 CrossRef CAS.
- M. Wilkening, S. Indris and P. Heitjans, Phys. Chem. Chem. Phys., 2003, 5, 2225 RSC.
- P. Scherrer, Göttinger Nachrichten, 1918, 2, 98 Search PubMed.
- X. Li, T. Kobayashi, F. Zhang, K. Kimoto and T. Sekine, J. Solid State Chem., 2004, 177, 1939 CrossRef CAS.
- M. Marezio and J. Remeika, J. Chem. Phys., 1966, 44, 3143 CrossRef CAS.
- H. A. Lehmann and H. Z. Hesselbarth, Z. Anorg. Allg. Chem., 1961, 313, 117 CrossRef CAS.
- C. H. Chang and J. L. Margrave, J. Am. Chem. Soc., 1968, 44, 2020 CrossRef.
- D. Müller, W. Gessner and G. Scheler, Polyhedron, 1983, 2, 1195 CrossRef.
- A. Düvel, E. Romanova, M. Sharifi, D. Freude, M. Wark, P. Heitjans and M. Wilkening, J. Phys. Chem. C, 2011, 115, 22770 Search PubMed.
- F. Preishuber-Pflügl and M. Wilkening, Dalton Trans., 2014, 9901 RSC.
- S. K. Sinha, E. B. Sirota, S. Garoff and H. B. Stanley, Phys. Rev. B: Condens. Matter Mater. Phys., 1988, 38, 2297 CrossRef.
- Small-angle X-ray Scattering, ed. O. Glatter and O. Kratky, London: Academic Press, London, 1982 Search PubMed.
- A. K. Jonscher, Nature, 1977, 267, 673 CrossRef CAS.
- J. Rahn, E. Hüger, L. Dörrer, B. Ruprecht, P. Heitjans and H. Schmidt, Defect Diffus. Forum, 2012, 76–74, 323 Search PubMed.
- J. Rahn, E. Hüger, L. Dörrer, B. Ruprecht, P. Heitjans and H. Schmidt, Z. Physiol. Chem., 2012, 226, 439 CrossRef CAS.
- M. Wilkening, D. Bork, S. Indris and P. Heitjans, Phys. Chem. Chem. Phys., 2002, 4, 3246 RSC.
- A. Dunst, V. Epp, I. Hanzu, S. Freunberger and M. Wilkening, Energy Environ. Sci., 2014, 7, 2739 CAS.
- J. Maier, Z. Physiol. Chem., 2003, 217, 415 CrossRef CAS.
- J. Maier, Nat. Mater., 2005, 4, 805 CrossRef CAS PubMed.
- J. H. Van Vleck, Phys. Rev., 1948, 74, 1168 CrossRef.
- A. Abragam, The Principles of Nuclear Magnetism, Oxford University Press, Oxford, 1999 Search PubMed.
| This journal is © The Royal Society of Chemistry 2014 |

