 Open Access Article
 This Open Access Article is licensed under a
 Creative Commons Attribution 3.0 Unported Licence
Solid acids with SO3H groups and tunable surface properties: versatile catalysts for biomass conversion†
P. A.
Russo‡
a,
M. M.
Antunes‡
a,
P.
Neves
a,
P. V.
Wiper
a,
E.
Fazio
b,
F.
Neri
b,
F.
Barreca
b,
L.
Mafra
a,
M.
Pillinger
a,
N.
Pinna
*c and
A. A.
Valente
*a
aDepartment of Chemistry, CICECO, University of Aveiro, Campus de Santiago, 3810-193 Aveiro, Portugal. E-mail: atav@ua.pt
bUniversità degli Studi di Messina, Dipartimento di Fisica e di Scienze della Terra, Viale F. Stagno d'Alcontres, 31 98166 Messina, Italy
cInstitut für Chemie, Humboldt Universität zu Berlin, Brook-Taylor-Straße 2, 12489 Berlin, Germany. E-mail: nicola.pinna@hu-berlin.de
First published on 3rd June 2014
Abstract
Acid catalysis plays an important role in biomass conversion processes for producing chemicals and fuels. We report a relatively simple procedure for synthesizing versatile, strong acid catalysts based on carbon and carbon–silica composites with sulfonic acid groups. The process involves chemical activation of a sulfonic acid organic precursor at low temperature. The synthesis conditions can be modified to tune the surface composition, texture, and the acid properties of the materials towards superior catalytic performances. Molecular level insights into the nature and strength of the acid sites were gained by combining high resolution XPS and 1H-decoupled 31P MAS NMR spectroscopy of adsorbed triethylphosphine oxide. These materials are effective acid catalysts for the conversion of different biomass-derived chemicals to useful bio products such as furanic ethers and levulinate esters.
Introduction
Intensive research efforts are being devoted to the development of sustainable routes for producing chemicals and fuels. The use of renewable feedstocks and heterogeneous catalytic processes are making a significant contribution to accomplishing this goal.1–3 In this context, there is strong interest in developing efficient and stable heterogeneous acid catalysts, since they are more environmentally friendly than their homogeneous analogues and a wide range of important industrial reactions are catalyzed by acids.2,4Carbon-based materials containing sulfonic acid (SO3H) groups are especially attractive catalysts due to their low cost, metal-free composition, and expected high stability and strong acidity. Therefore, the synthesis and catalytic properties of several types of carbon-based materials modified with SO3H groups have recently been reported.5–18 In particular, the sulfonation of carbons synthesized by incomplete carbonization (below ca. 450 °C)4,5,11–13 or hydrothermal carbonization (below ca. 250 °C)14,17,19–21 of organic matter can generate solids with high contents of acid functionalities (<2.5 mmol g−1 of COOH, SO3H and OH). Indeed, materials produced by the former approach have shown very promising catalytic activity for many acid-catalyzed reactions, performing better, for example, in the hydrolysis of cellulose and production of biodiesel, than commercial catalysts like zeolites, niobic acid or Amberlyst-15.5,12,22 However, carbons prepared by partial carbonization of organic molecules have extremely low surface areas (<10 m2 g−1). If the reactants are unable to reach the acid sites in the bulk, the low surface area available for reaction leads to poor catalytic activity. This problem can be overcome by depositing the carbon precursor over a large surface area silica prior to carbonization.15 Additionally, the catalyst morphology and porosity can be controlled, with the silica providing mechanical stability.16,23 An important requirement for sulfonated carbon catalysts is stability towards leaching of sulfur-containing species into the reaction mixtures, which is not easily accomplished and has detrimental effects on the catalytic performances.10,20,24,25 This problem can be pronounced for solids prepared at low temperatures. Moreover, the functionalization with SO3H groups is frequently accomplished by heating the carbon in large volumes of concentrated H2SO4 or fuming H2SO4 (ca. ≥20 mL to 1 g of solid) above 150 °C, which is a hazardous process that generates large amounts of neutralization wastes. Therefore, synthesis procedures have recently been developed in order to eliminate this step.14,16,21,26 Carbons with SO3H groups were prepared by hydrothermal carbonization of mixtures of organic compounds including glucose, resorcinol, furaldehyde, p-toluenesulfonic acid and hydroxyethylsulfonic acid.14,20,21,26 The resulting solids exhibited interesting catalytic performances, but leaching of sulfur-containing moieties was problematic for some of the materials.20
Chemical activation allows the production of carbons with controlled porosity.27–30 This method involves the impregnation of a carbon or carbon precursor with a chemical agent followed by pyrolysis. Several chemicals can act as activating agents, with phosphoric acid and alkali metal hydroxides being the most widely used.27–30 The pyrolysis is typically accomplished at lower temperatures and shorter times compared to common carbonization/physical activation processes, as the activating agent can promote the reactions involved in the transformation of the precursor into carbon (e.g. dehydrogenation or dehydration), as well as the formation of cross-links.28 Herein, versatile carbon and carbon–silica composites containing sulfonic acid groups were prepared using a relatively simple procedure. The process involves chemical activation with H2SO4 of a sulfonic acid organic precursor (p-toluenesulfonic acid) at low temperature. The prepared solid acids were tested as catalysts in the reactions of biomass-derived 5-hydroxymethyl-2-furaldehyde (HMF) and furfuryl alcohol (FA) with ethanol to give furanic ethers and levulinate esters (bioEs), as well as in the integrated conversion of fructose to bioEs (Fig. 1). Within a biorefinery, HMF and FA are derived from carbohydrates, the main components of lignocellulosic matter obtainable from forest, agricultural, municipal and industrial wastes.1,3,31–37 The bioEs have applications in different sectors of the chemical industry: levulinate esters can be used as solvents, plasticizing agents, odorous substances and fuel additives;38 5-(alkoxymethyl)-furfural products and the respective diacetals are interesting reagents for synthesizing surfactants;39 particularly, ethyl levulinate (EL)40–43 and 5-(ethoxymethyl)-furfural (5EMF)44 possess interesting properties as oxygenated fuel extenders for gasoline, diesel and biodiesel. Amongst the most active solid acid catalysts for producing bioEs from saccharides,45–52 HMF46,51–55 and FA56–60 are commercial ion-exchange resins such as Amberlyst™-15. Therefore, the catalytic performances of our catalysts were compared with this commercial acid resin.
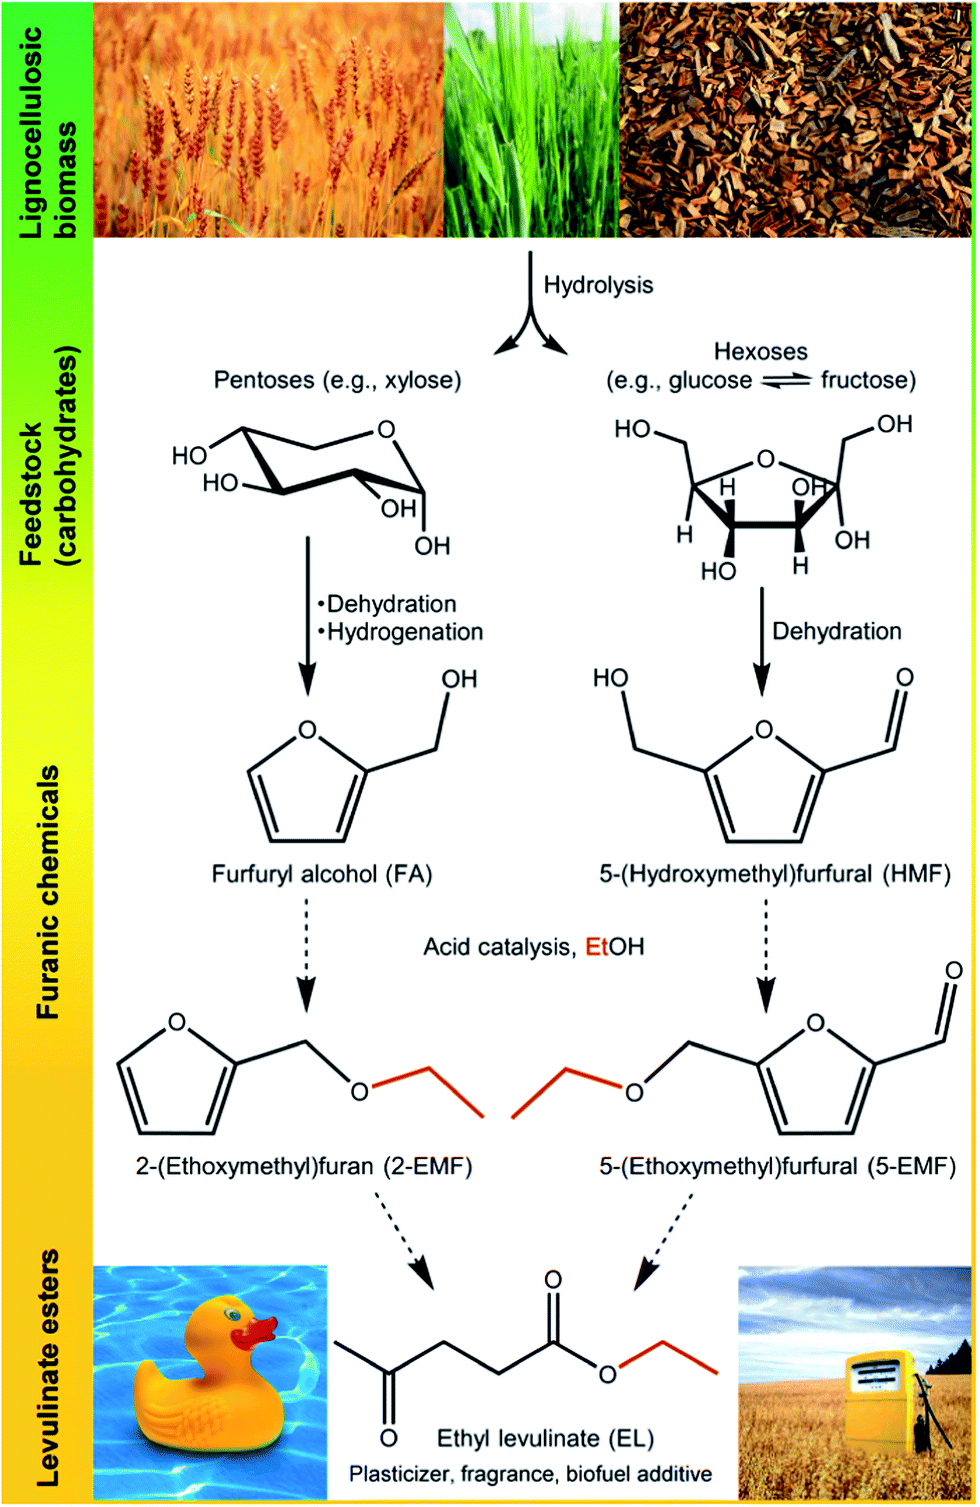 | ||
| Fig. 1 Carbohydrate biomass conversion to useful bio products. | ||
Experimental
Preparation of the materials
In the synthesis of the carbon-silica composites (CST), 2.6 g of p-toluenesulfonic acid (TsOH; Panreac) was dissolved in acetone (Aldrich, 99.9%) and added to 1 g of fumed silica (Aldrich). The suspension was sonicated for 15 min, stirred for 24 h at room temperature and then heated at 100 °C for 6 h followed by 6 h at 160 °C. Subsequently, 10 mL of aqueous H2SO4 with different concentrations (0.25, 1.0 and 2.5 M) was added to the pre-carbonized TsOH–silica solid. The amount of H2SO4 was changed in order to obtain different ratios R = mass of chemical activating agent/mass of carbon precursor. The R values were varied between 0 and 1, where 0 corresponds to a non-activated material (just partially carbonized). The suspension was stirred at room temperature for 24 h and then the water was completely evaporated by heating at 110 °C. The acid impregnated solid was then thermally treated under nitrogen flow at 250 °C for 1 h in a tubular furnace. The final solid was washed with water until neutral pH followed by acetone, and dried. These samples are denoted CST-R (0 ≤ R ≤ 1), Table 1. The pure carbon material was prepared in the same way with R = 1 (CT-1). For comparison, a silica impregnated with TsOH and heated at 160 °C (not thermally treated under N2) was prepared (CST-nc/a). A CST sample carbonized under N2 at 600 °C for 1 h was also prepared (CST-0-600).| Sample | R | T (°C) | C (wt%) | S contentc (mmol g−1) | Acid sitesd (mmol g−1) | A BET (m2 g−1) | V mp (cm3 g−1) |
|---|---|---|---|---|---|---|---|
| a Mass of chemical activating agent/mass of carbon precursor. b Temperature of the carbonization or activation step. c Carbon and sulfur contents determined by CHNS elemental analysis. d Amount of acid sites determined by acid–base titration. e BET surface area. f Micropore volume. | |||||||
| CST-0 | 0 | 250 | 34.0 | 2.1 | 0.6 | 319 | 0.11 |
| CST-0.1 | 0.1 | 250 | 26.6 | 1.6 | 0.7 | 331 | 0.09 |
| CST-0.4 | 0.4 | 250 | 28.7 | 1.6 | 1.1 | 268 | 0.08 |
| CST-1 | 1.0 | 250 | 26.1 | 1.7 | 1.6 | 237 | 0.05 |
| CST-0-600 | 0 | 600 | 28.8 | 0.9 | 0.1 | n.d. | n.d. |
| CT-1 | 1.0 | 250 | 47.7 | 2.9 | 2.8 | 9 | — |
The stability of the materials was evaluated by performing pre-treatments of the solids (10 gsolid dm−3) in ethanol (ET) at 110 °C or water (WT) at 170 °C, for 24 h. The solids were subsequently washed with ethanol (for ET), or water and then ethanol (for WT); all solids were dried at 85 °C. The resulting solids are denoted sample name-ET or -WT.
For comparative purposes, catalytic tests were performed by using the cation-exchange resin Amberlyst-15, a macroreticular styrene-divinylbenzene copolymer that bears benzenesulfonic acid groups and nanocrystalline beta zeolite in the protonated form (H-beta). Prior to use, the commercial Amberlyst-15 (FlukaChemika, in the form of beads) was ground and sieved to give a very fine powder. H-beta was prepared by calcination of commercial ammonium-form beta zeolite powder (NH4BEA, Zeolyst, CP814; crystallites with size of ca. 20–30 nm) at 550 °C for 10 h with a ramp rate of 1 °C min−1 in static air.
Characterization
The carbon and sulfur contents of the samples were determined by elemental analysis with a TruSpec 630 elemental analyzer. Powder X-ray diffraction (XRD) patterns were measured on a PANalytical Empyrean diffractometer at 45 kV and 40 mA, from 5 to 90° (2θ), with a step size of 0.08° and time per step of 400 s, using Cu Kα radiation (λ = 0.1541 nm). FT-IR spectra were recorded on a Bruker Tensor 27 spectrometer using pellets of the sample mixed with KBr (400–4000 cm−1, 256 scans, 4 cm−1 resolution). Raman measurements were carried out on a JobinYvon T64000 spectrometer (laser λ: 532 nm). X-ray photoelectron spectroscopy (XPS) analysis was performed on a K-Alpha system from Thermo Scientific, equipped with a monochromatic Al Kα source (1486.6 eV), and operating in constant analyzer energy (CAE) mode with a pass energy of 200 and 50 eV for survey and high resolution spectra, respectively. A spot size diameter of about 400 μm was adopted. Transmission electron microscopy (TEM) and high resolution TEM (HRTEM) images were recorded with Philips CM200 and JEOL 2200FS microscopes, respectively, at 200 kV. Nitrogen adsorption isotherms at −196 °C were measured with a Micromeritics Gemini 2380, after degassing of the samples at 120 °C overnight. The surface areas were calculated with the Brunauer–Emmett–Teller (BET) equation and the micropore volumes were calculated using the αs method, using standard data for N2 adsorption on non-porous carbon. Thermogravimetric analyses (TGA) were performed from room temperature to 700 °C, with a heating rate of 5 °C min−1, under air flow on a Shimadzu TGA-50. The total acid sites content was determined by acid–base titration: the sample (0.1–0.2 g) was stirred at room temperature for 24 h in 20 mL of 0.1 M NaCl, and then titrated with 0.01 M NaOH. The acid strength of the solids was evaluated by 31P MAS NMR of chemically adsorbed triethylphosphine oxide (TEPO). The adsorption of TEPO was performed as follows: 0.1 g of solid was dehydrated at 110–120 °C under vacuum. 0.015 g of TEPO dissolved in 5 mL of anhydrous n-pentane was added to the solid, and the mixture was stirred for 30 min under nitrogen, and then dried at 50 °C under vacuum. Solid-state NMR experiments were acquired on a Bruker Avance III 400 spectrometer using a 4 mm double resonance probe operating at a B0 field of 9.4 T (400 MHz) with a 31P Larmor frequency of 161.9 MHz. 31P {1H} MAS NMR spectra were recorded using a rotation speed of 12 kHz, a single excitation pulse width of 1.9 μs, employing a radio-frequency field strength of 56 kHz (60° flip angle) and 15 s recycle delay. TPPM-15 scheme was used for 1H heteronuclear decoupling.Catalytic tests
The batch catalytic experiments were performed in tubular glass reactors with pear-shaped bottoms and equipped with an appropriate PTFE-coated magnetic stirring bar and a valve. In a typical procedure, 0.33 M 5-(hydroxymethyl)-2-furfural (HMF, Aldrich, 99%) or furfuryl alcohol (FA, Aldrich, 99%), powdered catalyst (loading of up to 10 gcat dm−3), and 1 mL of ethanol (Scharlau, 99.9%) were added to the reactor at 110 °C. The reaction of fructose (0.33 M) in the presence of the catalyst (10 gcat dm−3) was carried out using a water–ethanol (3![[thin space (1/6-em)]](https://www.rsc.org/images/entities/char_2009.gif) :7 v/v ratio) solvent mixture, in the temperature range 110–170 °C. The reaction mixtures were heated with a thermostatically controlled oil bath, under continuous magnetic stirring at 1000 rpm. Zero time (the instant the reaction began) was taken to be the instant the micro-reactor was immersed in the oil bath. The heating time to reach 110–140 °C was 3–4 min, and to reach 170 °C, was 6 min. The initial reaction rates are based on conversion at 30 min reaction. The CST-1 catalyst was separated, after a 4 h batch run by centrifugation, washed with ethanol and then water, and subsequently treated with H2SO4 (0.2 M) for 4 h at 30 °C. The catalyst was subsequently washed with water until the pH was neutral and dried at 85 °C overnight.
:7 v/v ratio) solvent mixture, in the temperature range 110–170 °C. The reaction mixtures were heated with a thermostatically controlled oil bath, under continuous magnetic stirring at 1000 rpm. Zero time (the instant the reaction began) was taken to be the instant the micro-reactor was immersed in the oil bath. The heating time to reach 110–140 °C was 3–4 min, and to reach 170 °C, was 6 min. The initial reaction rates are based on conversion at 30 min reaction. The CST-1 catalyst was separated, after a 4 h batch run by centrifugation, washed with ethanol and then water, and subsequently treated with H2SO4 (0.2 M) for 4 h at 30 °C. The catalyst was subsequently washed with water until the pH was neutral and dried at 85 °C overnight.
The evolution of the catalytic reactions was monitored by GC (for quantification of bioEs and FA) and HPLC (for quantification of HMF and fructose). Prior to sampling, the reactors were cooled to ambient temperature before opening and work-up procedures, and no pressure-release was verified. The GC analyses were carried out using a Varian 3800 equipped with a capillary column (Chrompack, CP-SIL 5CB, 50 m × 0.32 mm × 0.5 μm) and a flame ionisation detector, using H2 as carrier gas. Authentic samples of the substrates were used as standards, and calibration curves were measured for quantification. The HPLC analyses were carried out using a Knauer Smartline HPLC Pump 100 and a Shodex SH1011 H+ 300 mm × 8 mm (i.d.) ion exchange column (Showa Denko America, Inc., New York), coupled to a Knauer Smartline UV detector 2520 (254 nm for HMF), and a Knauer Smartline 2300 differential refractive index detector (for fructose); the mobile phase was 0.005 M aq. H2SO4 at a flow rate of 0.8 mL min−1, and the column temperature was 50 °C. The identification of the reaction products was accomplished by GC-MS using a Trace GC 2000 Series (Thermo Quest CE Instruments) – DSQ II (Thermo Scientific), equipped with a capillary column (DB-5 MS, 30 m × 0.25 mm × 0.25 μm), using He as carrier gas. Individual experiments were performed for a given reaction time and the presented results are the mean values of at least two replicates.
The substrate (Sub) conversion (%) at reaction time t was calculated using the formula: 100 × [(initial concentration of Sub) − (concentration of Sub at time t)]/(initial concentration of Sub). The yield of product (Pro) (%) at reaction time t was calculated using the formula: 100 × [(concentration of Pro at time t)/(initial concentration of Sub)].
The bioEs products were EL (ethyl levulinate) and 5EMF (5-(ethoxymethyl)-furfural) for fructose and HMF as substrates, and EL and 2EMF (2-(ethoxymethyl)-furan) for FA as substrate.
Results and discussion
Effect of the synthesis conditions on the properties of the materials
Carbon (CT-1) and carbon–silica composites (CST-R) were prepared by chemical activation of p-toluenesulfonic acid (TsOH) with sulfuric acid at 250 °C. In particular, the CST-R materials consist of a carbon film deposited on fumed silica particles of ca. 7–10 nm (Fig. 2) and were synthesized using different H2SO4/organic precursor mass ratios (R). For comparison, a related material was prepared by carbonization at 600 °C to give CST-0-600. | ||
| Fig. 2 TEM images of the (a) silica support, (b) CST-1 composite, and HRTEM images of (c) CST-1 and (d) CST-0. | ||
The carbon component of the composites accounts for ca. 40% of the materials weight, as ascertained by TGA (Fig. S1, ESI†). The sulfur content of the final solids depends on the synthesis conditions (Table 1). Carbonization at 600 °C results in a material with low S content (CST-0-600) in comparison to materials synthesized at 250 °C. The chemically activated CST composites have similar S contents, which correlates with the similar amount of carbon precursor used for their syntheses, and does not correlate with R. These results suggest that the S groups in the final solids derive essentially from the carbon precursor. In fact, the amount of S was higher when no chemical activating agent was added (CST-0). The amount of sulfur and acid sites per mass of material is higher for CT-1 than CST-1 due to the absence of the silica component on the former. In fact, if we only take into account the mass of carbon component of the materials for calculating the S and acid sites content, higher values are obtained for CST-1 with respect to CT-1. Hence, a more sulfur-enriched carbon is produced via the coating approach, as a result of the dispersion of the carbon over the silica. It is possible that reactions such as condensation between the silica surface (e.g. silanol groups) and the organic (e.g. SO3H groups) take place during carbonization, leading to a strong interaction between carbon and silica.61
The surface texture of the carbon and composite materials is very different (Table 1, Fig. S2, ESI†). The CT-1 material has very low specific surface area, which is not much higher than those of carbons produced by incomplete carbonization of carbohydrates and other organic molecules.4,14,24 Coating the silica particles with the carbon film allows the control of the catalyst morphology and, additionally, of the surface area. The silica support is a high surface area non-porous solid (ABET = 346 m2 g−1, Fig. S3, ESI†). The composites also have relatively high surface areas, and their surface texture depends on R. For R = 0 (CST-0) a highly microporous carbon coating was formed, whereas the micropore volume decreases with increasing R. For CST-0, the isotherm is close to type I, typical of microporous solids, and the absence of hysteresis indicates that the sample does not have mesopores. The amount adsorbed at intermediate and high p/p0 tends to increase as R increases. Moreover, for CST-0.4 and CST-1, the isotherms exhibit H3 hysteresis cycles, indicating the presence of slit-like shaped mesopores on the materials (Fig. S2, ESI†). The hysteresis cycle is larger over a wider range of p/p0 for CST-1 compared to CST-0.4, and is associated to higher amounts of N2 adsorbed, which suggests that CST-1 has more mesoporosity than CST-0.4. These results suggest that some micropores are converted into mesopores by increasing R. The creation and enlargement of pores is an intrinsic characteristic of chemical activation processes,29,30 and it is caused by the chemical attack on the carbon matrix.
The powder X-ray diffractograms of the materials show a broad peak centered at 22° (2θ), corresponding to diffraction by (002) graphitic planes (Fig. S4, ESI†), that indicates the presence of amorphous carbon on the solids with a highly disordered arrangement of small carbon sheets.12,22 The Raman spectra (Fig. S5, ESI†) exhibit broad bands at 1355 and 1855 cm−1 ascribed to the carbon A1g and E2g vibration modes, confirming the highly disordered structure of the carbon.11
Assessment of the type and relative amounts of the surface functional groups in the materials was made by combining FT-IR, high resolution XPS and solid state NMR techniques. For comparison, a CST composite prepared with R = 0 and without thermal treatment under N2 (CST-nc/a) was also investigated.
The FT-IR spectra of the composites exhibit bands at 468, 808, 970 and 1101 cm−1 associated to the silica component of the materials (Fig. S6, ESI†). The spectrum of CST-nc/a (Fig. 3f), in addition to the bands of the silica component, shows bands typical of aromatic organic compounds.62 In particular, the bands at 686 and 570 cm−1 are attributed to aromatic C–H bending and out-of-plane ring bending, respectively. These bands are still visible in the spectrum of CST-0 (Fig. 3e), although with relatively low intensity, suggesting that CST-0 still contains some non-carbonized precursor. On the contrary, these bands are not observed in the spectra of the chemically activated materials and CST-0-600 sample (Fig. S6, ESI†) indicating that pyrolysis was more extensive for these materials, which reflects the promoting role of the activating agent on the transformation of the precursor into carbon. The 1H 13C CP MAS NMR data is in agreement with these results (Fig. S7 and S8, ESI†). The bands at 1175 and 1028 cm−1 in the CT-1 spectrum are related to the SO3H groups,11,12 while those at 1715, 1771 and 1389 cm−1 are ascribed to ketones, carboxylic acids and hydroxyl groups respectively (Fig. 3a). Moreover, the band at ca. 620 cm−1 has been attributed to the stretching of C–S bonds.12
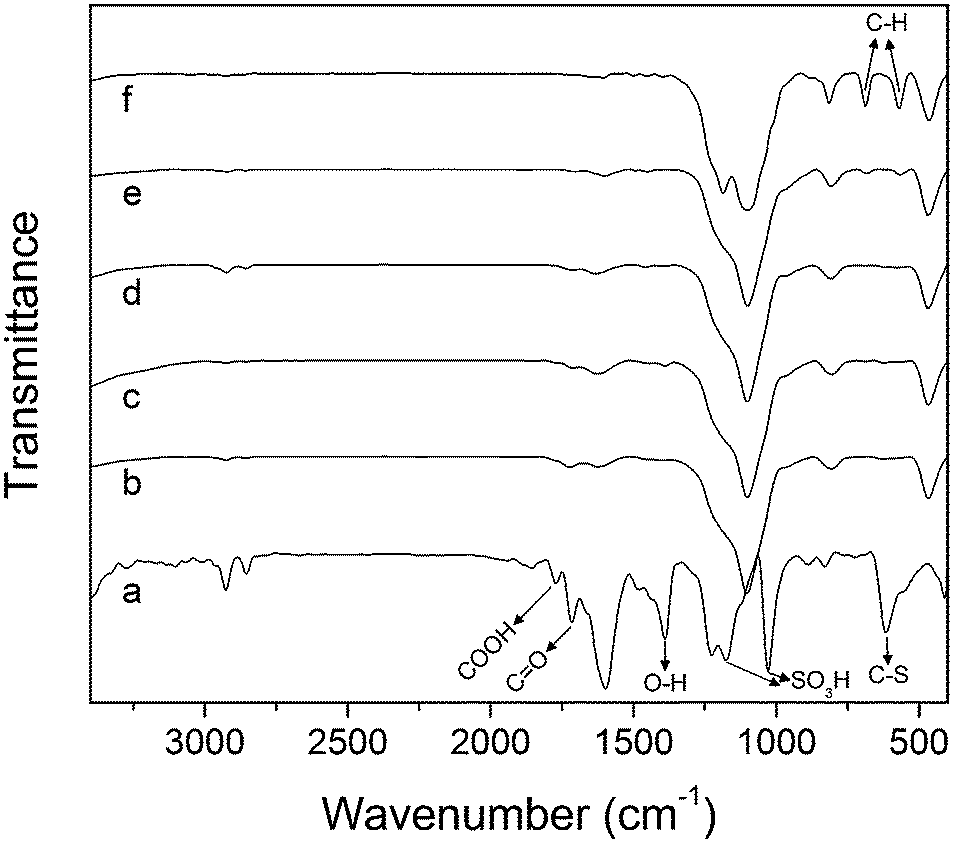 | ||
| Fig. 3 FT-IR spectra of (a) CT-1, (b) CST-1, (c) CST-0.4, (d) CST-0.1, (e) CST-0 and (f) CST-nc/a. | ||
These bands are difficult to see in the spectra of the composites due to the comparatively high intensity of the bands associated to the silica. Nevertheless, for the composites, those assigned to COOH and C![[double bond, length as m-dash]](https://www.rsc.org/images/entities/char_e001.gif) O groups become more intense as R increases, suggesting an increase in the degree of the carbon oxidation (Fig. 3b–d).
O groups become more intense as R increases, suggesting an increase in the degree of the carbon oxidation (Fig. 3b–d).
The S 2p X-ray photoelectron spectra of the composites exhibit 2 contributions, whose relative intensity depends on R (Fig. 4). The band at 169 eV is attributed to sulfur in SO3H groups and the band at 164 eV indicates the presence of sulfur in SH groups.63,64 The SH/SO3H ratio is 0.7, 1.0, 0.6 and 0.2 for R = 0, 0.1, 0.4 and 1.0, respectively (Table S1, ESI†). For CST-0 and CST-0.1, 40–50% of the surface sulfonic acid groups are reduced to thiol groups. The relative amount of SH groups decreases as R increases, probably caused by the progressively stronger oxidizing conditions during thermal treatment under nitrogen. Hence, for CST-1 most of the sulfur corresponds to sulfonic acid groups (>80%). Differences in the C 1s profiles are also observed for different R. Deconvolution of the C 1s bands showed four contributions: a main contribution at ca. 285 eV attributed to carbon–carbon bonding, and three other contributions at higher binding energies corresponding to carbon atoms bonded to oxygen in different surface functionalities. The C–S contribution cannot be distinguished from the C–C band. The bands at 286.3 eV, 287.7 eV and 289.1 eV are attributed to C–O bonds (such as in hydroxyl groups), carbonyl and carboxylic acid groups, respectively.65,66 The ratio between the percentages corresponding to C–C and (C–O, CO or COO–), in general decreases as R increases, reflecting an increase in the degree of surface carbon oxidation (Table S2†). The percentage of C–O bonding is much lower for CST-0 and CST-0.1 compared to CST-1.
 | ||
| Fig. 4 Deconvoluted (a) S 2p and (b) C 1s X-ray photoelectron spectra of the CST-R composites. | ||
An assessment of the relative amount of acid sites and their acid strengths was obtained by 31P MAS NMR spectroscopy of adsorbed TEPO as a base probe molecule (Fig. 5; Table S3 of ESI† for the deconvolution fitting data). The spectra show distinct profiles for each material, indicating that the acid properties are significantly influenced by the preparation conditions. The CST materials show essentially six resonances with a range of chemical shift values spanning from ca. 50 to 100 ppm. The interaction of TEPO with acid sites of increasing strength causes the 31P resonance to shift downfield, i.e., stronger acid sites lead to higher chemical shifts.67,68 Therefore, the materials contain acidity ranging from weak (∼50–60 ppm), medium (∼70 ppm), strong (∼80 ppm) to very strong (90–100 ppm). Moreover, the 31P spectra and deconvolution values for the CST-0, CST-0.1, CST-0.4 and CST-1 materials indicate that the chemical shift values and peak intensities of certain resonances change across the series. For example, in CST-0.1, the strongest acid site is ca. 97 ppm, and the most abundant acid site is at 61 ppm with a percentage area of 56%. Comparing these values with those in the CST-1 material, the strongest acid site is ca. 100 ppm and its most abundant acid site is 88 ppm. This means that not only does the overall acidity become stronger, but also the amount of stronger acid sites increases as a function of increasing R values. The resonance at ca. 48 ppm is ascribed to physisorbed TEPO.69 According to the FT-IR and XPS results, the CST-materials have different types of acid sites with varied strength. Therefore, the resonances at ca. 61 and 72 ppm are probably associated with the relatively weaker OH and COOH acid groups, respectively, and those at higher chemical shifts correspond to the stronger SO3H groups.10 The resonance at ca. 97–100 ppm may be due to TEPO interacting with sulfuric ester groups, since these groups are expected to be stronger than SO3H. However, sulfuric esters could not be identified by FT-IR or XPS. On the basis of the FT-IR, 13C NMR and 31P NMR data for CST-0, the narrow and intense peak at ca. 80 ppm is ascribed to TEPO interacting with the carbon precursor. The CST-1 material not only possesses the strongest acidity, but also the greatest amount of strong acid sites compared to the other composites. By comparing the 31P NMR spectra of CT-1 and CST-1, it seems that combination of the carbon with the silica generates a higher relative amount of stronger acid sites, i.e., a stronger solid acid. The reason for this is not clear, but it may be related with interactions established between the carbon and silica. Our catalysts have a wider distribution of acid strengths than Amberlyst-15 (displays a single resonance at 90.5 ppm),10 and some stronger acid sites.
 | ||
| Fig. 5 1H-decoupled 31P MAS NMR spectra and spectral deconvolutions of the CT-1 and CST-R materials after adsorption of TEPO. | ||
The acid sites content measured by titration is the total amount of acid sites of the sample, which includes sulfonic acid, carboxylic acid and hydroxyl groups. The total amount of acid sites is lower than the sulfur content of the corresponding sample (Table 1). On the one hand, some of the sulfur is in the form of SH groups. On the other hand, since the sulfur of the materials derives from the precursor, part of it is probably located in the bulk and not at the surface. For the chemically activated composites, the difference between the S and acid sites contents decreases as R increases, which can be explained by the increase of the acidic S-containing functionalities and other acid surface groups (carboxylic acids, hydroxyls) found by XPS analysis. Carbonization at 600 °C led to very low quantity of acid sites (CST-0-600, Table 1), as most of the surface sulfonic acid groups of the precursor were decomposed at this temperature, which is disadvantageous for acid catalysis.
Catalytic studies
 | ||
| Fig. 6 Kinetic profiles of the reaction of HMF in the presence of CST-0.1 (□), CST-0.4 (Δ) and CST-1 (O) at 110 °C, or in the presence of CST-1 at 140 °C (+). Reaction conditions: [HMF]0 = 0.33 M, catalyst loading = 10 gcat dm−3 (the dashed lines are guides to the eye). | ||
 | ||
| Fig. 7 Dependency of the yields of (a) 5EMF (+, o, Δ, □) and EL (*, –, ×, ◊), or (b) bioEs (♦, ●, ▲, ■) on the time of the reaction of HMF in the presence of CST-0.1 (□, ◊, ■), CST-0.4 (Δ, –, ▲) or CST-1 (o, ×, ●) at 110 °C, or in the presence of CST-1 at 140 °C (+, *, ♦). Reaction conditions: [HMF]0 = 0.33 M; catalyst loading = 10 gcat dm−3 (the dashed lines are guides to the eye). | ||
| Catalyst | Time (h) | Conversion (%) | Yields of bioEs products (%) | ||
|---|---|---|---|---|---|
| 5EMF | EL | bioEs | |||
| a Reaction conditions: [HMF]0 = 0.33 M; catalyst loading = 10 gcat dm−3, 110 °C. | |||||
| CST-0.1 | 4/16 | 83/99 | 62/83 | 7/13 | 69/96 |
| CST-0.4 | 4/6 | 91/97 | 76/86 | 8/9 | 84/95 |
| CST-1 (run 1) | 4 | 99 | 84 | 13 | 97 |
| CST-1 (run 2) | 4 | 95 | 86 | 7 | 93 |
| CST-1 (run 3) | 4 | 92 | 83 | 6 | 91 |
| CST-1-WT | 4 | 98 | 85 | 10 | 95 |
| CST-1-ET | 4 | 99 | 81 | 13 | 94 |
| CST-1-ET(2) | 4 | 99 | 80 | 15 | 95 |
| CST-0 | 4 | 96 | 75 | 15 | 90 |
| CST-0-ET | 4 | 72 | 57 | 5 | 62 |
The initial reaction rates were 16, 30 and 48 mmol gcat−1 h−1 for CST-0.1, CST-0.4 and CST-1, respectively. The higher reaction rate observed for CST-1 was accompanied by the higher initial bioEs yield at 30 min. Therefore, the CST-1 material exhibits better catalytic performance than the other composites. Moreover, the catalytic activity increases in the following order CST-0.1 < CST-0.4 < CST-1. On the basis of these results, increasing R of the synthesis leads to higher reaction rates and bioEs yields, as a result of enhanced amount and strength of the acid sites.
To get clearer insights into the intrinsic activity of the catalysts, the reaction of HMF was performed using the same initial molar ratio between HMF and the total acid sites of the material for all catalysts (HMF/AS = 50, AS denotes acid sites) (Fig. 8, S9 and S10†). The initial reaction rates were 25, 40 and 60 mol molAS−1 h−1, and the initial bioEs yields at 30 min were 15, 28 and 43% for CST-0.1, CST-0.4 and CST-1, respectively. The trends are similar to those obtained for the same catalyst loading. These results indicate that, besides the amount of acid sites, the strength of the acid sites play an important role in the conversion of HMF, with stronger acid sites favouring the overall reaction.
 | ||
| Fig. 8 Initial reaction rate of HMF and bioEs yields at 30 min for the prepared catalysts and Amberlyst-15 using the same initial molar ratio of HMF/AS = 50 (AS = acid sites). Reaction conditions: [HMF]0 = 0.33 M, 110 °C. | ||
The carbon catalyst CT-1 is less active than the related composite CST-1 (Fig. 8). For CT-1, the initial reaction rate was 40 mol molAS−1 h−1, and the total bioEs yields at 30 min reaction was 35% which increased to 73% at 96% conversion. Considering the high acid sites content and low surface area of CT-1, a significant portion of its acid sites is most likely located inside the carbon matrix and thus may be strongly hindered or even inaccessible for the catalytic reaction. Furthermore, the relative proportion of acid sites of moderate or low strength is higher for CT-1 than for CST-1, as determined by 31P NMR of adsorbed TEPO. These factors can explain the poorer catalytic performance of CT-1.
The performances of our catalysts were compared with that of the reference commercial acid-resin Amberlyst-15 (Fig. 8), which has high content of strong sulfonic acid groups (4.3 mmol g−1, as measured by acid–base titration). This solid acid has shown excellent activity in the reaction of HMF to bioEs and several other acid-catalyzed reactions. The initial reaction rate for Amberlyst-15 was 41 mol molAS−1 h−1, which is similar to that for CST-0.4 and lower than that for CST-1. The acid resin also led to lower bioEs yield at 30 min compared to these catalysts. Furthermore, for Amberlyst-15 the bioEs yield dropped at high HMF conversion (82% yield at 92% conversion dropped to 75% at 99% conversion (Fig. S9 and S10†)), while for CST-1 the yield increased continuously, reaching 97% at 100% conversion. Therefore, CST-1 possesses superior intrinsic activity for the conversion of HMF to bioEs than Amberlyst-15, despite having a much lower amount of acid sites of comparable strength. Considering the low surface area of the polymeric resin and its high sulfonic acid groups content, the acid sites density for the resin catalyst is probably much higher than the estimated maximum number of HMF molecules per unit of surface area (ca. 3 molecules nm−2),70 even after it swells. It is worth mentioning that in order to enhance the active site accessibility, the acid resin (commercialized in the form of beads) was ground prior to use, to give a very fine powder with particles of a few hundreds of nanometers (Fig. S11†). Hence, one may expect steric hindrance at the vicinity of a significant fraction of the acid sites of the resin catalyst that can affect the overall reaction of HMF. Additionally, very high acid sites density may favour undesirable consecutive reactions, decreasing the selectivity of the catalyst.
Table S4† compares the catalytic results for CST-1 with those reported in the literature for other catalysts. Some clear and fair comparisons of the catalysts can be made (tested under similar reaction conditions). Mesoporous aluminosilicates of the type Al-TUD-1 (ref. 58) and sulfonated partially reduced graphene oxide (S-RGO)10 were previously tested as catalysts in the same reaction, under similar conditions to those used in the present work. In comparison with the aluminosilicates, CST-1 exhibits higher catalytic activity and leads to higher bioEs yields in shorter reaction time, which may be partly due to its stronger acidity and higher amount of acid sites. The catalytic performance of CST-1 is comparable to that of S-RGO, and superior to those of sulfonated carbon nanotubes and carbon black.10 In comparison to those carbon catalysts, the materials tested here have advantages, including the fact that their preparation involves less drastic acidic conditions.
We further compared the catalytic performance of CST-1 to nanocrystalline zeolite H-beta; the latter led to much slower conversion of HMF to bioEs than CST-1 (Table S4†). Conversion at 4 h was 99% and 67%, and bioEs yield was 97% and 56% for CST-1 and H-beta, respectively; in the case of the zeolite the EL yield was less than 1%. The catalytic performance of CST-1 remained superior to the classical zeolite and acid resin even under much more concentrated reaction conditions, i.e. a greater initial amount of HMF (ca. 3.9 times greater than the typical conditions) and less solvent (half the amount), Fig. S12 and Table S4:† the conversions and bioEs yields at 4 h reaction were similar to those obtained using less concentrated conditions. Hence, it may be possible to further optimise the reaction conditions to achieve higher production yields of bioEs.
The CST-1 material was also tested as a catalyst in the integrated conversion of fructose to bioEs (Fig. 1). The conversion of fructose in a water–ethanol mixture (3:7, v/v; fructose was completely dissolved at room temperature) increased with the increase of the reaction temperature in the range 110–170 °C (Table 3). The main products identified were HMF, 5EMF and EL that were formed with yields of 13, 38 and 15%, respectively, at 100% conversion at 170 °C. Without adding a catalyst the conversion of fructose was 24% after 24 h reaction at 170 °C, and the HMF, 5EMF and levulinic acid (LA) yields were 14, 5 and <1%, respectively. These results are somewhat in agreement with those reported in the literature that suggest the reaction of fructose may be to a certain extent autocatalytic.71 The reaction of fructose using solely water as solvent at 170 °C led to relatively low yields of HMF and LA at 95% conversion (Table 3). Hence, the conversion of fructose using ethanol as co-solvent is more selective towards valuable bio products in comparison to the aqueous phase system. These results are in agreement with those in the literature indicating that in alcohol media the formation of humins is avoided, leading to cleaner reaction mixtures.45,54,72,73 Using this approach the product separation and purification processes may be facilitated. Comparison of the catalytic performance of CST-1 with that of Amberlyst-15 in the reaction of fructose at 110 °C (the maximum operation temperature recommended is 120 °C), indicated poorer products selectivity at similar conversion in the case of the acid resin catalyst: 9% HMF yield and no bioEs were detected at 44% fructose conversion, whereas CST-1 led to 26% HMF and 6% bioEs yield at 50% conversion.
| Solvent | Reaction conditionsa | Conv.b (%) | Product yield (%) | ||||
|---|---|---|---|---|---|---|---|
| T (°C) | t (h) | HMF | LA | 5EMF | EL | ||
| a Reaction conditions: initial molar concentration of fructose = 0.33 M, catalyst load = 10 gcat dm−3, T = reaction temperature (°C), t = time of reaction (h). b Fructose conversion. | |||||||
| Ethanol–water | 110 | 4/24 | 12/50 | 9/26 | — | —/5 | —/1 |
| Ethanol–water | 140 | 4/24 | 49/95 | 25/28 | — | 2/27 | (<1)/7 |
| Ethanol–water | 170 | 1/4/24 | 78/100/100 | 43/32/13 | <1/<1/5 | 7/24/38 | 1/5/15 |
| H2O | 170 | 24 | 95 | 9 | 20 | — | — |
 | ||
| Fig. 9 Dependence of the yield of (a) EL and (b) 2EMF on the time of reaction of FA in the presence of CT-1 (Δ), CST-0.1 (□), CST-0.4 (○) and CST-1 (◊) at 110 °C, or in the presence of CST-1 (×) at 140 °C (lines are guides to the eye). Reaction conditions: [FA]0 = 0.33 M, catalyst loading = 10 gcat dm−3. | ||
The increase of the reaction temperature to 140 °C in the presence of CST-1 led to the same maximum EL yield of ca. 81% although reached within 6 h instead of 16 h at 110 °C. The trends in the catalytic performance of the materials are similar to those observed for the reaction of HMF, but with less differences between the several catalysts. These trends are therefore explained by the differences in the amount and strength of the acid sites of the catalysts, in parallel to that discussed above for the HMF conversion.
The reaction of FA and its intermediates to EL is gradually more favoured as the acidity of the CST material increases, with CST-1 being the most active catalyst. CST-1 is also a more effective catalyst than its pure carbon analogue, as also found for the HMF reaction. Therefore, the combination of the carbon with a high surface area silica results in more effective catalysts for both the HMF and FA conversion. The CST-1 material is also a considerably better catalyst than several other solid acids tested in the reaction of FA under similar conditions, namely mesoporous aluminosilicates and zeolites.59
The samples CST-1-ET and CST-1-WT contained the same amount of sulfur and acid sites as the original solid (1.7 mmol g−1 and 1.6 mmol g−1, respectively), indicating that loss of S-containing moieties did not occur. The stability was further confirmed by testing the pre-treated samples in the reaction of HMF (Table 2). Both pre-treated samples exhibited catalytic performance identical to that of CST-1. Indeed, after two consecutive treatments in ethanol, the resultant solid CST-1-ET(2) continued to show catalytic performance similar to CST-1. For the material prepared by thermal treatment at 250 °C without the addition of the activating agent (CST-0), considerable drops in the amount of sulfur and acid sites occurred after the pre-treatments in ethanol or water. The CST-0-ET and CST-0-WT samples contained 1.6 mmol g−1 of sulfur and 0.2 mmol g−1 of acid sites, which corresponds to a 24% loss of sulfur and 66% loss of acid sites. As expected, these samples led to much lower HMF conversion and bioEs yields than the parent solid CST-0 (Table 2). Therefore, although CST-0 exhibited relatively high catalytic activity, its low stability limits its re-use and its application.
The FT-IR spectra of the CST-0-ET and CST-0-WT samples (Fig. S13, ESI†) lack the bands at 686 and 570 cm−1 that were found in the spectrum of CST-0 and assigned to non-carbonized organic precursor. Hence, the low stability of CST-0 can be attributed to the presence of a significant amount of non-carbonized carbon precursor on the material that is easily leached into the solvents under the reaction conditions used.
The CST-1 catalyst was recovered and reused in consecutive 4 h-batch runs. The conversion and bioEs yield dropped slightly from the first to the second run and afterwards remained similar. Based on the results of the reused solids, 14.1 g bioEs per gram of catalyst is obtainable after three runs. We have previously reported for powdered Amberlyst-15 tested in the same reaction (using similar conditions) that the recovered resin catalyst led to similar conversions of HMF for two runs, but with a very considerable decrease in bioEs yield from run 1 to run 2.10
Conclusions
Carbon and carbon–silica composites containing SO3H groups were synthesized by chemical activation of p-toluenesulfonic acid with H2SO4 at 250 °C. This procedure allows tuning the surface composition, texture and acid properties of the materials, leading simultaneously to solids that are stable towards leaching phenomena. By increasing the ratio (R) between the activating agent and the organic precursor, the amount and strength of the acid sites increase, and this is accompanied by the creation of mesoporosity, which enhances active sites accessibility.The chemically activated composites are effective acid catalysts for the conversion of 5-hydroxymethyl-2-furaldehyde and furfuryl alcohol to furanic ethers and levulinate esters (bioEs), and the integrated conversion of fructose to bioEs. The much higher surface areas and strong acidity associated with the carbon–silica composites are favourable for the catalytic reactions, making them top candidates in relation to the carbon material. For the composites, stronger acidity with increasing R was reflected in enhanced reaction rates and yields of the bio products.
This synthesis approach can be used to prepare functionalized carbon-based materials in controllable fashion for various applications, by using other carbon precursors, activating agents or mixtures of carbon precursors with different functionalities (to produce multifunctional materials).
Acknowledgements
We are grateful to the Fundação para a Ciência e a Tecnologia (FCT) and FEDER for general funding, and to CICECO – FCOMP-01-0124-FEDER-037271 (FCT ref. PEst-/CTM/LA0011/2013). The FCT and the European Union are acknowledged for grants to M.M.A. (SFRH/BPD/89068/2012), P.A.R. (SFRH/BPD/79910/2011) and P.N. (SFRH/BPD/73540/2010) cofunded by MCTES and the ESF through the program POPH of QREN. We acknowledge the Portuguese National NMR Network (RNRMN), supported with funds from the FCT. BP Amoco Chemical Company is acknowledged for sponsoring P.V.W.'s postdoc grant. L.M. thanks the FCT for the FCT Investigator consolidation grant IF/01401/2013.Notes and references
- G. W. Huber, S. Iborra and A. Corma, Chem. Rev., 2006, 106, 4044–4098 CrossRef CAS PubMed.
- R. Rinaldi and F. Schüth, Energy Environ. Sci., 2009, 2, 610–626 CAS.
- C.-H. Zhou, X. Xia, C.-X. Lin, D.-S. Tong and J. Beltramini, Chem. Soc. Rev., 2011, 40, 5588–5617 RSC.
- K. Nakajima and M. Hara, ACS Catal., 2012, 2, 1296–1304 CrossRef CAS.
- M. Toda, A. Takagaki, M. Okamura, J. N. Kondo, S. Hayashi, K. Domen and M. Hara, Nature, 2005, 438, 178 CrossRef CAS PubMed.
- M. Hara, T. Yoshida, A. Takagaki, J. N. Kondo, S. Hayashi and K. Domen, Angew. Chem., Int. Ed., 2004, 43, 2955–2958 CrossRef CAS PubMed.
- X. Wang, R. Liu, M. M. Waje, Z. Chen, Y. Yan, K. N. Bozhilov and P. Feng, Chem. Mater., 2007, 19, 2395–2397 CrossRef CAS.
- V. L. Budarin, J. H. Clark, R. Luque and D. J. Macquarrie, Chem. Commun., 2007, 634–636 RSC.
- J. Ji, G. Zhang, H. Chen, S. Wang, G. Zhang, F. Zhang and X. Fan, Chem. Sci., 2011, 2, 484–487 RSC.
- M. M. Antunes, P. A. Russo, P. V. Wiper, J. M. Veiga, M. Pillinger, L. Mafra, D. V. Evtuguin, N. Pinna and A. A. Valente, ChemSusChem, 2014, 7, 804–812 CrossRef CAS PubMed.
- S. Suganuma, K. Nakajima, M. Kitano, S. Hayashi and M. Hara, ChemSusChem, 2012, 5, 1841–1846 CrossRef CAS PubMed.
- W.-Y. Lou, Q. Guo, W.-J. Chen, M.-H. Zong, H. Wu and T. J. Smith, ChemSusChem, 2012, 5, 1533–1541 CrossRef CAS PubMed.
- X. Qi, H. Guo, L. Li and R. L. Smith Jr, ChemSusChem, 2012, 5, 2215–2220 CrossRef CAS PubMed.
- J. Wang, W. Xu, J. Ren, X. Liu, G. Lu and Y. Wang, Green Chem., 2011, 13, 2678–2681 RSC.
- K. Nakajima, M. Okamura, J. N. Kondo, K. Domen, T. Tatsumi, H. Hayashi and M. Hara, Chem. Mater., 2009, 21, 186–193 CrossRef CAS.
- D. Nandan, P. Sreenivasulu, S. K. Saxena and N. Viswanadham, Chem. Commun., 2011, 47, 11537–11539 RSC.
- J. A. Maciá-Agulló, M. Sevilla, M. A. Diez and A. B. Fuertes, ChemSusChem, 2010, 3, 1352–1354 CrossRef PubMed.
- R. Liu, J. Chen, X. Huang, L. Chen, L. Ma and X. Li, Green Chem., 2013, 15, 2895–2903 RSC.
- B. Hu, K. Wang, L. Wu, S.-H. Yu, M. Antonietti and M. M. Titirici, Adv. Mater., 2010, 22, 813–828 CrossRef CAS PubMed.
- W. Zhang, H. Tao, B. Zhang, J. Ren, G. Lu and Y. Wang, Carbon, 2011, 49, 1811–1820 CrossRef CAS.
- X. Liang, M. Zeng and C. Qi, Carbon, 2010, 48, 1844–1848 CrossRef CAS.
- S. Suganuma, K. Nakajima, M. Kitano, D. Yamaguchi, H. Kato, S. Hayashi and M. Hara, J. Am. Chem. Soc., 2008, 130, 12787–12793 CrossRef CAS PubMed.
- S. Van de Vyver, L. Peng, J. Geboers, H. Schepers, F. de Clippel, C. G. Gommes, B. Goderis, P. A. Jacobs and P. F. Sels, Green Chem., 2010, 12, 1560–1563 RSC.
- X. Mo, D. E. Lopez, K. Suwannakam, Y. Liu, E. Loreto, J. G. Goodwin Jr and C. Lu, J. Catal., 2008, 254, 332–338 CrossRef CAS.
- J. M. Fraile, E. García-Bordejé and L. Roldán, J. Catal., 2012, 289, 73–79 CrossRef CAS.
- B. Zhang, J. Ren, X. Liu, Y. Guo, Y. Guo, G. Lu and Y. Wang, Catal. Commun., 2010, 11, 629–632 CrossRef CAS.
- Y. Zhu, S. Murali, M. D. Stoller, K. J. Ganesh, W. Cai, P. J. Ferreira, A. Pirkle, R. M. Wallace, K. A. Cychosz, M. Thommes, D. Su, E. A. Stach and R. S. Ruoff, Science, 2011, 332, 1537–1541 CrossRef CAS PubMed.
- M. J. Illán-Gómez, A. Garcia-García, C. Salinas-Martínez de Lecea and A. Linares-Solano, Energy Fuels, 1996, 10, 1108–1114 CrossRef.
- F. L. Conceição, P. J. M. Carrott and M. M. L. R. Carrott, Carbon, 2009, 47, 1874–1877 CrossRef.
- A. J. Romero-Anaya, M. Ouzzine, M. A. Lillo-Ródenas and A. Linares-Solano, Carbon, 2014, 68, 296–307 CrossRef CAS.
- Y. Roman-Leshkov, C. J. Barrett, Z. Y. Liu and J. A. Dumesic, Nature, 2007, 447, 982–985 CrossRef CAS PubMed.
- S. N. Naik, V. V. Goud, P. K. Rout and A. K. Dalai, Renewable Sustainable Energy Rev., 2010, 14, 578–597 CrossRef CAS.
- J. J. Bozell and G. R. Petersen, Green Chem., 2010, 12, 539–554 RSC.
- A.-L. Marshall and P. J. Alaimo, Chem.–Eur. J., 2010, 16, 4970–4980 CrossRef CAS PubMed.
- O. O. James, S. Maity, L. A. Usman, K. O. Ajanaku, O. O. Ajani, T. O. Siyanbola, S. Sahu and R. Chaubey, Energy Environ. Sci., 2010, 3, 1833–1850 CAS.
- D. M. Alonso, J. Q. Bond and J. A. Dumesic, Green Chem., 2010, 12, 1493–1513 RSC.
- R. Luque, A. Pineda, J. C. Colmenares, J. M. Campelo, A. A. Romero, J. Carlos Serrano-Ruiz, L. F. Cabeza and J. Cot-Gores, J. Nat. Gas Chem., 2012, 21, 246–250 CrossRef CAS.
- J. Zhang, S. Wu, B. Li and H. Zhang, ChemCatChem, 2012, 4, 1230–1237 CrossRef CAS.
- K. S. Arias, S. I. Al-Resayes, M. J. Climent, A. Corma and S. Iborra, ChemSusChem, 2013, 6, 123–131 CrossRef CAS PubMed.
- D. J. Hayes, Catal. Today, 2009, 145, 138–151 CrossRef CAS.
- B. C. Windom, T. M. Lovestead, M. Mascal, E. B. Nikitin and T. J. Bruno, Energy Fuels, 2011, 25, 1878–1890 CrossRef CAS.
- R. L. V. Mao, Q. Zhao, G. Dim and D. Petraccone, Catal. Lett., 2011, 141, 271–276 CrossRef.
- E. Christensen, A. Williams, S. Paul, S. Burton and R. L. McCormick, Energy Fuels, 2011, 25, 5422–5428 CrossRef CAS.
- M. Mascal and E. B. Nikitin, Angew. Chem., Int. Ed., 2008, 47, 7924–7926 CrossRef CAS PubMed.
- X. Hu and C.-Z. Li, Green Chem., 2011, 13, 1676–1679 RSC.
- M. Balakrishnan, E. R. Sacia and A. T. Bell, Green Chem., 2012, 14, 1626–1634 RSC.
- H. Zhu, Q. Cao, C. Li and X. Mu, Carbohydr. Res., 2011, 346, 2016–2018 CrossRef CAS PubMed.
- A. J. Sanborn and S. J. Howard, US 2009/0156841 A1, 2009.
- C. M. Lew, N. Rajabbeigi and M. Tsapatsis, Ind. Eng. Chem. Res., 2012, 51, 5364–5366 CrossRef CAS.
- A. J. Sanborn, WO 2006/063220 A2, 2006.
- G. J. M. Gruter and L. E. Manzer, US 2010/0058650 A1, 2010.
- H. Wang, T. Deng, Y. Wang, X. Cui, Y. Qi, X. Mu, X. Hou and Y. Zhu, Green Chem., 2013, 15, 2379–2383 RSC.
- X. Hu, R. Gunawan, D. Mourant, C. Lievens, X. Li, S. Zhang, W. Chaiwat and C.-Z. Li, Fuel, 2012, 97, 512–522 CrossRef CAS.
- P. Che, F. Lu, J. Zhang, Y. Huang, X. Nie, J. Gao and J. Xu, Bioresour. Technol., 2012, 119, 433–436 CrossRef CAS PubMed.
- P. Lanzafame, D. M. Temi, S. Perathoner, G. Centi, A. Macario, A. Aloise and G. Giordano, Catal. Today, 2011, 175, 435–441 CrossRef CAS.
- G. M. G. Maldonado, R. S. Assary, J. A. Dumesic and L. A. Curtiss, Energy Environ. Sci., 2012, 5, 8990–8997 Search PubMed.
- J.-P. Lange, W. D. van de Graaf and R. J. Haan, ChemSusChem, 2009, 2, 437–441 CrossRef CAS PubMed.
- P. Neves, M. M. Antunes, P. A. Russo, J. P. Abrantes, S. Lima, A. Fernandes, M. Pillinger, S. M. Rocha, M. F. Ribeiro and A. A. Valente, Green Chem., 2013, 15, 3367–3376 RSC.
- P. Neves, S. Lima, M. Pillinger, S. M. Rocha, J. Rocha and A. A. Valente, Catal. Today, 2013, 218, 76–84 CrossRef.
- W. D. V. D. Graaf and J.-P. Lange, US 2007/7265239 B2, 2007.
- H. Nishihara, Y. Fukura, K. Inde, K. Tsuji, M. Takeuchi and T. Kyotani, Carbon, 2008, 46, 48–53 CrossRef CAS.
- R. M. Silverstein and F. X. Webster, Spectrometric Identification of Organic Compounds, John Wiley & Sons, New York, 6th edn, 1998 Search PubMed.
- L. Adams, A. Oki, T. Grady, H. McWhinney and Z. Luo, Phys. E, 2009, 41, 723–728 CrossRef CAS PubMed.
- S. Shylesh, S. Sharma, S. P. Mirajkar and A. P. Singh, J. Mol. Catal. A: Chem., 2004, 212, 219–228 CrossRef CAS.
- J. F. Moulder, W. F. Strickle, P. E. Sobol and K. D. Bomben, Handbook of X-ray Photoelectron Spectroscopy, Perkin-Elmer Corporation (Physical Electronics), Eden Prairie, Minnesota, 1992 Search PubMed.
- W. H. Lee, J. Y. Kim, Y. K. Ko, P. J. Reucroft and J. W. Zondlo, Appl. Surf. Sci., 1999, 141, 107–113 CrossRef CAS.
- A. Zheng, S.-J. Huang, S.-B. Liu and F. Deng, Phys. Chem. Chem. Phys., 2011, 13, 14889–14901 RSC.
- Q. Zhao, W.-H. Chen, S.-J. Huang, Y.-C. Hu, H.-K. Lee and S.-B. Liu, J. Phys. Chem. B, 2002, 106, 4462–4469 CrossRef CAS.
- A. Zheng, S.-J. Huang, W.-H. Chen, P.-H. Hu, H. Zhang, H.-K. Lee, L.-C. de Ménorval, F. Deng and S.-B. Liu, J. Phys. Chem. A, 2008, 112, 7349–7356 CrossRef CAS PubMed.
- J. Jae, G. A. Tompsett, A. J. Foster, K. D. Hammond, S. M. Auerbach, R. F. Lobo and G. W. Huber, J. Catal., 2011, 279, 257–268 CrossRef CAS.
- A. Ranoux, K. Djanashvili, I. W. C. E. Arends and U. Hanefeld, ACS Catal., 2013, 3, 760–763 CrossRef CAS.
- X. Hu, C. Lievens, A. Larcher and C.-Z.- Li, Bioresour. Technol., 2011, 102, 10104–10113 CrossRef CAS PubMed.
- G.-J. Gruber and E. de Jong, Biofuels Technol., 2009, 1, 11–17 Search PubMed.
- G. Wang, Z. Zhang and L. Song, Green Chem., 2014, 16, 1436–1443 RSC.
Footnotes |
| † Electronic supplementary information (ESI) available. See DOI: 10.1039/c4ta02320j |
| ‡ P. A. R and M. M. A. contributed similarly to this work. |
| This journal is © The Royal Society of Chemistry 2014 |