Lithiation mechanism of hierarchical porous MoO2 nanotubes fabricated through one-step carbothermal reduction†
Hao-Jie
Zhang
a,
Jie
Shu
b,
Kai-Xue
Wang
*a,
Xiao-Ting
Chen
a,
Yan-Mei
Jiang
a,
Xiao
Wei
a and
Jie-Sheng
Chen
*a
aSchool of Chemistry and Chemical Engineering, Shanghai Jiao Tong University, Shanghai 200240, P. R. China. E-mail: k.wang@sjtu.edu.cn; chemcj@sjtu.edu.cn; Tel: +86-21-34201273
bFaculty of Materials Science and Chemical Engineering, Ningbo University, Zhejiang, P. R. China
First published on 29th October 2013
Abstract
A one-step carbothermal reduction method has been developed for the preparation of hierarchical porous materials. In this method, CMK-3 acts both as a template casting the hierarchical porous structure and as a reducing agent for the carbothermal reaction. Hierarchical MoO2 nanotubes prepared through this method exhibit high charge/discharge capacities and rate capabilities when used as an anode material for lithium ion batteries. Cycled at current densities of 0.1 and 1.0 A g−1, the material delivers discharge capacities of 720 and 530 mA h g−1 after 70 cycles, respectively. The Li-ion insertion and extraction processes of MoO2 nanotubes have been investigated by using an in situ X-ray diffraction technique for the first time to elucidate the Li-ion storage mechanism for the MoO2 material. We demonstrate that the discharge capacity increase of MoO2 during the first 30 cycles is attributed to the lithiation transformation of MoO2.
Introduction
Hierarchical porous materials have attracted much attention owing to their important role in the systematic study of structure–property relationships and their technological promise in various applications, such as drug delivery,1 photocatalysis,2 fabrication of sensors,3 supercapacitors4 and particularly lithium ion batteries.5 The pore hierarchy can effectively facilitate the transportation of lithium ions and electrolyte molecules, shorten the solid-state diffusion distance of lithium ions, improve the electronic conductivity of the electrode material and buffer the volume change during the charge and discharge processes, and thus significantly enhance the electrochemical performance of the electrode materials of lithium ion batteries. Generally, hierarchical electrode materials, such as carbon monoliths,6 Co3O4 spheres7 and Fe2O3 flowers,8 are prepared by soft or hard templating methods. For the templating preparation of hierarchical porous materials, high-temperature calcination is generally essential to increase the crystallinity of the corresponding materials. However, the random crystal growth upon high temperature calcination would destroy the hierarchical porous structure. In addition, the removal of the templates is a time- and energy-consuming process, making the materials hard to be scaled up and consequently less competitive. Therefore, a simple method for the controlled preparation of hierarchical porous materials with a rationally designed structure is highly desired.Among various metal oxides, molybdenum dioxide is an attractive host material for lithium storage because of its rich chemistry associated with multiple valence states, low electrical resistivity, high electrochemical activity toward lithium, and affordable cost.9–11 MoO2 with a disordered rutile structure possesses metallic conductivity and high theoretical capacity (838 mA h g−1). However, bulk MoO2 usually delivers a low charge and discharge capacity at room temperature because of the sluggish kinetics.12 The incorporation of carbon into the electrode materials has proved to improve the lithium ion intercalation/extraction kinetics.13–16 Various carbon/MoO2 composite materials have been prepared through the reaction between Mo-based precursors and carbon under a reducing atmosphere.17–20 However, the amount of carbon in the composite is hard to control. Due to the high content of carbon, the lithium ion intercalation/extraction behavior of the carbon/MoO2 composite materials is usually similar to that of hard carbon materials and no distinct charge/discharge plateaus of MoO2 are observed. The introduction of a hierarchical porous structure is an efficient way to improve the performance of electrode materials because it can decrease the diffusion length of lithium ions and provide a sufficient contact surface between the electrode and electrolyte.21–24 Therefore, it is feasible to improve lithium ion intercalation/extraction kinetics of MoO2 by the introduction of a hierarchical porous structure instead of incorporation of carbon.
Herein, a one-step carbothermal reduction method is developed for the preparation of hierarchical porous materials. In this method, mesoporous carbon CMK-3 acts both as a template casting the hierarchical porous structure and as a reducing agent for the carbothermal reaction. The preparation of hierarchical porous molybdenum dioxide, MoO2, is taken as an example to demonstrate the feasibility of our method. When used as an anode material, the nanotube material not only exhibits a high reversible charge and discharge capacity but also a good rate capability and cycling performance. Moreover, the Li-ion insertion/extraction behaviour within MoO2 is well elucidated on the basis of in situ X-ray diffraction investigation.
Experimental section
Preparation of MoO2 nanotubes
A mixture of 1.0 g of MoO3 and 0.1 g of CMK-3 (prepared following the procedure described in the literature25) were ground for 20 minutes. Then the mixture was treated at 820 °C in a N2 atmosphere for 1 h. Finally, the black-colored product was collected for further characterization.General characterization
Powder X-ray diffraction (XRD) patterns were recorded with a Rigaku D/max-2200/PC X-ray diffractometer at a scanning rate of 5° min−1. The morphology and crystal lattice of the sample were elucidated on the basis of transmission electron microscopy (TEM) on a JEOL JEM-100CX microscope with an accelerating voltage of 100 kV, high-resolution TEM on a JEOL JEM-2100F microscope with an accelerating voltage of 200 kV, and field-emission scanning electron microscopy (FE-SEM) on a JEOL JSM-6700F microscope with an accelerating voltage of 5 kV. The thermogravimetric analyses (TGA) were carried out on a Perkin Elmer TGA 7 thermogravimetric analyzer at a heating rate of 20 °C min−1 in air. The Brunauer–Emmett–Teller (BET) surface area and porosity were determined by nitrogen adsorption/desorption on a Nova 2200e surface area/pore size analyzer.Electrochemical measurements
MoO2, acetylene black and the poly(vinylidene fluoride) (PVDF) binder were mixed at a weight ratio of 80![[thin space (1/6-em)]](https://www.rsc.org/images/entities/char_2009.gif) :10:10 and dispersed in a N-methylpyrrolidone (NMP) solution to form a slurry. The slurry was coated on a copper foil and dried in a vacuum oven at 110 °C overnight prior to coin-cell assembly. The cells (CR2016 type coin cells) were assembled in a glove box filled with ultra-high pure argon using a polypropylene membrane (UBE Industries Ltd.) as the separator, Li metal as the anode, and 1 M LiPF6 in ethyl carbonate–dimethyl carbonate (EC–DEC) (1:1 v/v) as the electrolyte. The charge/discharge performance of the electrode was evaluated at room temperature using a Land CT2001A battery test system. The cyclic voltammetry (CV) curves were obtained on a Chenhua CHI 600B electrochemical station.
:10:10 and dispersed in a N-methylpyrrolidone (NMP) solution to form a slurry. The slurry was coated on a copper foil and dried in a vacuum oven at 110 °C overnight prior to coin-cell assembly. The cells (CR2016 type coin cells) were assembled in a glove box filled with ultra-high pure argon using a polypropylene membrane (UBE Industries Ltd.) as the separator, Li metal as the anode, and 1 M LiPF6 in ethyl carbonate–dimethyl carbonate (EC–DEC) (1:1 v/v) as the electrolyte. The charge/discharge performance of the electrode was evaluated at room temperature using a Land CT2001A battery test system. The cyclic voltammetry (CV) curves were obtained on a Chenhua CHI 600B electrochemical station.
For in situ XRD, the MoO2 material and acetylene black were mixed at a weight ratio of 80:20 and then ground for 10 min. A specially designed device was assembled in a glove box with ultra-high pure argon using Whatman glass fiber as the separator, Li metal as the anode, and 1 M LiPF6 dissolved in a mixture of ethylene carbonate (EC) and dimethyl carbonate (DMC) (1:1, v/v) as the electrolyte.26 The powder XRD patterns were collected on a Bruker AXS D8 Focus diffractometer. The scan rate was 5° min−1.
Results and discussion
The hierarchical porous MoO2 was fabricated by using MoO3 as a molybdenum source and mesoporous carbon CMK-3 as a template and reactant via a route illustrated in Scheme 1. The morphology and the mesoporous feature of CMK-3 are revealed by low-angle XRD, SEM and TEM analyses (Fig. S1†). After being ground for 20 minutes, the mixture of MoO3 and CMK-3 was heated at 820 °C, a temperature over the melting point of MoO3 (795 °C). The molten MoO3 was dispersed onto the surface of CMK-3 followed by gradual reduction by carbon to form MoO2 nanoparticles with a higher melting point. The consumption of CMK-3 resulted in nano-sized tubules composed of the as-formed MoO2 nanoparticles. These tubules in combination with the voids among the MoO2 nanoparticles feature a hierarchical structure with a three-dimensional (3D) porous channel system.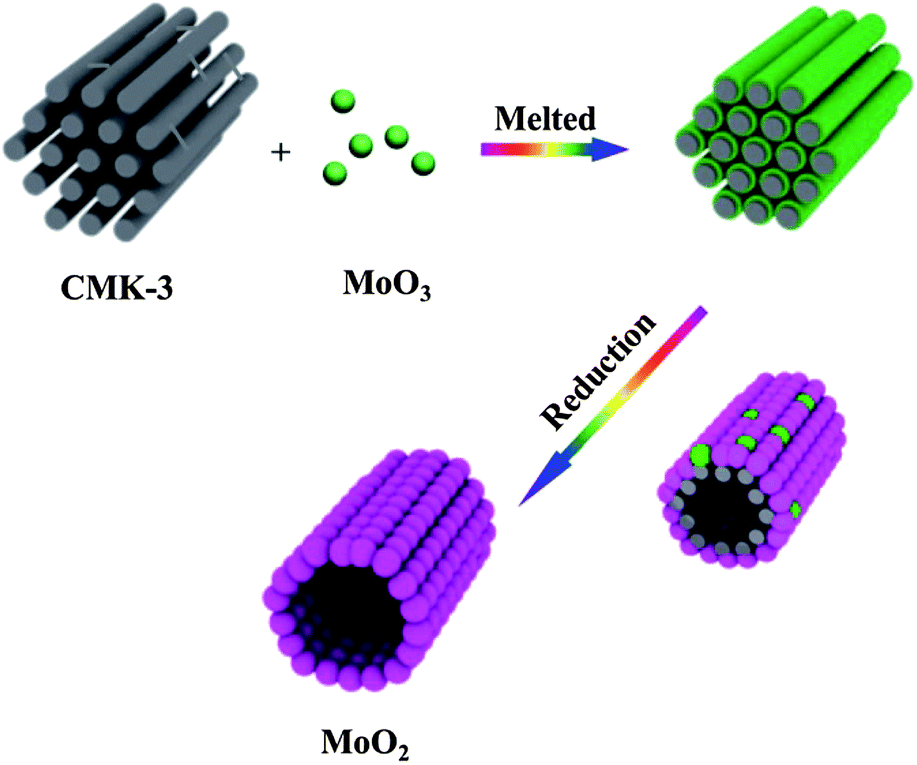 | ||
| Scheme 1 The schematic illustration of the preparation of MoO2 nanotubes. | ||
The crystallinity and purity of the product obtained by our approach are determined by XRD (Fig. 1a). The diffractions can be readily indexed to monoclinic MoO2 with a space group of P21/c, in good agreement with that of molybdenum dioxide with the JCPDS no. 65-5758. The well resolved diffraction peaks located at 26.0°, 37.2° and 53.6° are ascribed to the (011), (200), and (220) reflection planes of MoO2. The narrow peaks indicate the high crystallinity of the monoclinic MoO2 material we obtained. No diffractions corresponding to MoO3 are observed, indicating that all of the MoO3 crystals are converted into MoO2.
 | ||
| Fig. 1 (a) XRD pattern and (b) TGA curve of the obtained MoO2. | ||
TGA was used to determine the content of residual carbon in the sample (Fig. 1b). During the TGA measurement, the weight change is due to both the oxidation of MoO2 and the removal of carbon. MoO2 is stable in air at temperatures below 200 °C and the TGA curve is flat from room temperature to 200 °C. At higher temperatures, the weight of the sample gradually increases since MoO2 is oxidized to MoO3 (eqn (1)). The inflection point at about 350 °C is caused by the removal of carbon through combustion (eqn (2)). Theoretically, the weight gain for the conversion of MoO2 to MoO3 is about 12.5%. However, from the TGA analysis, it is known that the weight of the sample increases by 11.0% from room temperature to 550 °C in air. On the basis of the TGA result in combination with the theoretical weight gain value, the content of carbon in the MoO2 material we prepared is calculated to be less than 2.2 wt%.
| MoO2 + 0.5O2 = MoO3 | (1) |
| C + O2 = CO2 | (2) |
FE-SEM and TEM were used to gain further insight into the morphological and textural details of the MoO2 sample. The morphology of the MoO2 sample closely mimics that of CMK-3 (Fig. 2a and S1c†), indicating the templating effect of CMK-3 for the formation of the tubular morphology. The MoO2 nanoparticles with a relatively smooth surface are approximately 50–100 nm in diameter (Fig. 2b). The aggregation of such nanoparticles leads to the formation of mesopores with a dimension of less than 20 nm in diameter and tubular structures with a diameter of about 500 nm. The combination of the mesopores with the nanotube generates a hierarchical structure with a 3D porous network, which can facilitate the penetration of the electrolyte in the as-prepared sample. The tubular structure resulting from the consumption of the CMK-3 template is also revealed by the TEM image (Fig. 2c). The inner diameter of the nanotube is less than 100 nm, in agreement with the SEM observation shown in Fig. S3a.† The HRTEM image of the sample is shown in Fig. 2d. The lattice fringe of approximately 3.4 Å is ascribed to the (011) plane of MoO2, consistent with the XRD analysis. It is also observed in the SEM and HRTEM images that the edges of the nanoparticles fuse together, benefiting the maintenance of the hierarchical porous structure and the decrease of the grain boundary resistance. A thin layer of amorphous carbon is observed coated on most of the MoO2 nanoparticles (Fig. S3b†), increasing the electronic conductivity of the nanotubes.
 | ||
| Fig. 2 (a and b) SEM, (c) TEM and (d) HRTEM images of the hierarchical porous MoO2 material. | ||
The nitrogen adsorption/desorption analysis suggests that a hierarchical porous structure composed of mesopores and macropores exists in the as-obtained samples. The adsorption and desorption isotherms and the corresponding pore size distribution curve of the MoO2 are shown in Fig. 3. The isotherms at a relative pressure of 0.45–0.6 can be classified as type IV, typical for mesoporous materials. The adsorption and desorption behaviour at a higher relative pressure is ascribed to the macropores among the MoO2 nanoparticles and the tubular channels. The hierarchical porous structure is also demonstrated by the pore size distribution analysis. The specific BET surface area and the pore volume are determined to be 40.2 m2 g−1 and 0.267 cm3 g−1, respectively.
 | ||
| Fig. 3 Nitrogen adsorption/desorption isotherm and the corresponding pore size distribution curve (inset) of the hierarchical porous MoO2. | ||
The cyclic voltammetry curve of the hierarchical porous MoO2 at a scan rate of 0.5 mV s−1 between 0.01 and 3.0 V is shown in Fig. 4a. Two obvious reduction/oxidation peak pairs (1.30/1.60 V and 1.56/1.86 V) are observed. These peaks are attributed to the phase transformation between the monoclinic and orthorhombic phases in the partially lithiated LixMoO2.27 The narrow separation between the redox peaks (ΔE) implies a small polarization for the electrode. As indicated by these two reduction/oxidation pairs, the transformation between the monoclinic and orthorhombic phases is highly reversible in the subsequent cycles, demonstrating the advantage of the hierarchical porous MoO2 nanotubes. It is also noted that in the cathodic scan of the first cycle, an irreversible reduction peak at ∼0.5 V appears, and this peak is attributed to the irreversible reduction of the electrolyte and the formation of passivating surface films.28
 | ||
| Fig. 4 (a) Cyclic voltammogram of the hierarchical porous MoO2 at a scan rate of 0.5 mV s-1 over a voltage range of 0.01–3.0 V. (b) Galvanostatic charge/discharge curves of the hierarchical porous MoO2 at a current density of 0.5 A g−1 between 0.01 and 3.0 V. (c) Cycling performances of the hierarchical porous MoO2 at different current densities between 0.01 and 3.0 V. (d) Coulombic efficiency of the hierarchical porous MoO2 at a current density of 100 mA g−1 over a voltage range of 0.01–3.0 V. | ||
The representative charge/discharge curves of the hierarchical porous MoO2 at a current density of 0.5 A g−1 over a voltage range of 0.01–3.0 V are shown in Fig. 4b. The initial discharge and charge capacities of the MoO2 sample are approximately 550 and 400 mA h g−1, respectively, giving a coulombic efficiency of 73.0%. The capacity loss of the initial cycle is attributed to the irreversible processes, such as the trapping of some lithium in the lattice of MoO2, the formation of a solid electrolyte interface (SEI), and the decomposition of the electrolyte molecules. In the first cycle, two distinct discharge plateaus (1.5 V and 1.3 V) and two charge plateaus (1.4 V and 1.7 V) can be observed. This observation is attributed to the phase transformations in the partially lithiated LixMoO2. These plateaus are maintained even after 20 cycles, indicating the good stability of the hierarchical porous structure.
The cycling performances of the hierarchical porous MoO2 material at different current densities are shown in Fig. 4c. It is seen that the hierarchical porous MoO2 prepared by the carbothermal reduction method exhibits a good cycling performance. A discharge capacity of as high as 720 mA h g−1 (3.4 mol Li) is achieved when cycled at 0.1 A g−1 even for 70 cycles. This discharge capacity is distinctly higher than those for the MoO2 materials reported in the literature (Table 1).11,18,20,29–31 Generally, due to the huge volume change upon cycling, MoO2 materials suffer from a dramatic capacity fading after the activation process. There are only a few reports in the literature describing the cycling performance of MoO2 over 20 cycles. The superior cycling performance of the MoO2 material prepared in this work is ascribed to its unique hierarchical porous structure and residual carbon coating. Compared with conventional MoO2 materials, the hierarchical porous structure generated by the carbothermal reduction method and the carbon coating effectively buffer the volume change of the electrode material, leading to stabilization of the microstructure and thus the cycling performance of the material.
This hierarchical MoO2 material shows a super rate capability. When cycled at 0.5 and 1.0 A g−1 for 70 cycles, the discharge capacities are 590 and 530 mA h g−1, respectively. In contrast, discharge capacities of 450 and 350 mA h g−1 are retained after being cycled at current densities of 0.5 and 1.0 A g−1, respectively, for only 20 cycles for the MoO2 nanomaterials reported in the literature.29,31 The rate capability of the hierarchical porous MoO2 is attributed to the fine contact of MoO2 nanoparticles and the small amount of carbon residue, decreasing the resistance of the electrode and benefiting the transport of electrons. Furthermore, the hierarchical porous MoO2 nanotubes exhibit a good coulombic efficiency (Fig. 4d). When cycled at 0.1 A g−1, the coulombic efficiency of the first cycle is 80.0%. The capacity loss of 20.0% is attributed to the irreversible change during the lithiation and delithiation of MoO2. The coulombic efficiency increases to 93.1% during the second cycle and remains to be over 99.5% in the following cycles. The good coulombic efficiency of the obtained MoO2 material is also attributed to the high reversibility of the lithiation/delithiation processes benefiting from the hierarchical structure.
The high electrochemical performance of our material is ascribed to the unique structural feature of the MoO2 nanotubes (Fig. 5). The size of MoO2 nanoparticles within the nanotubes is around 50 nm, significantly reducing the diffusion length of lithium ions. The hierarchical porous structure generated by the 1D nanotubes and the void spaces among the nanoparticles within the walls of the nanotubes of the MoO2 material provide a 3D transportation pathway for the electrolyte and lithium ions, improving the rate capability of the material. It is also envisaged that the large volume variation during the cycling can be well accommodated by the hierarchical porous structure, ensuring the high cycling stability. In addition, the fine contact among MoO2 nanoparticles as revealed by the HRTEM observation reduces the resistance of the interparticle boundary interfaces, benefiting the rate performance.
 | ||
| Fig. 5 The schematic representation for transport of lithium ions and electrons in hierarchical porous MoO2. | ||
The elucidation of the Li-ion intercalation/extraction mechanism is highly desired for the design and exploration of novel electrode materials for lithium ion batteries. Prior to our work, the Li-ion storage mechanism for MoO2 was not well understood. It is noted that a capacity increase appears within the first 30 cycles for the hierarchical porous MoO2 material (Fig. 4c). Actually, the gradual increase in the specific capacities during the initial charge and discharge cycles is a general phenomenon for nanostructured MoO2 materials.32 The capacity increase upon cycling is usually simply ascribed to the activation of the MoO2 electrode without further explanation and experimental support. It is expected that the investigation in phase transformation during the charge/discharge processes will shed light on the Li-ion intercalation/extraction mechanism for MoO2 materials. The phase transformation of MoO2 species upon charging and discharging at a current density of 40 mA g−1 in the voltage range of 0.01 and 3.0 V is investigated by an in situ XRD method (Fig. 6). During the initial discharge process, a gradual shift of the (011) peak of MoO2 toward low angles is observed upon the insertion of lithium ions in the voltage range of 1.4 and 3.0 V (Fig. 6a). The peak shift indicates that a volume expansion occurs upon the insertion of lithium ions into the crystal structure of MoO2. A corresponding plateau with a specific capacity of approximately 110 mA h g−1 is observed in the initial discharge profile, suggesting the formation of an intermediate phase Li0.49MoO2 with the gradual lithium ion insertion.
 | ||
| Fig. 6 In situ XRD patterns of the electrode during the charge and discharge processes at a current density of 40 mA g−1 over a voltage range of 0.01 and 3.0 V. | ||
Upon discharging from the voltage of 1.4 to 1.0 V, new peaks at approximately 24.5°, 35.0° and 35.5° emerge, and these peaks are ascribed to the (011), (020), and (002) diffractions of Li0.98MoO2, respectively. The peaks gradually shift to 24.1°, 34.2° and 35.0°, respectively with the insertion of lithium ions. The disappearance of the diffractions of the intermediate phase Li0.49MoO2 and the emergence and shift of the diffractions corresponding to Li0.98MoO2 suggest that the intermediate phase Li0.49MoO2 gradually transforms into Li0.98MoO2 upon further insertion of another 0.49 mol of lithium ions. The discharge capacity below 1.0 V is attributed to the formation of a SEI layer and the further lithiation of partial Li0.98MoO2. However, no obvious peak shift in the XRD patterns can be observed. When the cell is discharged to 0.01 V, the strong diffraction peaks corresponding to Li0.98MoO2 remain, suggesting that Li0.98MoO2 predominates in the lithiated products. The inspection of the XRD pattern for the electrode discharged at 0.01 V reveals a peak located at 41.3°, ascribed to the presence of Mo. This result indicates that a small amount of Li0.98MoO2 converts into Mo at low potential (Fig. S4†).
The corresponding in situ XRD patterns during the charge process are shown in Fig. 6b. No obvious shift of the diffraction peaks can be observed below 1.3 V, in good agreement with the observation during the discharge process. When the cell is charged to a voltage over 1.3 V, new peaks located at 24.5° and 35.5° can be clearly observed. These peaks are attributed to the regeneration of Li0.49MoO2 upon the gradual extraction of lithium ions from the lattice of Li0.98MoO2. After charging to a voltage of approximately 1.6 V, all of the Li0.98MoO2 particles are converted into Li0.49MoO2 with the extraction of 0.49 mol of lithium ions, giving a plateau capacity of approximately 110 mA h g−1. Charged to voltages higher than 1.6 V, the diffraction peaks of Li0.49MoO2 gradually disappear and a new peak located at about 25.5° shows up. This peak is attributed to the (011) diffractions of monoclinic MoO2. The formation of monoclinic MoO2 is the result of further extraction of 0.49 mol lithium ions from the lattice of Li0.49MoO2. When the cell is charged to 3.0 V, diffractions attributed to monoclinic MoO2 are detected, suggesting that both Li0.98MoO2 and Mo are transformed into MoO2. On the basis of the in situ XRD analyses of the electrode material upon charging and discharging, it can be concluded that the conversion between MoO2 and Li0.98MoO2 is highly reversible in the initial cycles. However, changes in the XRD diffractions of MoO2 are observed after two cycles (Fig. 7). The diffractions at approximately 36.6° and 37.2° gradually disappear with cycling. The diffractions of the electrode after two cycles can be well indexed to a monoclinic MoO2 with a space group of P21/n (JCPDS no. 32-671). During the charge and discharge processes of the initial 30 cycles, most of Li0.98MoO2 can reversibly convert into MoO2 with a space group of P21/c (JCPDS no.65-5787). However, a part of the Li0.98MoO2 material is further reduced to Li2O and Mo upon lithium ion insertion (Fig. S5†). Due to the high electrochemical activity of Li2O, Mo reversibly converts into a monoclinic MoO2 with a space group of P21/n (32-671). With cycling, the two discharge plateaus located at 1.5 V and 1.3 V and the two charge plateaus at 1.4 V and 1.7 V for Li0.98MoO2 disappear (Fig. S6†). It is proposed that only a reversible conversion occurs between MoO2 (32-671), Li2O and Mo upon cycling after 30 cycles. The lithiation mechanism of MoO2 switches from an initial insertion mechanism to a conversion mechanism, generally observed in metal oxide materials.33–35 The conversion reaction is described as follows (eqn (3)):
| TMxOy + 2ye− + 2yLi+ ⇆ x[TM]0 + yLi2O | (3) |
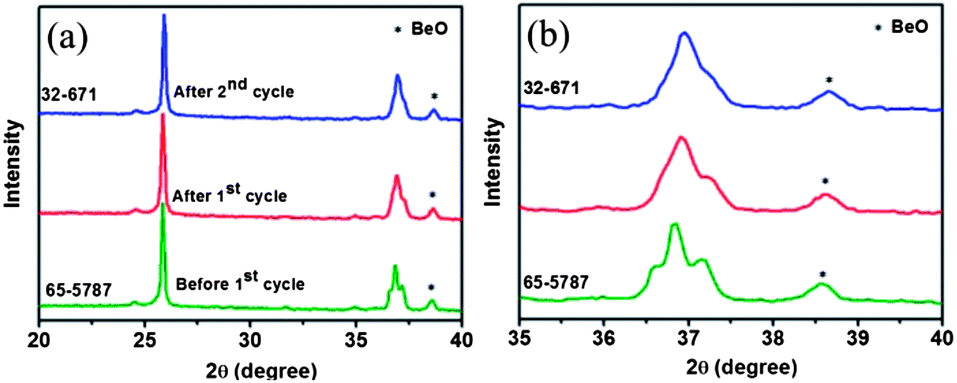 | ||
| Fig. 7 In situ XRD patterns of the electrode charged to 3.0 V during different cycles. The peak located at 38.6° belongs to BeO due to the oxidation of the Be window of the cell. | ||
The final product after discharge consists of a homogeneous distribution of metal nanoparticles ([TM]0, where the superscript 0 indicates the metallic form) embedded in the Li2O matrix.36 Compared with the insertion mechanism, more Li can react with the metal oxide during the discharge process. As a result, the charge and discharge of the electrode gradually increases during the first 30 cycles.
The atomic structures of the electrode (same crystal lattice) are illustrated in Fig. 8. MoO2 (65-5787) is a monoclinic MoO2 with a space group of P21/c, (a = 5.6109 Å, b = 4.8562 Å, c = 5.6285 Å, and β = 120.95°). The MoO6 octahedra in MoO2 (65-5787) are mainly distributed on the (100) plane. Channels observed along the a-axis provide diffusion paths for lithium ions and Li0.98MoO2 (87-392, monoclinic with a space group of P21/c, a = 5.5696 Å, b = 5.2114 Å, c = 5.8511 Å, and β = 118.798°) is formed upon lithium ion insertion. The insertion of the lithium ions leads to the shift of (011) peaks. This phase change is highly reversible and most of Li0.98MoO2 converts into MoO2 (65-5787) after charging to 3.0 V. However, a part of the Li0.98MoO2 is converted into MoO2 (32-671, a monoclinic MoO2 with a space group of P21/n, a = 5.6068 Å, b = 4.8595 Å, c = 5.5373 Å, and β = 119.37°). Compared with the MoO2 (65-5787), the MoO6 octahedra in the MoO2 (32-671) are mainly distributed on the (011) plane. As observed in the HRTEM image, the MoO2 crystals grow along the [011] direction. For a given volume, the length of channels for MoO2 (32-671) along the a-axis is shortened with more channels present, decreasing the diffusion distance and increasing the diffusion pathway for lithium ions. With change of the lithiation mechanism of MoO2 from insertion to conversion, the charge/discharge capacity of the electrode gradually increases.
 | ||
| Fig. 8 The schematic representation of atomic structures of the electrode material during the activation process. | ||
Conclusions
A simple one-step carbothermal reduction method has been developed for the preparation of hierarchical porous materials. By employing CMK-3 as both a template and reducing agent, hierarchical porous nanotubes composed of MoO2 nanoparticles have been successfully fabricated. Taking advantage of the hierarchical structure which is beneficial for lithium ion and electrolyte transportation, the MoO2 nanotubes exhibit high specific capacities, good cycling stability and excellent rate capability. A discharge capacity as high as 720 mA h g−1 (3.4 mol Li) is achieved when cycled at 0.1 A g−1 for 70 cycles. When cycled at 0.5 and 1.0 A g−1 for 70 cycles, the capacities are 590 and 530 mA h g−1, respectively, distinctly superior over those of the MoO2 nanomaterials reported in the literature. It is envisaged that other nanostructured carbon materials can be used for this carbothermal reduction and a variety of hierarchical porous materials can be generated on a large scale by this strategy. The Li-ion insertion and extraction processes of MoO2 are first elucidated on the basis of in situ X-ray diffraction investigation. We demonstrate that the increase in the discharge of MoO2 during the first 30 cycles is attributed to the change in the lithiation mechanism of MoO2.Acknowledgements
This work was financially supported by the National Basic Research Program of China (2013CB934102 and 2011CB808703) and the National Natural Science Foundation of China.Notes and references
- J. Liu, S. Z. Qiao, S. Budi Hartono and G. Q. Lu, Angew. Chem., Int. Ed., 2010, 49, 4981–4985 CrossRef CAS PubMed.
- R. Yuan, X. Fu, X. Wang, P. Liu, L. Wu, Y. Xu, X. Wang and Z. Wang, Chem. Mater., 2006, 18, 4700–4705 CrossRef CAS.
- H. Zhang, Q. Zhu, Y. Zhang, Y. Wang, L. Zhao and B. Yu, Adv. Funct. Mater., 2007, 17, 2766–2771 CrossRef CAS.
- C. Yuan, X. Zhang, L. Su, B. Gao and L. Shen, J. Mater. Chem., 2009, 19, 5772–5777 RSC.
- X. M. Yin, C. C. Li, M. Zhang, Q. Y. Hao, S. Liu, L. B. Chen and T. H. Wang, J. Phys. Chem. C, 2010, 114, 8084–8088 CAS.
- Y. S. Hu, P. Adelhelm, B. M. Smarsly, S. Hore, M. Antonietti and J. Maier, Adv. Funct. Mater., 2007, 17, 1873–1878 CrossRef CAS.
- B. Guo, C. Li and Z. Y. Yuan, J. Phys. Chem. C, 2010, 114, 12805–12817 CAS.
- W. Zhou, L. Lin, W. Wang, L. Zhang, Q. Wu, J. Li and L. Guo, J. Phys. Chem. C, 2011, 115, 7126–7133 CAS.
- S. H. Lee, Y. H. Kim, R. Deshpande, P. A. Parilla, E. Whitney, D. T. Gillaspie, K. M. Jones, A. H. Mahan, S. Zhang and A. C. Dillon, Adv. Mater., 2008, 20, 3627–3632 CrossRef CAS.
- L. Q. Mai, B. Hu, W. Chen, Y. Y. Qi, C. S. Lao, R. S. Yang, Y. Dai and Z. L. Wang, Adv. Mater., 2007, 19, 3712–3716 CrossRef CAS.
- L. Zhou, H. B. Wu, Z. Wang and X. W. Lou, ACS Appl. Mater. Interfaces, 2011, 3, 4853–4857 CAS.
- J. H. Ku, Y. S. Jung, K. T. Lee, C. H. Kim and S. M. Oh, J. Electrochem. Soc., 2009, 156, A688–A693 CrossRef CAS.
- J. Hassoun, G. Derrien, S. Panero and B. Scrosati, Adv. Mater., 2008, 20, 3169–3175 CrossRef CAS.
- L. F. Cui, Y. Yang, C. M. Hsu and Y. Cui, Nano Lett., 2009, 9, 3370–3374 CrossRef CAS PubMed.
- H. Wang, Y. Yang, Y. Liang, J. T. Robinson, Y. Li, A. Jackson, Y. Cui and H. Dai, Nano Lett., 2011, 11, 2644–2647 CrossRef CAS PubMed.
- E. Kang, Y. S. Jung, G. H. Kim, J. Chun, U. Wiesner, A. C. Dillon, J. K. Kim and J. Lee, Adv. Funct. Mater., 2011, 21, 4349–4357 CrossRef CAS.
- Y. Sun, X. Hu, W. Luo and Y. Huang, ACS Nano, 2011, 5, 7100–7107 CrossRef CAS PubMed.
- Y. Sun, X. Hu, J. C. Yu, Q. Li, W. Luo, L. Yuan, W. Zhang and Y. Huang, Energy Environ. Sci., 2011, 4, 2870–2877 CAS.
- Z. Wang, J. S. Chen, T. Zhu, S. Madhavi and X. W. Lou, Chem. Commun., 2010, 46, 6906–6908 RSC.
- Y. Sun, X. Hu, W. Luo and Y. Huang, J. Mater. Chem., 2012, 22, 425–431 RSC.
- A. S. Arico, P. Bruce, B. Scrosati, J. M. Tarascon and W. van Schalkwijk, Nat. Mater., 2005, 4, 366–377 CrossRef CAS PubMed.
- A. Magasinski, P. Dixon, B. Hertzberg, A. Kvit, J. Ayala and G. Yushin, Nat. Mater., 2010, 9, 353–358 CrossRef CAS PubMed.
- J. S. Chen, Y. L. Tan, C. M. Li, Y. L. Cheah, D. Luan, S. Madhavi, F. Y. C. Boey, L. A. Archer and X. W. Lou, J. Am. Chem. Soc., 2010, 132, 6124–6130 CrossRef CAS PubMed.
- C. Sun, S. Rajasekhara, J. B. Goodenough and F. Zhou, J. Am. Chem. Soc., 2011, 133, 2132–2135 CrossRef CAS PubMed.
- X. Ji, K. T. Lee and L. F. Nazar, Nat. Mater., 2009, 8, 500–506 CrossRef CAS PubMed.
- J. Shu, M. Shui, D. Xu, Y. Ren, D. Wang, Q. Wang, R. Ma, W. Zheng, S. Gao, L. Hou, J. Xu, J. Cui, Z. Zhu and M. Li, J. Mater. Chem., 2012, 22, 3035–3043 RSC.
- J. R. Dahn and W. R. McKinnon, Solid State Ionics, 1987, 23, 1–7 CrossRef CAS.
- X. Zhao, M. Cao, B. Liu, Y. Tian and C. Hu, J. Mater. Chem., 2012, 22, 13334–13340 RSC.
- Q. Gao, L. Yang, X. Lu, J. Mao, Y. Zhang, Y. Wu and Y. Tang, J. Mater. Chem., 2010, 20, 2807–2812 RSC.
- W. Luo, X. Hu, Y. Sun and Y. Huang, Phys. Chem. Chem. Phys., 2011, 13, 16735–16740 RSC.
- X. Ji, P. S. Herle, Y. Rho and L. F. Nazar, Chem. Mater., 2007, 19, 374–383 CrossRef CAS.
- B. Guo, X. Fang, B. Li, Y. Shi, C. Ouyang, Y. S. Hu, Z. Wang, G. D. Stucky and L. Chen, Chem. Mater., 2011, 24, 457–463 CrossRef.
- P. Poizot, S. Laruelle, S. Grugeon, L. Dupont and J. M. Tarascon, Nature, 2000, 407, 496–499 CrossRef CAS PubMed.
- P. G. Bruce, B. Scrosati and J. M. Tarascon, Angew. Chem., Int. Ed., 2008, 47, 2930–2946 CrossRef CAS PubMed.
- A. L. M. RedCdy, M. M. Shaijumon, S. R. Gowda and P. M. Ajayan, Nano Lett., 2009, 9, 1002–1006 CrossRef PubMed.
- M. Armand and J. M. Tarascon, Nature, 2008, 451, 652–657 CrossRef CAS PubMed.
Footnote |
| † Electronic supplementary information (ESI) available: Characterization of CMK-3, SEM image of an open MoO2 nanotube, more in situ and ex situ XRD patterns of the MoO2 and galvanostatic charge/discharge curves of MoO2 after 30 cycles. See DOI: 10.1039/c3ta14123c |
| This journal is © The Royal Society of Chemistry 2014 |