Phase behavior and superprotonic conductivity in the Cs1−xRbxH2PO4 and Cs1−xKxH2PO4 systems
Ayako
Ikeda
a,
Daniil A.
Kitchaev
b and
Sossina M.
Haile
*ab
aMaterials Science, California Institute of Technology, 1200 E. California Blvd, Pasadena, CA 91125, USA. E-mail: smhaile@caltech.edu
bChemical Engineering, California Institute of Technology, 1200 E. California Blvd, Pasadena, CA 91125, USA
First published on 8th November 2013
Abstract
The solid acid compound CsH2PO4 (CDP) adopts a cubic structure of high conductivity above 228 °C, rendering it attractive as a fuel cell electrolyte for intermediate temperature operation. This superprotonic phase is stable from the phase transition temperature, Ts, to the dehydration temperature, Td, where the latter depends on water vapor pressure (e.g. Td = 290 °C at pH2O = 0.8 atm). In this work we examine the possibility of modifying these temperatures and thereby, amongst other characteristics, fuel cell operating conditions by introduction of Rb and K as substituents for Cs in CDP. The phase behavior of the Cs1−xRbxH2PO4 and Cs1−xKxH2PO4 pseudo-binary systems are determined by in situ X-ray diffraction (XRD) and thermal analysis. It is found that RbH2PO4 (RDP) and CDP are entirely miscible both below and above the transition to the cubic phase. With increasing Rb concentration, Ts increases and Td decreases. In contrast, K has limited solubility in CDP, with a 27 at.% solubility limit in the cubic phase, and both Ts and Td decrease with K content. The eutectoid temperature in the Cs1−xKxH2PO4 system is 208 ± 2 °C and the K solubility decreases sharply below this temperature. In both systems, conductivity decreases monotonically with increasing substituent concentration. Furthermore, even after normalization for cation size, the impact of K is greater than that of Rb, suggesting local disruptions to the proton migration pathway, beyond global changes in unit cell volume. Although this investigation shows unmodified CDP to remain the optimal fuel cell electrolyte material, the study provides a possible framework for elucidating proton transport mechanisms in superprotonic conductors.
1. Introduction
At moderate temperatures and under sufficient humidity, CsH2PO4 adopts the CsCl structure type with orientationally disordered oxyanion groups and has high protonic conductivity (∼10−2 S cm−1). As such, it is attractive as a fuel cell electrolyte for operation in the intermediate temperature range of 230 to 280 °C.1–3 In an earlier publication we reported the thermodynamic phase stability of cubic CsH2PO4 and the kinetic characteristics of its dehydration.4 The lower temperature limit for operation of CsH2PO4-based fuel cells corresponds to the phase transition temperature, Ts = 228 °C, from the monoclinic to the cubic phase. This polymorphic phase transition is independent of pH2O. The upper temperature limit corresponds to the dehydration temperature, Td, which, in contrast to Ts, depends strongly on pH2O. For example, at pH2O = 0.8 atm Td is 290 °C, whereas at pH2O = 0.15 atm it is 230 °C. The relatively narrow stability window for cubic CsH2PO4 presents challenges for fuel cell operation. While these are not insurmountable, increasing Td and lowering Ts are technologically desirable.3 In this work we evaluate phase behavior in the Cs1−xRbxH2PO4 and Cs1−xKxH2PO4 pseudo-binary systems and explore the possibility of manipulating the stability window of the cubic phase through chemical modification. Beyond near-term implications for fuel cell operation, such a study has the potential to provide broad insight into the crystal-chemical factors governing superprotonic behavior.At ambient conditions, CsH2PO4 and RbH2PO4 have distinct structures (the former monoclinic, P21/m,5 the latter tetragonal, I![[4 with combining macron]](https://www.rsc.org/images/entities/char_0034_0304.gif) 2d6), precluding the possibility of complete solid solubility. It has been shown, however, that Rb is highly soluble in monoclinic CsH2PO4, with a solubility limit in the vicinity of 80 at.% at ambient temperatures.7–9 In addition, it has recently been shown that, upon heating, RbH2PO4 transforms to a monoclinic phase isostructural to that of CsH2PO4, with the transition occurring gradually over the temperature range from 90 to 130 °C.10 In the case of the intermediate compositions, a sharp increase in conductivity on heating to somewhat higher temperatures,7–9,11 as well as observation of a thermal anomaly of appropriate magnitude,8,12 has suggested that Cs1−xRbxH2PO4 can adopt the cubic CsCl-type structure of superprotonic CsH2PO4. Direct high-temperature diffraction studies are limited to the work of Martsinkevich,13 who was able to show that for compositions up to 40 at.% Rb the high-temperature phase is indeed cubic. In parallel with these ambient pressure experiments, Botez examined RbH2PO4 under high pressure and reported the occurrence of monoclinic and cubic phases of RbH2PO4, isostructural with those of CsH2PO4.14 This collection of prior results suggests the possibility of complete miscibility between CsH2PO4 and RbH2PO4 at temperatures in the vicinity of Ts, below it in the form of the monoclinic phase and above in the form of the cubic phase. Studies of the impact of Rb substitution on the temperature of the transition between these two phases generally indicate an increase in Ts with increasing Rb,7–9,12,15 although Lavrova et al. have reported a 20 °C reduction in Ts when the Rb content is 3 at.%.11 Little has been documented with respect to the influence of Rb on dehydration behavior. We reported previously that Cs0.75Rb0.25H2PO4 has a slightly lower Td than CsH2PO4.12 Again, Lavrova et al. have reported opposite behavior, claiming enhanced stability for Cs0.97Rb0.03H2PO4 over CsH2PO4.11 These discrepancies signify a clear need to resolve the phase behavior of the Cs1−xRbxH2PO4 system and quantify the influence of Rb content on Ts and Td.
2d6), precluding the possibility of complete solid solubility. It has been shown, however, that Rb is highly soluble in monoclinic CsH2PO4, with a solubility limit in the vicinity of 80 at.% at ambient temperatures.7–9 In addition, it has recently been shown that, upon heating, RbH2PO4 transforms to a monoclinic phase isostructural to that of CsH2PO4, with the transition occurring gradually over the temperature range from 90 to 130 °C.10 In the case of the intermediate compositions, a sharp increase in conductivity on heating to somewhat higher temperatures,7–9,11 as well as observation of a thermal anomaly of appropriate magnitude,8,12 has suggested that Cs1−xRbxH2PO4 can adopt the cubic CsCl-type structure of superprotonic CsH2PO4. Direct high-temperature diffraction studies are limited to the work of Martsinkevich,13 who was able to show that for compositions up to 40 at.% Rb the high-temperature phase is indeed cubic. In parallel with these ambient pressure experiments, Botez examined RbH2PO4 under high pressure and reported the occurrence of monoclinic and cubic phases of RbH2PO4, isostructural with those of CsH2PO4.14 This collection of prior results suggests the possibility of complete miscibility between CsH2PO4 and RbH2PO4 at temperatures in the vicinity of Ts, below it in the form of the monoclinic phase and above in the form of the cubic phase. Studies of the impact of Rb substitution on the temperature of the transition between these two phases generally indicate an increase in Ts with increasing Rb,7–9,12,15 although Lavrova et al. have reported a 20 °C reduction in Ts when the Rb content is 3 at.%.11 Little has been documented with respect to the influence of Rb on dehydration behavior. We reported previously that Cs0.75Rb0.25H2PO4 has a slightly lower Td than CsH2PO4.12 Again, Lavrova et al. have reported opposite behavior, claiming enhanced stability for Cs0.97Rb0.03H2PO4 over CsH2PO4.11 These discrepancies signify a clear need to resolve the phase behavior of the Cs1−xRbxH2PO4 system and quantify the influence of Rb content on Ts and Td.
In contrast to the case with Rb, there are no known studies of the Cs1−xKxH2PO4 system. At ambient temperatures, KH2PO4 is tetragonal16 and isostructural to the ambient temperature form of RbH2PO4. Recent high-temperature synchrotron X-ray studies17 have revealed a transition at ∼190 °C to a monoclinic phase (P21/m), isostructural to that of RbH2PO4 (above 130 °C) and CsH2PO4 (ambient temperature). However, further heating apparently results in melting or dehydration prior to any transition to a superprotonic phase, even under high pressure.18 Because K is only slightly smaller than Rb and the phosphates share two isomorphous structures, non-negligible solubility of K into CsH2PO4 can be anticipated, suggesting another chemical means of manipulating Ts and Td in CsH2PO4-based materials.
To meet the objective of elucidating phase behavior we perform, in this work a careful examination of the Cs1−xRbxH2PO4 and Cs1−xKxH2PO4 pseudo-binary systems using in situ X-ray powder diffraction (XRD), differential scanning calorimetry (DSC) and alternating current (AC) impedance spectroscopy. Key to the success of this study is the active control of humidity in order to clearly distinguish between polymorphic phase transitions and dehydration reactions,19 as well as acquisition of data over long periods to ensure system equilibration. This approach enables reliable determination of (i) solubility limits, (ii) Ts, and (iii) Td, all of which are embodied in the phase diagrams constructed from these measurements.
2. Experimental details
2.1. Sample preparation
Polycrystalline powders of CsH2PO4 and RbH2PO4 were synthesized by combining the starting reagents Cs2CO3 (Alfa Aesar, 99.99%) or Rb2CO3 (Alfa Aesar, 99.99%) and H3PO4 (ACS, 85% w/w aqueous solution) in a molar ratio of 1![[thin space (1/6-em)]](https://www.rsc.org/images/entities/char_2009.gif) :
:![[thin space (1/6-em)]](https://www.rsc.org/images/entities/char_2009.gif) 2 in aqueous solution. The resulting solutions were gently heated and the end-member solid acid phosphates obtained upon evaporation of water. Samples of overall composition Cs1−xRbxH2PO4 and Cs1−xKxH2PO4 were synthesized from these starting materials. Stoichiometric aqueous solutions of target overall composition were prepared and again solid precipitates obtained upon inducing water evaporation. For further experimentation the resulting materials were ground in a mortar and pestle to yield to powders with particle size of ∼10 μm.
2 in aqueous solution. The resulting solutions were gently heated and the end-member solid acid phosphates obtained upon evaporation of water. Samples of overall composition Cs1−xRbxH2PO4 and Cs1−xKxH2PO4 were synthesized from these starting materials. Stoichiometric aqueous solutions of target overall composition were prepared and again solid precipitates obtained upon inducing water evaporation. For further experimentation the resulting materials were ground in a mortar and pestle to yield to powders with particle size of ∼10 μm.
Chemical compositions were measured by X-ray energy dispersive spectroscopy (EDS), performed using an Oxford INCA 300 in conjunction with a scanning electron microscope (LEO 1550 VP) at an accelerating voltage of 15 kV. For the Cs1−xRbxH2PO4 system, slight differences were determined between the nominal and actual compositions, Table 1, and all results are presented in terms of the actual (measured compositions). In the case of the Cs1−xKxH2PO4 system, the solubility of K into CsH2PO4 was found to be extremely limited, and the multi-phase nature of the resulting materials prevented acquisition of meaningful EDS data. Consequently, for these materials we refer only to the nominal compositions.
| Sample | Nominal (at.%) | Measured (at.%) |
|---|---|---|
| 19%Rb | 20 | 19.4 ± 1.2 |
| 50%Rb | 50 | 50.1 ± 1.3 |
| 78%Rb | 75 | 77.8 ± 1.8 |
2.2. In situ XRD measurements
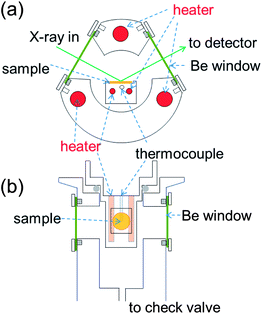
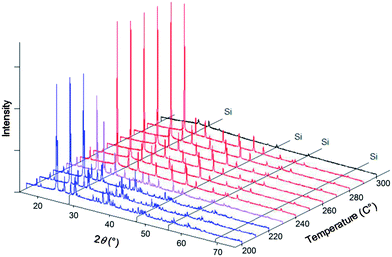
XRD measurements were carried out using an X'pert MD (Panalytical) diffractometer equipped with an in-house constructed sealed, high-temperature stage, Fig. 1. Two resistive heaters in the sample stage provide heat to the sample, the temperature of which is monitored and controlled using a thermocouple (K-type) also embedded in the stage. Three additional resistive heaters, typically set to ∼150 °C, are embedded in the walls of the chamber and are utilized to prevent water condensation. The chamber is further equipped with a check valve to limit the system pressure to 2 atm. Be windows permit incident and diffracted X-rays to enter and exit the chamber. A thin glass plate was placed on the sample stage to prevent possible reaction between the sample and stage material. The sample powder was combined, by light mechanical milling, with 20 at.% Si (Alfa Aesar, 99.9%), which served as an internal 2θ reference. No reaction between Si and the materials investigated was observed. Measurements were typically carried out in the temperature range 150 to 300 °C in 10 °C increments. Samples were held at each temperature for at least 30 minutes prior to data acquisition to allow for equilibration.Exemplary diffraction data obtained from this system are presented in Fig. 2 for the parent compound CsH2PO4. Consistent with the widely confirmed phase transformation behavior, the data show CsH2PO4 to remain entirely in the monoclinic phase to 220 °C. A two-phase mixture of the monoclinic and cubic phases is obtained at 230 °C, and from 240 to 290 °C only diffraction peaks from the cubic phase are evident. The material becomes entirely amorphous at 300 °C, corresponding to the occurrence of a liquid phase, likely as a result of direct melting. Based on the retention of the cubic phase to such high temperature,19 we estimate that a water partial pressure of ∼1 atm was attained in the sealed chamber. Crystallographic parameters were determined by Rietveld refinement using the RIETAN-FP software package.20 The known thermal expansion behavior of Si (ref. 21) provided an internal 2θ standard to ensure accurate lattice parameter refinement. To facilitate refinement of atomic positions, the P–O distance was fixed (at 1.52 Å (ref. 8)) irrespective of temperature. The refined parameters for cubic CsH2PO4 (Pm![[3 with combining macron]](https://www.rsc.org/images/entities/char_0033_0304.gif) m) are presented in Table 2.
m) are presented in Table 2.
![[3 with combining macron]](https://www.rsc.org/images/entities/char_0033_0304.gif) m, CsCl structure type) at several temperatures
m, CsCl structure type) at several temperatures
| T (°C) | a 0 (Å) | Cs1 | P1 | O1 | S | R P | ||||||||||||
|---|---|---|---|---|---|---|---|---|---|---|---|---|---|---|---|---|---|---|
| sof | x | y | z | B | sof | x | y | z | B | sof | x | y | z | B | ||||
| 230 | 4.9673(9) | 1 | 0 | 0 | 0 | 8.2 | 1 | 1/2 | 1/2 | 1/2 | 4.4 | 0.1667 | 1/2 | 0.221 | 0.374 | 4.4 | — | — |
| 240 | 4.9683(2) | 1 | 0 | 0 | 0 | 8.2(1) | 1 | 1/2 | 1/2 | 1/2 | 4.4(2) | 0.1667 | 1/2 | 0.221(1) | 0.374(1) | 4.4(2) | 1.38 | 3.94 |
| 250 | 4.9707(2) | 1 | 0 | 0 | 0 | 8.7(1) | 1 | 1/2 | 1/2 | 1/2 | 4.9(2) | 0.1667 | 1/2 | 0.222(1) | 0.374(2) | 4.9(2) | 1.32 | 3.79 |
| 260 | 4.9728(2) | 1 | 0 | 0 | 0 | 8.7(1) | 1 | 1/2 | 1/2 | 1/2 | 4.8(2) | 0.1667 | 1/2 | 0.222(1) | 0.373(2) | 4.8(2) | 1.34 | 3.80 |
| 270 | 4.9748(2) | 1 | 0 | 0 | 0 | 8.9(1) | 1 | 1/2 | 1/2 | 1/2 | 4.7(2) | 0.1667 | 1/2 | 0.223(1) | 0.374(1) | 4.7(2) | 1.30 | 3.77 |
| 280 | 4.9764(2) | 1 | 0 | 0 | 0 | 9.3(1) | 1 | 1/2 | 1/2 | 1/2 | 4.9(2) | 0.1667 | 1/2 | 0.223(1) | 0.367(2) | 4.9(2) | 1.31 | 3.80 |
| 290 | 4.9777(2) | 1 | 0 | 0 | 0 | 9.4(1) | 1 | 1/2 | 1/2 | 1/2 | 6.0(2) | 0.1667 | 1/2 | 0.222(1) | 0.374(1) | 6.0(2) | 1.18 | 3.49 |
2.3. Thermal measurements
Thermal analysis was performed using an in-house constructed differential thermal analyzer, shown schematically in Fig. 3, capable of accessing temperatures as high as 350 °C (with 0.1 °C stability) under water partial pressures as high as 0.9 atm. The system is a modification to an apparatus described previously as part of our earlier study of the phase behavior of CsH2PO4.4 In the present design, the sample stage is constructed of constantan alloy, the reference and sample are placed on the stage as shown in the figure, and directly beneath each (on the opposite side of the stage) is welded the junction of an E-type thermocouple. The temperatures of the sample and thermocouple are measured directly using the thermocouples, whereas the differential thermal signal between the sample and the reference is additionally recorded via measurement of the voltage generated between the two chromel leads. The voltage data are collected using a nanovolt meter (Keithley 182) with ±100 nV accuracy, corresponding to a precision of 0.02 mW. The electrical paths for measuring absolute temperature (the voltage between chromel–constantan couples) and that for measuring the differential temperature (voltage between two chromel leads) were electrically isolated during measurements by switching from one circuit to the other using a by Keithley 7001. The magnitude of the differential thermal signal was calibrated for measurement of heat using the melting reactions of Sn and of Pd at 232 and 327 °C, respectively. The heating and humidification schemes are unchanged relative to the previous configuration.4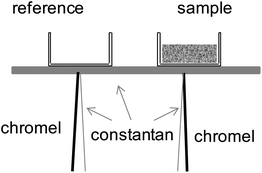 | ||
| Fig. 3 Schematic illustration of the in-house constructed DSC cell used for thermal studies under high pH2O. | ||
Prior to examination, the sample powders were combined with 20 wt% amorphous silica powder (Alfa Aesar, S.A 330–410, 325 mesh), homogenized by mechanical agitation, and then annealed under high humidity (pH2O = 0.6–0.85 atm) at high temperature (2 h at 350 °C followed by 6 h at 250 °C). This treatment creates a composite sample with a fine structure, which accelerates dehydration and hydration kinetics4 and enables access to equilibrium behavior on laboratory time scales.
Thermal data were collected at a heating rate of 0.5 K min−1 using samples typically 60 mg in mass. Under these conditions, the enthalpy for the superprotonic phase transition, with a reported value of 11.6 kJ mol,19 is detected as 11.5 ± 0.6 kJ mol−1. Due to the excellent quantitative agreement, the method can be considered functionally identical to differential scanning calorimetry (DSC).
2.4. AC impedance measurements
Conductivity of the materials was determined by AC impedance spectroscopy (HP 4284A). Samples were formed into discs, 9.3 mm in diameter and typically 2 mm in thickness, by uniaxial pressing of ground powders at 491 MPa for 10 min to achieve a relative density of 99% as determined from direct measurements of mass and physical dimensions. Sputtered films of Pt or Ag, approximately 100 nm in thickness, served as electrodes. Samples were placed in a horizontal tube furnace and held in place using Pt wire current collectors. Measurements were carried out in the temperature range 180 to 280 °C under humidified N2, pH2O = 0.9 atm, achieved by passing the inlet gas through a water bubbler held at 98 °C prior to its entrance to the measurement zone. Step changes in temperature of 5 to 10 °C were applied and the system allowed to equilibrate for at least 30 minutes or until the impedance response had stabilized before recording the final data. The temperature was measured using an alumina sheathed E-type thermocouple placed in direct contact with the sample.3. Results and discussion
3.1. Overall phase characteristics
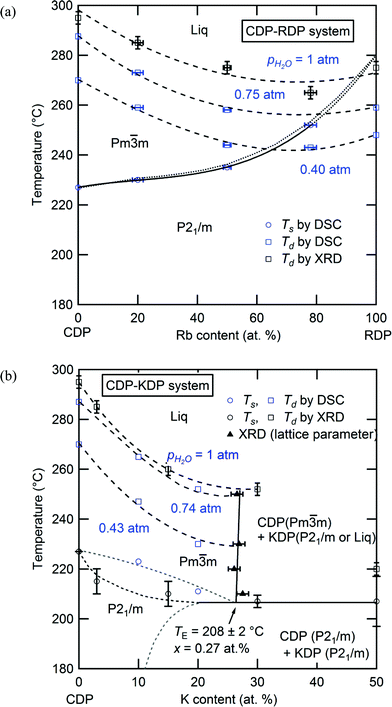
Integration of the results of the comprehensive structural, thermal and transport measurements of the materials yielded the phase diagrams presented in Fig. 4, part (a) showing the CsH2PO4–RbH2PO4 system and (b) the CsH2PO4–KH2PO4 system. Circles designate phase transition temperatures, squares dehydration temperatures, and triangles phase boundaries, where data in blue were acquired by DSC measurements and those in black by in situ XRD measurements. The CsH2PO4–RbH2PO4 system has simple isomorphous phase behavior. The end-members are entirely miscible at temperatures above 150 °C in both the monoclinic and cubic phases. The superprotonic transition temperature increases monotonically and the dehydration temperature largely decreases with increasing Rb content, resulting in a narrowing of the superprotonic region. At ambient temperature (not shown) the solubility limit of Rb into CsH2PO4 is ∼80 at.%,8 and the transformation of RbH2PO4 into the CsH2PO4-like monoclinic phase at 117 °C (ref. 22) facilitates complete solid solubility at the temperatures probed in this study. While compositions with very low Rb content were not explicitly studied here, the generally smooth manner in which the phase boundaries vary with composition suggest that the remarkable stabilization observed by Lavrova11 for Cs0.97Rb0.03H2PO4 may have been an artifact due to kinetic effects.In sharp contrast to the CsH2PO4–RbH2PO4 system, the CsH2PO4–KH2PO4 system displays eutectoid behavior with limited solubility of K in either phase of CsH2PO4. On introduction of K, the superprotonic transition temperature shifts downward until the eutectoid temperature of ∼208 °C (20 °C lower than the superprotonic temperature of neat CsH2PO4) is reached. The solubility of K into cubic CsH2PO4 is 27 at.% and is surprisingly temperature insensitive above the eutectoid point. Due to the challenges of determining composition in situ at high temperature, the solidus and solvus lines, however, could not be accurately determined; the dotted and dashed lines are approximate locations for these boundaries based on the requirements of the Gibbs phase rule.23 At ambient temperature (not shown in the phase diagram) the solubility of K into monoclinic CsH2PO4 is just 7.2 ± 0.8 at.%, significantly lower than the 27 at.% at the eutectoid point. Above the eutectoid temperature, compositions with greater than 27 at.% K form a mixture of a cubic CDP-rich phase and a KH2PO4-rich phase. At moderate temperatures the latter adopts the crystalline monoclinic structure recently reported for neat KH2PO4 (ref. 17) and transforms to a liquid at higher temperatures. The precise transformation temperature, which was found to be sensitive to humidity, could not be determined as a result of sluggish kinetics. Overall, the dehydration temperature in this system decreases notably on introduction of K, particularly so within the single-phase superprotonic region. Accordingly, there is an overall shift of the stable cubic region to lower temperature with increasing K content, along with a slight narrowing of the stability window.
3.2. Determination of phase behavior in the Cs1−xRbxH2PO4 system: 0 ≤ x ≤ 1
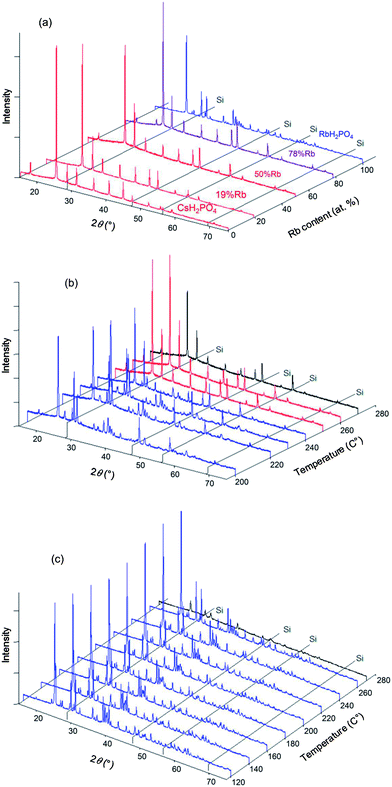
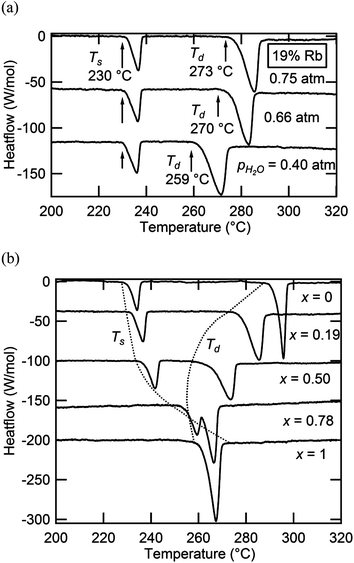
In situ XRD data were collected for the specific compositions in the Cs1−xRbxH2PO4 system of x = 0.19, 0.5, 0.78 (the actual compositions, Table 1) and for the end-member RbH2PO4, in addition to CsH2PO4 as reported above. Example diffraction results are presented in Fig. 5 both as a function of composition (part a) at high temperature (T = 260 °C) and as a function of temperature (parts b and c) for given compositions (x = 0.5, 1, respectively). The data show that the Cs1−xRbxH2PO4 compounds transform from the CDP-type monoclinic phase to the cubic CsCl-type phase of superprotonic CsH2PO4. Furthermore, the monoclinic P21/m phase reported to occur above 130 °C in RbH2PO4 is confirmed (and is even found to exist at 120 °C). However, no cubic phase was observed in the absence of Cs. The diffraction peaks are lost from RbH2PO4 at 270 °C, suggesting the occurrence of a liquid phase. It is possible the cubic superprotonic phase may be accessible under pH2O values higher than the ∼1 atm estimated for the sealed diffraction chamber, as it is under high total pressure (1 GPa).14 Such conditions were not examined here. For all the compounds, at sufficiently high temperatures, the XRD data are marked by the absence of diffraction peaks. By analogy to CsH2PO4, this behavior is taken to reflect the presence of a partially dehydrated liquid (MH2−2xPO4−x(l), M = alkali metals), and the temperature at which the crystalline phase is no longer observed is taken to be the decomposition temperature. Weight loss at this temperature was not independently confirmed, but the DSC measurements, as discussed below, are consistent with such an interpretation.Selected DSC profiles for compounds in the Cs1−xRbxH2PO4 system are presented in Fig. 6, part a for fixed x = 0.19 and part b for fixed pH2O. Two thermal events are evident in all cases. At fixed stoichiometry, the first event occurs at a given temperature, 230 °C in this example, whereas the second depends on the water partial pressure. This behavior is consistent with the identification of the first transition as a polymorphic transformation, involving no change in sample composition, and of the second transition as a dehydration or partial dehydration event, involving loss of H2O from the structure. With increasing Rb content (Fig. 6b), the temperature of the polymorphic transition monotonically increases, whereas the decomposition temperature generally decreases but finally increases slightly for the RbH2PO4 end-member. At x = 0.78 and pH2O = 0.75 atm, for example, the polymorphic transition just precedes the dehydration, and the two events are almost indistinguishable. These trends are reflected in the phase diagram presented in Fig. 4(a), for which Ts and Td are defined in terms of the onset of the respective thermal anomalies.
In principle, the monoclinic to cubic phase transition should pass through a two-phase region. The relatively sharp DSC peaks, spanning no more than ∼9 K, indicate that the two-phase region is rather narrow, as displayed in the phase diagram. No attempt was made in the diffraction measurements to capture the compositional breadth of the two phase region, a rather subtle feature of the phase diagram. Similar to the superprotonic transition, the dehydration anomaly displays a relatively sharp peak, despite the likely transformation to a partially dehydrated liquid and continuous weight loss at high temperature.4 Such behavior is similar to that observed in CsH2PO4 in which the dehydration is confirmed to occur over a wide temperature range but with a relatively sharp thermal signal, reflecting the fact that the majority of the weight loss occurs shortly after the onset of dehydration. The breadths, magnitudes, and onset temperatures for the superprotonic transformation and dehydration peaks are summarized in Table 3. The enthalpies of transformation/dehydration are largely independent of composition, with a typical value of 11.5 kJ mol−1 for the superprotonic transition and 31.4 kJ mol−1 for dehydration (comparable to the thermal properties of CsH2PO4 (ref. 4)). It has been suggested that the entropy of the superprotonic transition can be accounted for in terms of the configurational disorder of the oxygen atoms and protons in the cubic phase.19,24 In light of the almost constant Ts, an almost constant ΔH is consistent with this interpretation and suggests the absence of any local ordering effects between Cs and Rb.
| Composition | Superprotonic transition | Dehydration | ||||
|---|---|---|---|---|---|---|
| ΔH (kJ mol−1) | T onset (°C) | FWHM (°C) | ΔH (kJ mol−1) | T onset (°C) | FWHM (°C) | |
| CsH2PO4 | 11.5 ± 0.6 | 227.2 ± 0.4 | 2.9 ± 0.1 | 31.0 ± 1.6 | 288.5 ± 0.5 | 2.6 ± 0.1 |
| 19%Rb | 11.8 ± 0.5 | 230.6 ± 0.3 | 3.6 ± 0.1 | 30.2 ± 1.3 | 273.5 ± 0.4 | 5.7 ± 0.1 |
| 50%Rb | 11.8 ± 0.9 | 234.9 ± 0.4 | 3.7 ± 0.1 | 29.0 ± 3.1 | 258.1 ± 0.5 | 6.3 ± 0.1 |
| 78%Rb | — | 251.6 ± 0.2 | 4.2 ± 0.1 | — | 258 ± 3 | 4.2 ± 0.1 |
| RbH2PO4 | — | — | — | — | 258.9 ± 0.6 | 4.3 ± 0.1 |
3.3. Determination of phase behavior in the Cs1−xKxH2PO4 system: 0 ≤ x ≤ 0.5
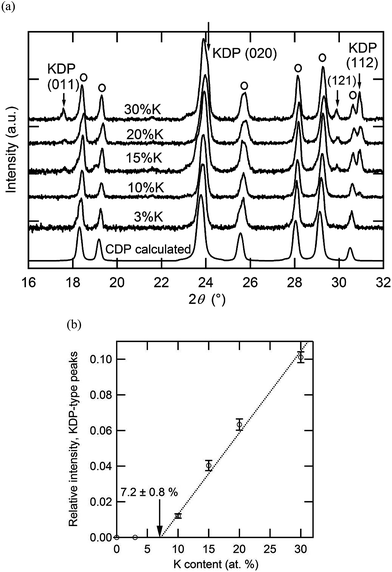
The room temperature XRD patterns of the Cs1−xKxH2PO4 system have not been previously reported and are accordingly provided here in Fig. 7. The patterns with x = 0 and 0.03 are almost identical, indicating a minimum K solubility of 3 at.%. At higher x (10 at.% and higher), the patterns reflect the presence of a two-phase mixture of a CsH2PO4-type monoclinic phase (P21/m) and a KH2PO4-type tetragonal phase. From an analysis of the intensity of the diffraction peaks of the latter and extrapolation to the composition at which these peaks would have zero intensity, we estimate the K solubility in monoclinic CsH2PO4 to be 7.2 ± 0.8 at.% (Fig. 7b). Within the two-phase region, the lattice constants of the KH2PO4-type tetragonal phase are, within error, equal to that of neat KH2PO4 (specifically, respective cell volumes of 386.1 (ref. 16) and 384 ± 1 Å3 at room temperature), indicating that the solubility of Cs into this phase is no more than a few at. %.
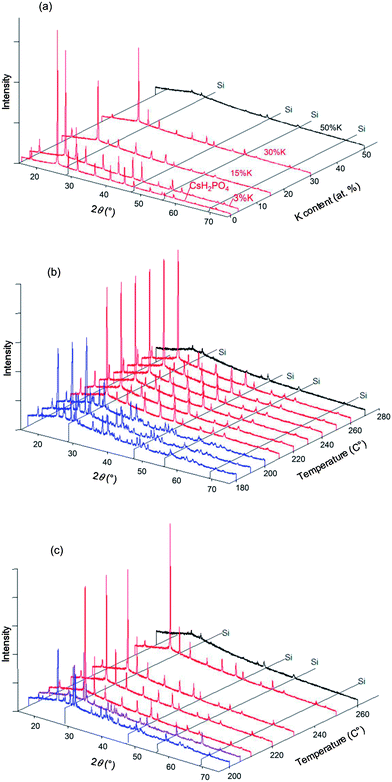
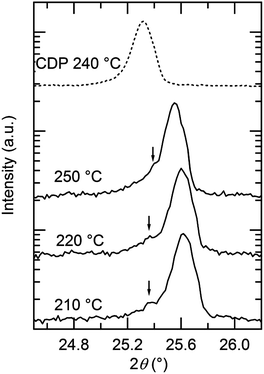
In situ high-temperature XRD experiments were performed in the Cs1−xKxH2PO4 system for the specific compositions x = 0.03, 0.15, 0.3, and 0.5, with higher potassium concentrations being of less interest with respect to superprotonic behavior. Selected diffraction results are presented in Fig. 8. At 250 °C, the data show that the cubic CsCl-type phase is the only crystalline phase present for all compositions (Fig. 8a), but in the case of x = 0.5, a broad amorphous background, indicative of a liquid phase, is the most significant feature, and the peaks from the crystalline phase are barely detectable. That the amorphous phase is liquid rather than solid was deduced on the basis of the transformation of the loose powder sample placed in the diffraction chamber into a coagulated, shiny agglomerate by the conclusion of the experiments. The temperature-dependent diffraction data reveal the x = 0.15 composition to be composed in the temperature range from 180 to 200 °C of a mixture of isostructural CsH2PO4-type and KH2PO4-type monoclinic phases (Fig. 8b). Lower temperatures were not examined, but this result indicates that, as with the Rb system, dissolution of Cs into KH2PO4 stabilizes the monoclinic form otherwise observed at slightly higher temperatures17 (190 °C and higher). At temperatures between 210 and 260 °C only peaks from the CsCl-type cubic phase are evident, and finally at 270 °C all diffraction peaks disappear and only the liquid is present. This behavior is generally reproduced for the x = 0.3 composition (Fig. 8c). In this case, however, an additional peak was observed around 2θ = 25° at temperatures at which the cubic phase is stable, as shown more clearly in Fig. 9. The peak location coincides with that of the (1 1 ![[1 with combining macron]](https://www.rsc.org/images/entities/char_0031_0304.gif) ) peak of monoclinic KH2PO4. At 205 °C after cooling from 210 °C, peaks from the cubic CsH2PO4-type phase, the monoclinic CsH2PO4-type phase and the monoclinic KH2PO4-type phase were observed. This co-existence suggests that the lower boundary of the cubic CsH2PO4-type phase lies between 205 and 210 °C. Slow equilibration kinetics prevented acquisition of diffraction data that would have provided more definitive identification of the phase boundaries.
) peak of monoclinic KH2PO4. At 205 °C after cooling from 210 °C, peaks from the cubic CsH2PO4-type phase, the monoclinic CsH2PO4-type phase and the monoclinic KH2PO4-type phase were observed. This co-existence suggests that the lower boundary of the cubic CsH2PO4-type phase lies between 205 and 210 °C. Slow equilibration kinetics prevented acquisition of diffraction data that would have provided more definitive identification of the phase boundaries.
Given the challenges of direct determination of the equilibrium phase assemblage at high temperature, an evaluation of the lattice parameter dependence on composition was used as a secondary means of estimating the solubility limit of K into cubic Cs1−xKxH2PO4. In Fig. 10 this parameter is shown as a function of potassium content at 230 and 250 °C. At low K content, the cell constant decreases linearly, in accord with Vegard's empirical law. The data points for the x = 0.3 composition, however, deviate from the linear relationship. Extrapolation of the lattice parameter trendline to the measured values at x = 0.3 suggests an actual composition (i.e., solubility limit) of 27 at.% at both temperatures. This method of analysis is justified by the observation of a linear dependence of lattice parameter on dopant content in the superprotonic cubic phase within the Cs1−xRbxH2PO4 system (as discussed below).
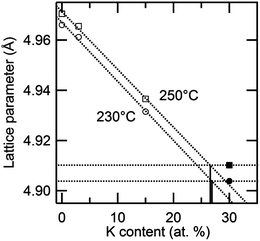 | ||
| Fig. 10 Variation of the high temperature lattice parameter of cubic Cs1−xKxH2PO4 as a function of x at 230 and 250 °C. | ||
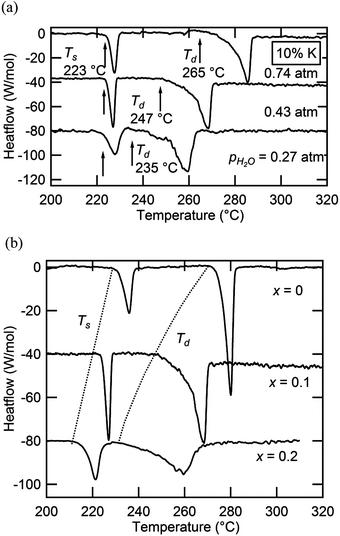
Selected DSC measurements in the Cs1−xKxH2PO4 system are presented in Fig. 11, showing both (a) isocompositional and (b) isobaric results. Thermal measurements in this case were limited to compositions of x = 0.1 and 0.2. As evidenced from Fig. 11(a), a lower temperature transition occurs that is independent of pH2O and is followed by a higher temperature one that shifts to lower temperature on decrease of pH2O. These events are consequently interpreted as a polymorphic transition and a dehydration reaction, respectively. The behavior is analogous to that of the Cs1−xRbxH2PO4 system, with the dehydration similarly resulting in a product phase that is a liquid. In contrast to the first system, however, a slight discrepancy was observed with respect to the temperature of the polymorphic transition as determined by diffraction and by calorimetry. For example, for x = 0.15, one observes a fully cubic pattern at 210 °C, Fig. 8b, whereas the x = 0.10 composition has an onset for the polymorphic transition, Ts, of 223 °C. Furthermore, on introduction of K, the thermal signatures widen, particularly for x = 0.2 for the superprotonic transition and for both compositions for the dehydration event. These features in the Cs1−xKxH2PO4 system are tentatively assigned to wider compositional differences between phases in the two-phase regions. During the transformation from the monoclinic to cubic phase at small x, the finite heating rate used in the DSC experiments may, as a consequence of the necessary solid state diffusion, retard the transition and shift it to higher temperature than observed under the quasi-equilibrium conditions of the diffraction experiment. Similarly, gradual and continuous phase separation into distinct monoclinic and cubic phases or a potassium-rich liquid dehydrate [MH2−2xPO4−x(l)] and a cesium-rich solid may be responsible for the broadening observed in the thermal peaks.
3.4. Structural and transport properties
The thermal expansion behavior of the cubic phase in the Cs1−xRbxH2PO4 and Cs1−xKxH2PO4 systems is summarized in Fig. 12 and Table 4, where the coefficients of thermal expansion, α, are of the form Δa/a0 = α(T − T0), with T0 = 260 °C. These coefficients are approximately 4 × 10⁻⁵ K−1 for each of the compounds with negligible impact from the introduction of substituents. The volumetric expansion coefficient (3α) for CsH2PO4 in the cubic phase, determined here to be 1.57(3) × 10−4 K−1, is slightly smaller than that, 1.98(2) × 10−4 K−1, reported by Louie.7 The lattice parameters measured in this work agree well with Louie's values and are slightly larger than those of other reports.25–27 The influence of material composition, specifically, the weighted mean ionic radii,28 on the cubic lattice parameter (at 260 °C) is summarized in Fig. 13. The data from the two systems show good agreement, indicating that the lattice constant of the solid-solution cubic phase depends simply on the averaged ionic radius of cations in the alkali ion site rather than the nature of the specific cation. Again, the behavior is in accord with Vegard's empirical law.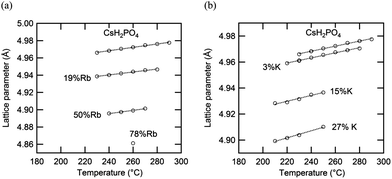 | ||
| Fig. 12 Lattice parameters of cubic (a) Cs1−xRbxH2PO4 and (b) Cs1−xKxH2PO4 as functions of temperature under pH2O ∼ 1 atm (the estimated errors lie within the size of the data markers). | ||
| Composition | α (10−5 K−1) | a 0 (Å) | T (°C) | Composition | α (10−5 K−1) | a 0 (Å) | T (°C) |
|---|---|---|---|---|---|---|---|
| CsH2PO4 | 3.92(11) | 4.9724(2) | 230–290 | ||||
| 19%Rb | 3.42(17) | 4.9440(2) | 230–280 | 3%K | 3.95(13) | 4.9675(2) | 220–280 |
| 50%Rb | 3.85(19) | 4.8991(2) | 240–270 | 15%K | 4.54(48) | 4.9388(8) | 210–250 |
| 78%Rb | — | 4.8612(3) | 260 | 30%K | 4.65(10) | 4.9107(6) | 210–250 |
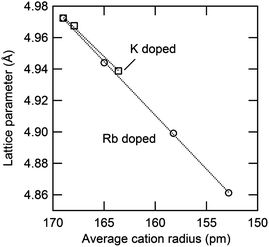 | ||
| Fig. 13 Relationship between averaged ionic radius and lattice parameter in cubic Cs1−xRbxH2PO4 and Cs1−xKxH2PO4 at 260 °C. For the latter, the values are extrapolated from measurements at slightly lower temperatures using the measured thermal expansion coefficient (Table 4). | ||
The AC impedance measurements revealed that the solid solution cubic phase has high conductivity in both the CsH2PO4–RbH2PO4 and the CsH2PO4–KH2PO4 systems. The impedance spectra at high temperature displayed typical features19 in which the response appears as a straight line with a real intercept at the high frequency limit corresponding to the resistance of the polycrystalline solid electrolyte, Fig. 14. In the case of the Rb containing compositions, the low temperature spectra were also typical of CsH2PO4, as shown for example for Cs0.81Rb0.19H2PO4, Fig. 14(a), in which the spectrum appears as a single, high-frequency arc, the diameter of which corresponds to the resistance of the electrolyte. The difference in conductivity at 200 and at 240 °C is almost four orders of magnitude, similar to the reported impact of the superprotonic transition on the transport properties of neat CsH2PO4. In contrast, the K containing compositions displayed surprisingly high conductivity even at temperatures below the transition, with the difference in conductivity between 202 and 243 °C being only about a factor of six for Cs0.90K0.10H2PO4. Although such enhancement is intriguing and results in spectra that are similar in the high and low temperature phases, Fig. 14(b), it was not explored further due to the overall low conductivity of the monoclinic phase. Moreover, measurements in the CsH2PO4–KH2PO4 system were limited to compositions lying within the solubility limit of potassium into monoclinic CsH2PO4 so as to eliminate any influence of ensemble microstructure. For comparative purposes, the conductivity of CsH2PO4 was also measured and was found to be in excellent agreement with literature values.1,2,19,29
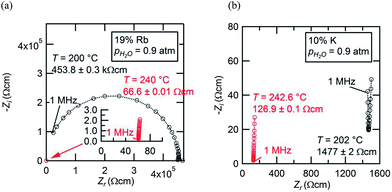 | ||
| Fig. 14 AC impedance spectra collected from (a) Cs0.81Rb19H2PO4 and (b) Cs0.90K0.10H2PO4 at temperatures just below (black) and just above (red) the respective Ts values with pH2O = 0.9 atm. The behavior of Cs0.81Rb19H2PO4 is entirely analogous to that of neat CsH2PO4.19 In the case of Cs0.90K0.10H2PO4, the surprisingly high conductivity below Ts results in a spectrum that has similar general characteristics to that above Ts, appearing as an almost vertical straight line with real intercept that corresponds to the bulk electrolyte conductivity. | ||
Focusing on transport in the high temperature phase, Fig. 15, it is apparent that introduction of both Rb and K leads to a monotonic reduction of the conductivity of CsH2PO4. A similar result was observed by Matsuo,9 but was reported without comment. Here, it is further observed that potassium has a stronger impact than rubidium. A close examination of the Arrhenius representation of the conductivity data reveals that, although the conductivity decreases on with increasing concentration of Rb or K, the activation energy for transport also decreases, and hence it is the reduction in the pre-exponential factor, A, in the expression  that correlates with the reduction in conductivity. A detailed investigation of the role of cation chemistry on proton transport characteristics is beyond the scope of the present work, which is instead focused on exploration of phase stability. Nevertheless, it is noteworthy that changes to the averaged structure apparently do not account for the change in transport properties. Specifically, although the cell volumes of Cs0.81Rb0.19H2PO4 and Cs0.90K0.10H2PO4 are almost identical, the latter has a conductivity that is less than half that of the former and an activation energy that is also almost halved in comparison, Table 5. Elucidation of the origins of this intriguing phenomenon awaits a future study.
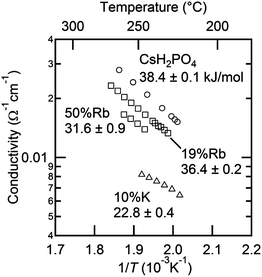 | ||
| Fig. 15 Arrhenius representation of the conductivities of cubic Cs1−xRbxH2PO4 and Cs1−xKxH2PO4 as functions of temperature. | ||
| Composition | E a (eV) | log(A) Ω−1 cm−1 K |
|---|---|---|
| CsH2PO4 | 38.4 ± 0.1 | 11.32 ± 0.02 |
| 19%Rb | 36.4 ± 0.2 | 10.60 ± 0.05 |
| 50%Rb | 31.6 ± 0.9 | 9.31 ± 0.20 |
| 10%K | 22.8 ± 0.4 | 6.73 ± 0.08 |
4. Conclusions and summary
The results of this work are summarized as follows. The CsH2PO4–RbH2PO4 system displays complete solid solubility at all temperatures above 180 °C. The transformation from the monoclinic phase (P21/m) to the superprotonic cubic phase (Pm![[3 with combining macron]](https://www.rsc.org/images/entities/char_0033_0304.gif) m) shifts to higher temperatures with increasing Rb content. Simultaneously, the dehydration temperature largely decreases, resulting in a narrowing of the region of stability of the cubic phase. In the case of the end-member RbH2PO4 compound, this phase cannot be observed under 1 atm pH2O. While a two-phase region is expected between the monoclinic and cubic phases at intermediate composition, the width of this region is too small for detection in this study. In contrast, CsH2PO4–KH2PO4 forms a eutectoid system, with a eutectoid temperature of ∼208 °C. The solubility limit of K into cubic CDP is 27 at.% and is surprisingly temperature insensitive above the eutectoid temperature up to 260 °C. Below the eutectoid point the solubility drops steeply. Within the single-phase cubic region, the transition temperature decreases monotonically, but is accompanied by a simultaneous decrease in the dehydration temperature. Thus, the phase stability width of the superprotonic phase is relatively unchanged upon introduction of K. The phase boundaries could not be accurately determined due to the challenges of high temperature, in situ composition measurements and the slow equilibration kinetics. A wider two-phase region between monoclinic and cubic phases than the Rb system is inferred on the basis of the broader DSC signals.
m) shifts to higher temperatures with increasing Rb content. Simultaneously, the dehydration temperature largely decreases, resulting in a narrowing of the region of stability of the cubic phase. In the case of the end-member RbH2PO4 compound, this phase cannot be observed under 1 atm pH2O. While a two-phase region is expected between the monoclinic and cubic phases at intermediate composition, the width of this region is too small for detection in this study. In contrast, CsH2PO4–KH2PO4 forms a eutectoid system, with a eutectoid temperature of ∼208 °C. The solubility limit of K into cubic CDP is 27 at.% and is surprisingly temperature insensitive above the eutectoid temperature up to 260 °C. Below the eutectoid point the solubility drops steeply. Within the single-phase cubic region, the transition temperature decreases monotonically, but is accompanied by a simultaneous decrease in the dehydration temperature. Thus, the phase stability width of the superprotonic phase is relatively unchanged upon introduction of K. The phase boundaries could not be accurately determined due to the challenges of high temperature, in situ composition measurements and the slow equilibration kinetics. A wider two-phase region between monoclinic and cubic phases than the Rb system is inferred on the basis of the broader DSC signals.
In both systems, the cubic cell volume decreases in proportion to the substituent concentration. The reduction is independent of the nature of the element, instead being given by the average cation radius. The thermal expansion coefficient in the cubic phase is, within the limits of measurement, independent of composition.
The most significant finding is the substantial reduction in conductivity in the high-temperature cubic phase upon introduction of substituent elements. This reduction occurs as a result of a dramatic decrease in the pre-exponential factor. Furthermore, the influence of K on the conductivity exceeds that of its influence on the cell volume, suggesting that the impact on transport must be due to local rather than global or averaged effects. The reduction in conductivity due to the introduction of substituent elements, though undesirable from a technological perspective, provides a possible avenue for elucidating and ultimately tuning the rate-limiting step in charge transport in superprotonic crystals. At this stage, unmodified CsH2PO4 remains the most feasible composition for fuel cell development.
Acknowledgements
The authors gratefully acknowledge financial support from U.S. National Science Foundation, Division of Materials Research (DMR-0906543) and the Army Research Office MURI Program (W911NF-07-1-0410).References
- D. A. Boysen, T. Uda, C. R. I. Chisholm and S. M. Haile, Science, 2004, 303, 68–70 CrossRef CAS PubMed.
- J. Otomo, T. Tamaki, S. Nishida, S. Q. Wang, M. Ogura, T. Kobayashi, C. J. Wen, H. Nagamoto and H. Takahashi, J. Appl. Electrochem., 2005, 35, 865–870 CrossRef CAS PubMed.
- T. Uda, D. A. Boysen, C. R. I. Chisholm and S. M. Haile, Electrochem. Solid-State Lett., 2006, 9, A261–A264 CrossRef CAS PubMed.
- A. Ikeda and S. M. Haile, Solid State Ionics, 2012, 213, 63–71 CrossRef CAS PubMed.
- Y. Uesu and J. Kobayashi, Phys. Status Solidi A, 1976, 34, 475–481 CrossRef CAS.
- A. R. Al-Karaghouli, B. Abdul-Wahab, E. Ajaj and A. Sequeira, Acta Crystallogr., Sect. B: Struct. Crystallogr. Cryst. Chem., 1978, 34, 1040–1042 CrossRef.
- M. W. Louie, M. Kislitsyn, K. Bhattacharya and S. M. Haile, Solid State Ionics, 2010, 181, 173–179 CrossRef CAS PubMed.
- L. Cowan, Ph.D. Thesis, California Institute of Technology, Pasadena, California, 2007.
- Y. Matsuo, J. Hatori, Y. Yoshida and S. Ikehata, Solid State Ionics, 2012, 213, 42–44 CrossRef CAS PubMed.
- C. E. Botez, H. Martinez, R. J. Tackett, R. R. Chianelli, J. Z. Zhang and Y. S. Zhao, J. Phys.: Condens. Matter, 2009, 21, 325401 CrossRef PubMed.
- G. V. Lavrova, V. V. Martsinkevich and V. G. Ponomareva, Inorg. Mater., 2009, 45, 795–801 CrossRef CAS.
- A. Ikeda and S. M. Haile, Solid State Ionics, 2010, 181, 193–196 CrossRef CAS PubMed.
- V. V. Martsinkevich, V. G. Ponomareva, T. N. Drebushchak, G. V. Lavrova and S. S. Shatskaya, Inorg. Mater., 2010, 46, 765–769 CrossRef CAS.
- C. E. Botez, R. J. Tackett, J. D. Hermosillo, J. Z. Zhang, Y. S. Zhao and L. P. Wang, Solid State Ionics, 2012, 213, 58–62 CrossRef CAS PubMed.
- H. Naili, N. Zouari, T. Mhiri and A. Daoud, J. Mol. Struct., 2000, 519, 143–151 CrossRef CAS.
- K. Itoh and M. Uchimoto, Ferroelectrics, 1998, 217, 155–162 CrossRef CAS.
- C. E. Botez, D. Carbajal, V. A. K. Adiraju, R. J. Tackett and R. R. Chianelli, J. Phys. Chem. Solids, 2010, 71, 1576–1580 CrossRef CAS PubMed.
- D. A. Boysen, S. M. Haile, H. J. Liu and R. A. Secco, Chem. Mater., 2004, 16, 693–697 CrossRef CAS.
- S. M. Haile, C. R. I. Chisholm, K. Sasaki, D. A. Boysen and T. Uda, Faraday Discuss., 2007, 134, 17–39 RSC.
- F. Izumi and K. Momma, Applied Crystallography XX, 2007, 130, 15–20 CAS.
- B. N. Dutta, Phys. Status Solidi B, 1962, 2, 984–987 CrossRef CAS.
- M. Komukae, K. Kawashima and T. Osaka, J. Phys. Soc. Jpn., 2000, 69, 2076–2081 CrossRef CAS.
- P. W. Atkins and J. de Paula, Physical chemistry, Oxford University Press, 8th edn, 2006 Search PubMed.
- C. R. I. Chisholm, Ph.D. Thesis, California Institute of Technology, 2003.
- K. Yamada, Solid State Ionics, 2004, 175, 557–562 CrossRef CAS PubMed.
- W. Bronowska, Mater. Sci.-Pol., 2006, 24, 229–236 CAS.
- A. Preisinger, K. Mereiter and W. Bronowska, Mater. Sci. Forum, 1994, 166, 511–516 CrossRef.
- L. Pauling, The Nature of the Chemical Bond, Cornell University Press, 1960 Search PubMed.
- A. Ishikawa, H. Maekawa, T. Yamamura, Y. Kawakita, K. Shibata and M. Kawai, Solid State Ionics, 2008, 179, 2345–2349 CrossRef CAS PubMed.
| This journal is © The Royal Society of Chemistry 2014 |

