 Open Access Article
Creative Commons Attribution 3.0 Unported Licence
Timescales of emulsion formation caused by anisotropic particles
Florian
Günther
a,
Stefan
Frijters
a and
Jens
Harting
*ab
aDepartment of Applied Physics, Eindhoven University of Technology, Den Dolech 2, NL-5600MB Eindhoven, The Netherlands. E-mail: j.harting@tue.nl
bInstitute for Computational Physics, University of Stuttgart, Allmandring 3, D-70569 Stuttgart, Germany
First published on 8th April 2014
Abstract
Particle stabilized emulsions have received much interest in the recent past, but our understanding of the dynamics of emulsion formation is still limited. For simple spherical particles, the time dependent growth of fluid domains is dominated by the formation of droplets, particle adsorption and coalescence of droplets (Ostwald ripening), which eventually can be almost fully blocked due to the presence of the particles. Ellipsoidal particles are known to be more efficient stabilizers of fluid interfaces than spherical particles and their anisotropic shape and the related additional rotational degrees of freedom have an impact on the dynamics of emulsion formation. In this paper, we investigate this point by means of simple model systems consisting of a single ellipsoidal particle or a particle ensemble at a flat interface as well as a particle ensemble at a spherical interface. By applying combined multicomponent lattice Boltzmann and molecular dynamics simulations we demonstrate that the anisotropic shape of ellipsoidal particles causes two additional timescales to be of relevance in the dynamics of emulsion formation: a relatively short timescale can be attributed to the adsorption of single particles and the involved rotation of particles towards the interface. As soon as the interface is jammed, however, capillary interactions between the particles cause a local reordering on very long timescales leading to a continuous change in the interface configuration and increase of the interfacial area. This effect can be utilized to counteract the thermodynamic instability of particle stabilized emulsions and thus offers the possibility to produce emulsions with exceptional stability.
I. Introduction
Particle stabilized emulsions play an important role in pharmaceutical, food, oil and cosmetic industries.1 The particles are adsorbed at the interface between two immiscible fluids and as such stabilize the emulsion. The stability of the emulsions depends on several parameters like particle coverage at the interfaces and the wettability of the particles. It was found that the particle coverage at the interface is the most important parameter for stabilizing emulsions.2 The colloidal particles act in a similar way as surfactants. In both cases the free energy of the interface is reduced. However, the fluid–fluid interfacial tension is not being modified by particles.3Several types of particle stabilized emulsions are known including the bicontinuous interfacially jammed emulsion gel (bijel) and the more widely known Pickering emulsion. The Pickering emulsion was discovered in the beginning of the 20th century independently by Pickering and Ramsden.4,5 It consists of discrete particle covered droplets of a fluid immersed in a second fluid. The bijel was predicted in 2005 by simulations and experimentally realized for the first time in 2007.6,7 It consists of two continuous phases. The choice of control parameters such as particle concentration, particle wettability and ratio between the two fluids determines if a bijel or a Pickering emulsion is obtained.8,9 There are many kinds of particles/colloid types which can stabilize an emulsion, i.e., next to spheres,10,11 the colloidal particles can also be of more complex nature and include anisotropic shapes,12 magnetic interactions,13,14 or anisotropic Janus style properties.15
The influence of the particle shape on the stabilization of Pickering emulsions was studied experimentally with prolate and oblate ellipsoids, e.g. in ref. 16. As the degree of the particle anisotropy increases, the effective coverage area increases. In this way they are more efficient stabilizers for emulsions than spherical particles. Furthermore, the rheological properties of the emulsion vary with changing aspect ratio because the coverage of the fluid interfaces and the capillary interactions differ.
In ref. 8 and 17–20 the adsorption of a single particle at a flat interface is studied in the absence of external fields. The stable configuration for elongated ellipsoids is the orientation parallel to the interface.8 This state minimizes the free energy of the particle at the interface by reducing the interfacial area.17,19,20 If the particle shape is more complex like e.g. the super-ellipsoidal hematite particle,21 several equilibrium orientations are possible.
Furthermore, if particles are adsorbed at an interface they generally deform the interface. This deformation can be caused for example by particle anisotropy,22 external forces such as gravity or electromagnetic forces acting on the particles,23,24 or non-constant interface curvature.25 This deformation leads to capillary interactions between the particles. In the case of ellipsoids at a flat interface it is quadrupolar potential,26 which leads to spatial ordering.27
In general, particle stabilized emulsions are thermodynamically unstable and just kinetically stable. The energetic penalty for creating the interface is much higher than the entropic increase. While thermodynamic stability for emulsions has been reported in some special cases, one can generally assume that this requires the interplay of several effects such as particle interactions due to charges, amphiphilic interactions (Janus particles) or additional degrees of freedom.28–30
Due to the short timescales and limited optical accessibility, the dynamics of the formation of emulsions has only found limited attendance so far.31 The focus of the current article is to study the influence of the geometrical anisotropy and rotational degrees of freedom of ellipsoidal particles on the time development of fluid domain sizes in particle-stabilized emulsions. To obtain a deeper understanding of the individual contributions to the stabilization and formation process due to the particles we investigate model systems involving either a single particle or particle ensembles at a simple interface. We will demonstrate that the rotational degrees of freedom of ellipsoids can have an impact on the domain growth and might be a suitable way to generate particle stabilized emulsions with exceptional long-term stability.
This article is organized as follows: the simulation method is introduced in Section II. Dynamic emulsion properties are studied in Section III. Sections IV and V discuss a single particle and a particle ensemble at a flat interface, respectively. Section VI describes the behavior of a particle ensemble at a spherical interface. We finalize the paper with a conclusion.
II. Simulation method
A. The lattice Boltzmann method
For the simulation of the fluids the lattice Boltzmann method is used.32 The discrete form of the Boltzmann equation can be written as3| fci(x + ciΔt,t + Δt) = fci(x, t) + Ωci(x, t), | (1) |
 | (2) |
 where ρ0 is the proportionality factor of the density. τc is the relaxation time for the component c and
 | (3) |
 | (4) |
 is the velocity and ζi is a coefficient depending on the direction: ζ0 = 1/3 for the zero velocity, ζ1,…,6 = 1/18 for the six nearest neighbors and ζ7,…,18 = 1/36 for the next nearest neighbors in the diagonal direction. The kinematic viscosity can be calculated as
 | (5) |
In the following we choose Δx = Δt = ρ0 = 1 for simplicity. In all simulations the relaxation time is set to τc ≡ 1.
B. Multicomponent lattice Boltzmann
There are different extensions for the lattice Boltzmann method to simulate multi-component and multiphase systems.34–38 An overview on different methods for multi-component fluid systems and the treatment of fluid–fluid interfaces is given in ref. 39. In this paper, the method introduced by Shan and Chen is used.34 Every species has its own distribution function following eqn (1). To obtain an interaction between the different components a force | (6) |
| Ψc(x, t) ≡ Ψ(ρc(x, t)) = 1 − e−ρc(x, t) | (7) |
 | (8) |
The macroscopic velocity included in feqi is shifted by Δuc as
 | (9) |
As we are interested in immiscible fluids we choose a positive value for gcc′ which leads to a repulsive interaction. This interaction has to be strong enough to obtain two separate phases but it should not be too high in order to keep the simulation stable. Here, we use the range of 0.08 ≤ gcc′ ≤ 0.14.
C. Nanoparticles
Particles are simulated with molecular dynamics where Newton's equations of motionF = m![[u with combining dot above]](https://www.rsc.org/images/entities/b_char_0075_0307.gif) par and D = J par and D = J![[small omega, Greek, dot above]](https://www.rsc.org/images/entities/i_char_e15a.gif) par par | (10) |
The particles are also discretized on the lattice. They are coupled to both fluid species by a modified bounce-back boundary condition which was originally introduced by Ladd.9,40–43 This changes the lattice Boltzmann equation as follows:
 | (11) |
 depends linearly on the local particle velocity, ī is defined in a way that ci = −cī is fulfilled. A change of the fluid momentum due to a particle leads to a change of the particle momentum in order to keep the total momentum conserved:
 | (12) |
If the particle moves, some lattice nodes become free and others become occupied. The fluid on the newly occupied nodes is deleted and its momentum is transferred to the particle as
 | (13) |
A newly freed node (located at x) is filled with the average density of the NFN neighboring fluid lattice nodes xiFN for each component c,
 | (14) |
Hydrodynamics leads to a lubrication force between the particles. This force is reproduced automatically by the simulation for sufficiently large particle separations. If the distance between the particles is so small that no free lattice point exists between them this reproduction fails. If the smallest distance between two identical spheres with radius R is smaller than a critical value  the correction term is given as:43
 | (15) |
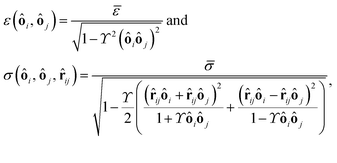
![[r with combining circumflex]](https://www.rsc.org/images/entities/b_char_0072_0302.gif) ij a unit vector pointing from one particle center to the other one and ui is the velocity of particle i. To use this potential for ellipsoidal particles eqn (15) is generalized in a way proposed by Berne and Pechukas.8,44,45 We define σ = 2R and
ij a unit vector pointing from one particle center to the other one and ui is the velocity of particle i. To use this potential for ellipsoidal particles eqn (15) is generalized in a way proposed by Berne and Pechukas.8,44,45 We define σ = 2R and  . Both are extended to the anisotropic case as
 | (16) |
![[small sigma, Greek, macron]](https://www.rsc.org/images/entities/i_char_e0d2.gif) = 2R⊥,
= 2R⊥, 
 and ôi the orientation unit vector of particle i. R‖ and R⊥ are the parallel and the orthogonal radius of the ellipsoid. Using eqn (16) we can rewrite eqn (15) and obtain
 | (17) |
![[F with combining tilde]](https://www.rsc.org/images/entities/b_char_0046_0303.gif) is a dimensionless function taking the specific form of the force into account and in this example it is
is a dimensionless function taking the specific form of the force into account and in this example it is 
The lubrication force (including the correction) has already reduced the probability that the particles come closely together and overlap. For the few cases where the particles still would overlap we introduce the direct potential between the particles which is assumed to be a hard core potential. To approximate the hard core potential we use the Hertz potential46 which has the following shape for two identical spheres with radius R:
| ϕH = KH(2R − r)5/2 for r < 2R. | (18) |
 | (19) |
![[small phi, Greek, tilde]](https://www.rsc.org/images/entities/i_char_e0e2.gif) H is a dimensionless function taking the specific form of the potential into account and in this example it is
H is a dimensionless function taking the specific form of the potential into account and in this example it is ![[small phi, Greek, tilde]](https://www.rsc.org/images/entities/i_char_e0e2.gif) H(x) = (1 − x)5/2.
H(x) = (1 − x)5/2.
The Shan–Chen forces also act between a node in the outer shell of a particle and its neighboring node outside of the particle. This would lead to an increase of the fluid density around the particle. Therefore, the nodes in the outer shell of the particle are filled with a virtual fluid corresponding to the average of the value in the neighboring free nodes for each fluid component: ρcvirt(x, t) = ![[small rho, Greek, macron]](https://www.rsc.org/images/entities/i_char_e0d1.gif) c(x, t). This can be used to control the wettability properties of the particle surface for the special case of two fluid species which will be named red and blue. We define the parameter Δρ and call it particle color. For positive values of Δρ we add it to the red fluid component:
c(x, t). This can be used to control the wettability properties of the particle surface for the special case of two fluid species which will be named red and blue. We define the parameter Δρ and call it particle color. For positive values of Δρ we add it to the red fluid component:
ρrvirt = ![[small rho, Greek, macron]](https://www.rsc.org/images/entities/i_char_e0d1.gif) r + Δρ. r + Δρ. | (20) |
For negative values we add its absolute value to the blue component:
ρbvirt = ![[small rho, Greek, macron]](https://www.rsc.org/images/entities/i_char_e0d1.gif) b + |Δρ|. b + |Δρ|. | (21) |
In ref. 8 it is shown that there is a linear relationship between Δρ and the three-phase contact angle θ.
III. Emulsions
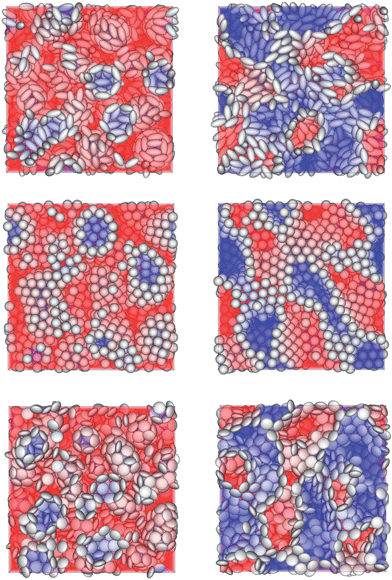
In this section the different types of particle stabilized emulsions and the effect of the particle shape on some of their properties are discussed. We find two different types of emulsions in our simulations, namely the Pickering emulsion (Fig. 1, left) and the bijel (Fig. 1, right). The choice of parameters (such as particle contact angle, particle concentration, fluid–fluid ratio, particle aspect ratio) determines the type of emulsions. Parameter studies for emulsions have been discussed in ref. 9 and 8 for spherical and ellipsoidal particles, respectively. In the current publication we limit ourselves to anisotropy effects on the time dependence of the emulsion formation. We use the following particle shapes (m = R‖/R⊥ is the particle aspect ratio, R‖ and R⊥ are the parallel and orthogonal radius of the particles, respectively): prolate ellipsoids (m = 2; Fig. 1, top), spheres (m = 1; Fig. 1, center) and oblate ellipsoids (m = 1/2; Fig. 1, bottom). For m = 1/2 we choose R‖ = 5Δx and R⊥ = 10Δx. For the other values of m the radii R‖ and R⊥ are chosen as such that the particle volume is kept constant, resulting in R‖ ≈ 12.6Δx and R⊥ ≈ 6.3Δx for m = 2 as well as R‖ = R⊥ ≈ 7.9Δx for spheres. The interaction parameter between the red and blue fluids (see eqn (6)) is chosen as gbr = 0.08 which corresponds to a fluid–fluid interfacial tension of σ = 0.0138. The particles are neutrally wetting (contact angle θ = 90°) and the particle volume concentration is chosen as C = 0.24. The simulated systems of volume VS = LS3 have periodic boundary conditions in all three directions and a side length of LS = 256Δx. Initially, the particles are distributed randomly. At each lattice node a random value for each fluid component is chosen so that the designed fluid–fluid ratio is maintained (1![[thin space (1/6-em)]](https://www.rsc.org/images/entities/char_2009.gif) :
:![[thin space (1/6-em)]](https://www.rsc.org/images/entities/char_2009.gif) 1 for the bijels and 5
1 for the bijels and 5![[thin space (1/6-em)]](https://www.rsc.org/images/entities/char_2009.gif) :
:![[thin space (1/6-em)]](https://www.rsc.org/images/entities/char_2009.gif) 2 for the Pickering emulsions). When the simulation evolves with time, the fluids separate and droplets/domains with a majority of red or blue fluid form.
2 for the Pickering emulsions). When the simulation evolves with time, the fluids separate and droplets/domains with a majority of red or blue fluid form.
The average size of droplets/domains L(t) can be determined by measuring
 | (22) |
 | (23) |
 is the second-order moment of the three-dimensional structure function ς(k, t) = (1/ςn)|φ′k(t)|. φ′ =
 ![[small variant phi, Greek, tilde]](https://www.rsc.org/images/entities/i_char_e12c.gif) − 〈
− 〈![[small variant phi, Greek, tilde]](https://www.rsc.org/images/entities/i_char_e12c.gif) 〉 is the fluctuation of
〉 is the fluctuation of ![[small variant phi, Greek, tilde]](https://www.rsc.org/images/entities/i_char_e12c.gif) which is the Fourier transform of the order parameter field φ = ρr − ρb. In this publication, the time is given in simulation timesteps, which can be converted to physical units. We use eqn (4) and (5) to relate the kinematic viscosity to Δx and Δt. By assuming ν = 10−6 m2 s−1, the kinematic viscosity for water, R = 125 nm and R = 7.9Δx (this is the value used for the spherical particle, see above) we fix the chosen resolution of the simulation. Thus, we obtain Δx = 15.8 nm and Δt = 4.2 × 10⁻¹¹ s and a total system size of LS ≈ 4 μm. The interfacial tension is then σ = 3.14 × 10⁻⁸ N m−1. Larger system sizes can be reached with the same computational effort by compromising on the resolution.
which is the Fourier transform of the order parameter field φ = ρr − ρb. In this publication, the time is given in simulation timesteps, which can be converted to physical units. We use eqn (4) and (5) to relate the kinematic viscosity to Δx and Δt. By assuming ν = 10−6 m2 s−1, the kinematic viscosity for water, R = 125 nm and R = 7.9Δx (this is the value used for the spherical particle, see above) we fix the chosen resolution of the simulation. Thus, we obtain Δx = 15.8 nm and Δt = 4.2 × 10⁻¹¹ s and a total system size of LS ≈ 4 μm. The interfacial tension is then σ = 3.14 × 10⁻⁸ N m−1. Larger system sizes can be reached with the same computational effort by compromising on the resolution.
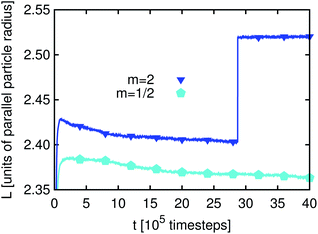
The time development of L(t) for the three different particle types, prolate, spherical and oblate (m = 2, 1 and 1/2), and for Pickering emulsions and bijels is shown in Fig. 2. We can identify three regimes: in the first few hundred timesteps the initial formation of the droplets/domains starts. Then, the growth of droplets/domains is being driven by Ostwald ripening. At even later times, droplets/domains grow due to coalescence. When two droplets unify, the area coverage fraction of the particles at the interface is increased because the surface area of the new droplet is smaller than that of the two smaller droplets before. At some point the area coverage fraction of the particles is sufficiently high to prevent further coalescence. The state which is reached at that time is (at least kinetically) stabilized and one obtains a stable emulsion. The values for L(t) are larger for bijels than for Pickering emulsions. This can be explained by the way we calculate L(t) (see eqn (22) and related text) using a Fourier transformation of the order parameter field.
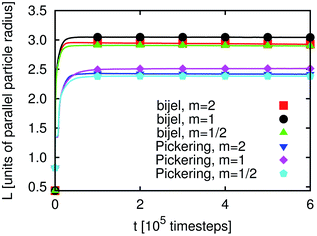 | ||
| Fig. 2 Pickering emulsion and bijel: time development of the average domain size L(t) (see eqn (22)) for m = 1 and m = 2. At the first view, a steady state is reached after about 105 timesteps. L(t) is larger for bijels than for Pickering emulsions, which is due to the measurement being based on the Fourier transform of the order parameter. Ellipsoids are able to stabilize larger interface areas than spheres leading to smaller L(t). | ||
It can clearly be seen that anisotropic particles are more efficient in interface stabilization than spheres since they can cover larger interfacial areas leading to smaller fluid domains (note that the simulation volume is kept constant). However, the difference in L(t) for m = 2 and m = 1/2 is small. This can be understood as follows: if a neutrally wetting prolate ellipsoid is adsorbed at a flat interface, it occupies an area AP,F(m > 1) = m1/3Ap,s, where Ap,s is the occupied interface area for a sphere with the same volume. This corresponds in the case of m = 2 to the occupied interface being larger by a factor of 1.26 as compared to spheres. For an oblate ellipsoid the occupied interface area is AP,F(m < 1) = m−2/3Ap,s which for m = 1/2 is by a factor of 1.59 larger than the area occupied by spheres. Since in emulsions the interfaces are generally not flat, these formulae can only provide a qualitative explanation of the behavior of L(t): if the interface curvature is not neglectable anymore, we lose some of the efficiency of interface stabilization, which is more pronounced for m < 1. This explains why the value of L(t) for m = 1/2 is only slightly smaller than for m = 2.
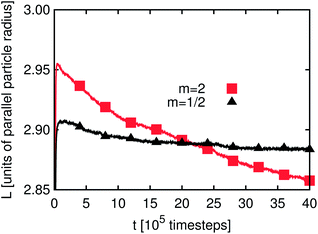
It seems that L(t) reaches a steady state after some 105 timesteps for both types of emulsions and for all three values of m. However, if one zooms in one can observe that L(t) develops for a longer time period if the particles have a non-spherical shape. As will be demonstrated below, the reason for this phenomenon is the additional rotational degrees of freedom due to the particle anisotropy. Furthermore, the time development of L(t) for emulsions stabilized by prolate particles requires more time than that for the oblate ones. If a particle changes its orientation as compared to the interface or a neighboring particle this generally changes the interface shape. In this way the domain sizes are influenced, leading to changes of L(t) – an effect which is not observed for m = 1. Fig. 3 and 4 depict a zoom-in of the time development of L(t) for Pickering emulsions and bijels with m = 2 and m = 1/2, respectively. One observes that L(t) decays in all four cases. The kink in Fig. 3 after about 2.8 million timesteps is due to the coalescence of two droplets of the Pickering emulsion. A substantial difference is the range of the decay. It is larger for the bijel since it consists of a single large interface whereas the Pickering emulsion consists of many small interfaces. The large interface in the bijel is much more deformable. This explains the larger range of the decay of L(t) for the bijel. The fluctuations are of the same order for Pickering emulsions and bijels. Furthermore, the range of the decay is larger for m = 2 than for m = 1/2. The time of reordering is much shorter for m = 1/2 as compared to m = 2. These effects can be explained by the presence of additional rotational degrees of freedom for the anisotropic particles. While oblate particles have only a single additional rotational degree of freedom as compared to spheres, prolate particles show an even more complex behavior due to their second additional rotational degree of freedom.
In this section we demonstrated that particle anisotropy causes additional timescales to influence the growth of domains in particle-stabilized emulsions. In the following sections we discuss model systems in order to obtain a deeper understanding of this effect. We will restrict ourselves to prolate particles with m = 2. Furthermore, the high resolution of the particles in the current section was only chosen to be able to sufficiently resolve the oblate objects. In order to reduce the required computational resources, we use smaller particles in the model systems studied below (R‖ = 8Δx and R⊥ = 4Δx). It has been checked carefully that the reduced particle size does not have a qualitative impact on the results.
IV. Single particle adsorption
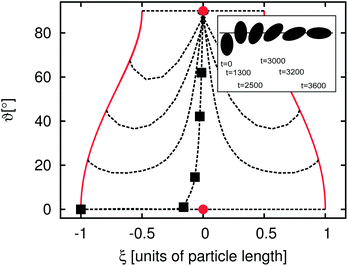
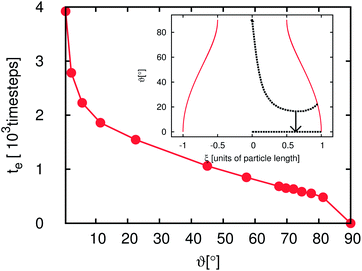
In the previous section we demonstrated that there is an additional time development of the average domain size L for emulsions stabilized by anisotropic particles. In the following sections we relate this behavior to the orientational degree of freedom of the particles at the interface. To obtain a more basic understanding of the additional timescales some simple model systems are discussed. The simplest possible example is the adsorption of a single particle at a flat fluid–fluid interface. To characterize the particle orientation we introduce the angles ϑ and ϕ. ϑ is the angle between the particle main axis and the y-axis, where the y-axis is oriented perpendicular to the flat fluid–fluid interface. ϕ is the angle between the particle main axis and the x-axis, where the x-axis is orientated parallel to the interface. ξ is the distance between the particle center and the undeformed interface in units of the long particle axis. In this section we consider the case of neutral wetting (θ = 90°) and restrict ourselves to an aspect ratio of m = R‖/R⊥ = 2. The fluid–fluid interaction parameter is set to gbr = 0.1, corresponding to an interfacial tension of σ ≈ 0.041. We use a cubic system with 64 lattice nodes in each direction. A wall is placed at the top and bottom in the y-direction. Periodic boundary conditions are applied in the x- and z-directions. In order to obtain a flat interface the system is filled with two equally sized cuboid shaped lamellae with an interface orthogonal to the y-axis. The lamellae are mainly filled with red and blue fluid, respectively. The initial majority and minority species are set to ρmaj = 0.7 and ρmin = 0.04.For this study a particle is placed so that it just touches the (undeformed) fluid–fluid interface. This is done for different initial orientations of the particle. The inset of Fig. 5 shows snapshots of a typical adsorption process. In the beginning the particle is oriented almost orthogonally to the interface. In the first ca. 2000 timesteps the particle moves towards the interface without changing its orientation considerably. Then, the particle rotates and reaches its final orientation after 3600 timesteps. The outer plot of Fig. 5 shows a ϑ–ξ diagram of the adsorption. The points where the particle just touches the flat interface for the different orientations are marked with solid lines. The dotted lines indicate the adsorption trajectories. Each black square is related to one of the snapshots in the inset of Fig. 5. Almost all dashed lines end in the upper circle which corresponds to the equilibrium point where the free energy function has a global minimum. Just the cases with an initial value of ϑ(t = 0) = 0° end at the metastable point at ϑ = 0° as shown by the circle at the bottom of Fig. 5. This metastable point might not be found in experiments: on the one hand fluctuations will cause a rotation of the particle towards the stable points and on the other hand, it is impossible to place the particle exactly at ϑ = 0°.
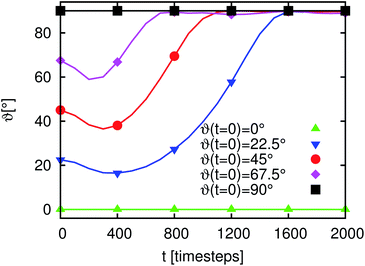
Fig. 6 and 7 depict the dynamics of the particle adsorption and the influence of the initial particle orientation ϑ with respect to the flat interface. Fig. 6 shows the time development of ϑ for different values of ϑ(t = 0). For ϑ(t = 0) = 0° and ϑ(t = 0) = 90° (upper and lower lines) the orientation remains unchanged and the adsorption at the interface causes only a translational particle movement. The lines for the three other simulation runs start at ϑ(t = 0) = 22.5°, ϑ(t = 0) = 45° and ϑ(t = 0) = 67.5°. All of them go in the ‘wrong’ direction during the first few 102 timesteps and end at ϑ = 90° corresponding to the stable point, but the time needed for reaching this value differs. Furthermore, in all cases during the first timesteps, ϑ decreases but then it increases up to this final value. The time te the particle needs to reach the final orientation of ϑ = 90° depending on ϑ(t = 0) is shown in the outer plot of Fig. 7. Due to the discretization of the particle on the lattice, its orientation shows small deviations from the theoretical final value. Therefore, we measure te as the time when the angle reaches 98% of the theoretical final angle. The particle oscillates around this final value but these oscillations are very small and their magnitude falls below the threshold for the measurement of te. te increases with decreasing ϑ and diverges for ϑ → 0. This divergence can be understood using the inset of Fig. 7. If the starting angle ϑ(t = 0) comes closer to ϑ = 0° (corresponding to the metastable case where the particle never flips) the capillary forces causing the particle rotation become smaller and vanish. We have seen that anisotropy of particles causes additional timescales in the development of the domain sizes in the emulsions, because of orientational ordering. This timescale is of the order of 106 LB timesteps. In this section we have shown that the adsorption of a single particle at an interface and its orientational ordering takes of the order of 103 timesteps and depends on the initial particle orientation towards the interface. We can identify one extra timescale where the particles rotate towards the interface. This timescale plays a role in the beginning of the emulsion formation (during droplet formation and droplet growth) when the particles come in contact with the interfaces. However, this timescale does not yet explain the full time development. We require additional model systems to obtain a full understanding of the additional timescales. Thus, we consider many particles at a flat interface as well as at a single droplet in the following sections.
V. Particle ensembles at a flat interface
After having studied the adsorption of a single particle we discuss the behavior of a many-particle ensemble at a flat interface. What is the influence of the hydrodynamic interaction between many particles on the timescales involved in emulsion formation? For the case of the single-particle adsorption the particle orientation towards the interface (ϑ) is an important parameter. For prolate particles, also the mutual orientation (ϕ) of the particles is important and one has an additional degree of freedom leading to particle orientational ordering. To characterize the ordering of the particles we use two order parameters and two correlation functions.Measures for global ordering effects of the particles are the orientational order parameters S and Q. We define the uniaxial order parameter S (ref. 47 and 48) as
 | (24) |
The biaxial order parameter Q (ref. 48) is defined as
 | (25) |
The parameter Q is a measure for the mutual orientation of the particles oriented parallel to the interface. If all particles lying parallel to the interface are oriented in the same direction it is Q = Qaniso = 1.5. Q = Qiso = 0 means that the particles oriented parallel to the interface have a two-dimensional isotropic ordering.
The local ordering effects are investigated by using two correlation functions. The discretized form of the pair correlation function g(r) is defined as
 | (26) |
 | (27) |
 AP(ξ, ϑ) is the area which the particle would occupy at a hypothetical flat interface and depends on the distance between the particle center and the undeformed interface and the particle orientation relative to the flat interface. ξ is the distance between particle center and undeformed interface. In the following we relate the coverage fraction to the case of ξ = 0 and ϑ = 90°(χI) or ϑ = 90°(χF) corresponding to the initial state and the equilibrium state for θ = 90° (see previous section). This leads to
  and
and  with AP,I = πR⊥2 and AP,F = πR‖R⊥.
Initially, the particles are oriented almost orthogonally to the interface (see top right of Fig. 8). The initial value for the polar angle is chosen as ϑ ≈ 0.6° for all particles, whereas ϕ and the particle positions are chosen randomly. Analogously to the case of the single-particle adsorption the particle flips to an orientation parallel to the interface (see Fig. 9). Fig. 10(a) shows the time development of S for different values of χI (χI ≈ 0.08 (squares), χI ≈ 0.38 (circles), χI ≈ 0.46 (upward pointing triangles) and χI ≈ 0.52 (downward pointing triangles)) and the time development of Q for χI ≈ 0.38 (diamonds). The parameter Q starts at 0 and ends at a small value (Qfinal ≈ 0.05 ≪ Qaniso) far away from the value of total ordering. A similar behavior is found for all values of χI. Fig. 9 shows that there are smaller domains where particles are oriented in the same direction. But every domain has a different preferred particle direction which might lead to small but still finite values of Q. Another reason for this effect is the finite system size and the finite particle number which change the parameter as follows:49
 | (28) |
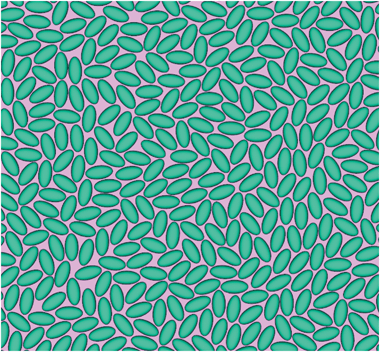 | ||
| Fig. 9 Zoomed snapshot after 104 timesteps of the state where the particles are flipped (related to the top left in Fig. 8). | ||
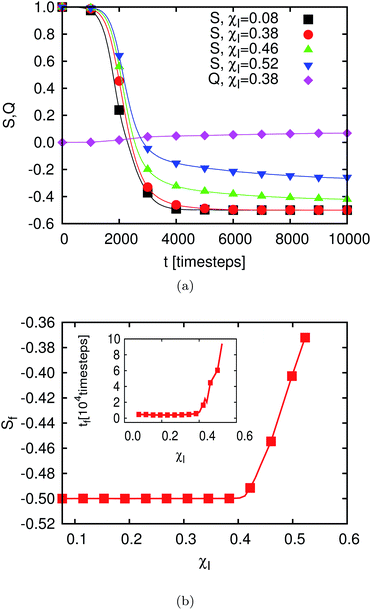 | ||
| Fig. 10 (a) Time development of the two order parameters S(t) and Q(t) (see eqn (24) and (25)) for m = 2, θ = 90°, σ ≈ 0.041. Q(t) is shown for a single value of χI only since it stays at a value of approximately 0 for all χI. S(t) is shown for different values of χI. In the case of highly packed interfaces, i.e. for large values of χI, not all particles are able to fully align with the interface. For larger values of χIS needs a longer time to get into the equilibrium than shown here. (b) Outer plot: the final values of the order parameter S are plotted for different particle densities χI. As shown in (a) transition from a fully ordered to a disordered state can be found at a critical value of χI,C ≈ 0.42. Inset: the time the order parameter S (defined in eqn (24)) requires to reach the final value (time which particles need to flip). For small values of χI, tf is independent of χI but above a critical value of χI = χI,C, tf increases with increasing χ by almost one order of magnitude. | ||
The parameter S starts for all values of χI with a value of S⊥ = 1, corresponding to the initial configuration. For lower values of χI the parameter S reaches S‖ = −0.5, corresponding to the case that the particles flip completely. For higher values of χI the final value of the parameter is Sfinal > S‖ = −0.5. This corresponds to the case where some particles cannot flip completely to the equilibrium orientation because there is insufficient space. The final values of S (obtained after 105 timesteps) are shown in the outer plot of Fig. 10(b) as a function of χI. We find a transition point at χI,C ≈ 0.42 corresponding to χF,C ≈ 0.84. If all particles are oriented parallel to the interface the system corresponds practically to a two dimensional system of ellipses. However, the value of χI,C found is below the value of the closest packing density for a two-dimensional system of ellipses with m = 2, which is χF,max ≈ 0.91. Such a system was also studied in ref. 49 with Monte Carlo simulations. For the case of an ellipse with an aspect ratio m2d = 2, a transition point of χ2dmc ≈ 0.78 from isotropy to a solid phase was found. The solid phase describes a state where the particle centers as well as the orientations are ordered. We do not reach the limit of the solid phase. This suggests that hydrodynamic interactions and absence of confinement in the third dimension still play a dominant role. The biaxial order parameter in the MC system grows up to Q ≈ 1 (see Fig. 11 in ref. 49) corresponding to a global anisotropic state with a quite high degree of ordering for χF > χ2dmc. This effect is not observed in our system. The reason for this difference is the method used to reach this state. A two-dimensional system of ellipses was studied in ref. 49 whereas we simulated three-dimensional ellipsoids which form an effective two-dimensional system by flipping to the interface.
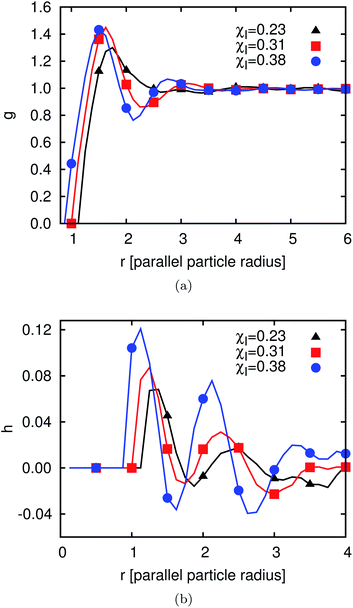 | ||
| Fig. 11 (a) Pair correlation function g(r) (defined in eqn (26)) and (b) orientation correlation function h(r) (defined in eqn (27)). In both cases the ordering increases with increasing χI. | ||
We can see that in the many-particle system and for small and moderate χI about 103 timesteps are required for the particles to flip which is the same order of magnitude as in the case of the single particle adsorption for small values of χI. The inset in Fig. 10(b) shows the time the order parameter S needs to reach its final value. This corresponds to the time required for the whole particle ensemble to be flipped completely (χI < χc) or to reach the semi-flipped state for χI > χc. For χI < 0.38 tf stays almost constant at about 4500 timesteps. Here, tf is the time where S reached 98% of its final value. In this regime the distance between the particles is sufficient so that the influence of hydrodynamic interactions on the flipping behavior can be neglected. For higher values it increases very sharply and hydrodynamic interactions between the particles must not be neglected anymore. Furthermore, the time needed to flip completely for the very dense systems (jammed state) is about one order of magnitude larger.
The biaxial order parameter does not show any global ordering but the snapshot in Fig. 9 shows some local ordering effects. Hence, we need other ways to characterize the local ordering effects and utilize the two local correlation functions g(r) and h(r) defined above. The particles have a contact angle of 90°, so there are no capillary interactions between them in the final state when all of them have flipped completely and the system has reached equilibrium. However, there are dipolar interface deformations and thus the interactions during the flipping process of the particles and for χ > χc which causes capillary interactions at this time. After flipping there are still some capillary waves going through the system, leading to interactions between the particles. The pair correlation function g(r) is shown in Fig. 11(a) for three different values of χI (χI ≈ 0.23, χI ≈ 0.31 and χI ≈ 0.38) after 105 timesteps. The first peak is pronounced in all three cases. The distance r of this peak decreases for increasing χI as well as the degree of ordering. For the highest χI a depletion region leading to a minimum after the peak is pronounced. To obtain a measure of the local orientational ordering effects we investigate the orientational correlation function h(r) as shown in Fig. 11(b) for the same 3 values of χI. The first two positive peaks and the first negative peak can be explained with the drawings in the bottom of Fig. 8. The first positive peak is due to a side-to-side alignment of two particles. Fig. 9 shows several domains of side-to-side alignment. The first negative peak comes from an alignment where the particles are oriented perpendicular to each other and the second positive peak comes from a tip-to-tip alignment or second nearest neighbors of the side-to-side orientation. The degree of translational and orientational ordering increases with increasing χI.
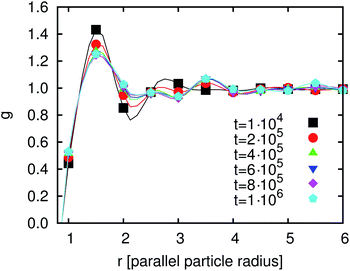
After having discussed the correlation functions we investigate the time development of g(r) in order to understand the time development of the average domain size L(t). Fig. 12 shows g(r) at different times between 104 and 106 timesteps. The first peak decreases but at later times the following peaks are more pronounced. Thus, the degree of ordering increases. After 4 × 10⁵ timesteps this development has almost come to an end. The reason for this remaining development is the particle reordering. The particles form domains where they align parallel to each other. These domains become larger with time.
In this section we have shown that the presence of many particles at an interface leads to two additional timescales in the reordering. The first one is the rotation of the particle towards the interface. The particle rotates towards its final orientation parallel to the interface. For lower values of χI this process does not depend on χI and is not different from the single particle adsorption. For larger values of χI the time needed to come to its final orientation increases. Hydrodynamics as well as excluded volume effects become more important. Above a critical value not every particle reaches its ‘final’ orientation. The reordering of h (corresponding to g in Fig. 12) can also be observed. The first 2 peaks get more pronounced after several 105 timesteps as compared to the state after 104 timesteps shown in Fig. 11(b).
VI. Particle ensembles at a spherical interface
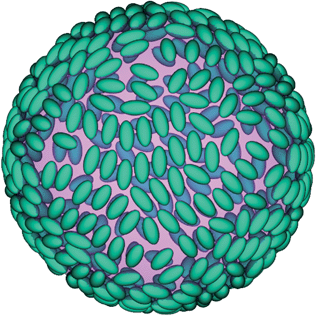
In the previous chapter the behavior of particle ensembles at a flat interface was discussed. However, in emulsions the interfaces are generally not flat. Pickering emulsions usually have (approximately) spherical droplets and a bijel has an even more complicated structure of the curved interface. The simplest realization of a curved interface is a single droplet and as such this is studied in this section.The simulated system is periodic and each period has a size of LS = 256 lattice units. The droplet radius and the number of adsorbed particles are chosen to be RD = 0.6LS ≈ 76.8 and 600, respectively. In the beginning of the simulation the particles are placed orthogonal to the local interface tangential plane. As we have seen already for the case of flat interfaces the particles flip to an orientation parallel to this tangential plane. This state is shown in Fig. 13 after 2 × 10⁵ timesteps. A preliminary comparison between flat and spherical interfaces has already been given in our previous contribution.39 The time development of S is shown in Fig. 11(a) in ref. 39. It has been found that the influence of the interface curvature on the flipping process is larger than the influence of the particle coverage. The time needed for the particles to flip is about a factor two smaller in the case of the curved interface.
Here, we investigate the particle correlation function (see eqn (26)) for the particle ensemble. Fig. 14 shows g for χI ≈ 0.27 at three different times. After 104 timesteps it is still close to the correlation function of the initial condition. After 105 timesteps some changes can be seen. The first peak is reduced but the second peak is more pronounced. There is no substantial change between 1 × 10⁵ and 2 × 10⁵ timesteps. Compared to the state at 105 timesteps the correlation function shows pronounced peaks at longer distances from the particle (about 6Rp). The particles mostly reorder during the first 105 timesteps since at later times only minor changes in the particle order can be observed. Similar to the case of flat interfaces that was discussed in the previous section, the particle ensemble forms domains where the particles are ordered in a nematic fashion. The peaks in the correlation function are more pronounced in the case of droplets than in the case of a flat interface. The reason is given by the capillary interactions between the particles which are much stronger in the case of curved interfaces. In particular, non-zero capillary interactions persist between spheroids even in the case of neutrally wetting particles.
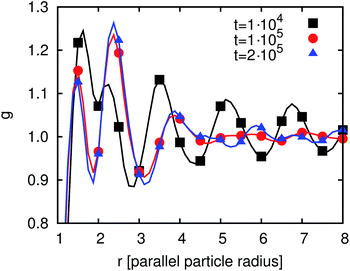 | ||
| Fig. 14 Time development of the order parameter g(r) for particles adsorbed at a spherical interface. | ||
The time development of g at the droplet as discussed in this section differs from the behavior in the case of a flat interface. For the droplet, g arrives at its final structure after about 105 timesteps whereas at the flat interface about four times as many steps are required. In addition, for flat interfaces, g only shows one or two peaks (depending on χI), while for the particle covered droplet five peaks are found due to a larger range of ordering of the particles. This is a result of the stronger capillary interactions between the particles due to the interface curvature.
We can understand one of the additional timescales with the behavior of the ellipsoidal particles at a single droplet. The particles reorder and it can be shown that this leads to a small change of the shape of the droplet which is (almost) exactly spherical in the beginning.50 A change of the interface shape caused by reordering of anisotropic particles leads to a change of L(t). The reordering of particle ensembles at flat as well as spherical interfaces takes of the order of 105 timesteps. This reordering takes place in idealized systems with constant interfaces which do not change their shape considerably. In real emulsions, however, the interface geometry changes substantially during their formation. For example, two droplets of a Pickering emulsion can coalesce. After this unification the particle ordering starts anew. This explains the fact that the additional timescale we find in our emulsions is of the order of several 106 timesteps.
VII. Conclusion
In this article we have investigated the dynamics of the formation of Pickering emulsions and bijels stabilized by ellipsoidal particles. In contrast to emulsions stabilized by spherical particles, spheroids cause the average time dependent droplet or domain size to slowly decrease even after very long simulation times corresponding to several million simulation timesteps. The additional timescales related to this effect have been investigated by detailed studies of simple model systems. At first, the adsorption of single ellipsoidal particles was shown to happen on a comparably short timescale (≈104 timesteps). Second, many particle ensembles at flat interfaces, however, might require substantially more time in the case of sufficiently densely packed interfaces. Here, local reordering effects induced by hydrodynamic interactions and interface rearrangements prevent the system from attaining a steady state and add a further timescale to the emulsion formation (≈105 timesteps). Third, this reordering is pronounced in the case of curved interfaces, where the movement of the particles leads to interface deformations and capillary interactions. During the formation of an emulsion, droplets might coalesce (Pickering emulsions) or domains might merge (bijels). After such an event the particles at the interface have to rearrange in order to adhere to the new interface structure. Due to this, the local reordering is practically being “restarted” leading to an overall increase of the interfacial area on a timescale of at least several 106 timesteps. With the nanoscale resolution chosen above, this corresponds to physical times of the order of 10−5 s.Our findings provide relevant insight into the dynamics of emulsion formation which is generally difficult to investigate experimentally due to the required high temporal resolution of the measurement method and limited optical transparency of the experimental system. It is well known that in general particle-stabilized emulsions are not thermodynamically stable and therefore the involved fluids will always phase separate – even if this might take several months. Anisotropic particles, however, provide properties which might allow the generation of emulsions that are stable on substantially longer timescales. This is due to the continuous reordering of the particles at liquid interfaces which leads to an increase in the interfacial area and as such counteracts the thermodynamically driven reduction of the interface area.
Acknowledgements
Financial support is greatly acknowledged from NWO/STW (Vidi grant 10787 of J. Harting) and FOM/Shell IPP (09iPOG14 – “Detection and guidance of nanoparticles for enhanced oil recovery”). We thank the Jülich Supercomputing Centre, SARA Amsterdam, and HLRS Stuttgart for computing resources. J. de Graaf, M. Dijkstra, and R. van Roij are kindly acknowledged for fruitful discussions.References
- E. Dickinson, Food emulsions and foams: stabilization by particles, Curr. Opin. Colloid Interface Sci., 2010, 15(1–2), 40–49 CrossRef CAS PubMed.
- H. Fan and A. Striolo, Mechanistic study of droplets coalescence in Pickering emulsions, Soft Matter, 2012, 8, 9533–9538 RSC.
- S. Frijters, F. Günther and J. Harting, Effects of nanoparticles and surfactant on droplets in shear flow, Soft Matter, 2012, 8(24), 6542–6556 RSC.
- S. U. Pickering, Emulsions, J. Chem. Soc., Trans., 1907, 91, 2001–2021 RSC.
- W. Ramsden, Separation of solids in the surface-layers of solutions and ‘suspensions’, Proc. R. Soc. London, 1903, 72, 156–164 CrossRef CAS.
- K. Stratford, R. Adhikari, I. Pagonabarraga, J.-C. Desplat and M. E. Cates, Colloidal jamming at interfaces: a route to fluid-bicontinuous gels, Science, 2005, 309, 2198 CrossRef CAS PubMed.
- E. M. Herzig, K. A. White, A. B. Schofield, W. C. K. Poon and P. S. Clegg, Bicontinuous emulsions stabilized solely by colloidal particles, Nat. Mater., 2007, 6, 966 CrossRef CAS PubMed.
- F. Günther, F. Janoschek, S. Frijters and J. Harting, Lattice Boltzmann simulations of anisotropic particles at liquid interfaces, Comput. Fluids, 2012, 80, 184 CrossRef PubMed.
- F. Jansen and J. Harting, From bijels to Pickering emulsions: a lattice Boltzmann study, Phys. Rev. E: Stat., Nonlinear, Soft Matter Phys., 2011, 83, 046707 CrossRef.
- Y. He and X. Yu, Preparation of silica nanoparticle-armored polyaniline microspheres in a Pickering emulsion, Mater. Lett., 2007, 61(10), 2071–2074 CrossRef CAS PubMed.
- R. Aveyard, B. P. Binks and J. H. Clint, Emulsions stabilized solely by colloidal particles, Adv. Colloid Interface Sci., 2003, 100–102, 503–546 CrossRef CAS.
- I. Kalashnikova, H. Bizot, P. Bertoncini, B. Cathala and I. Capron, Cellulosic nanorods of various aspect ratios for oil in water Pickering emulsions, Soft Matter, 2013, 9, 952–959 RSC.
- E. Kim, K. Stratford and M. E. Cates, Bijels containing magnetic particles: a simulation study, Langmuir, 2010, 26(11), 7928–7936 CrossRef CAS PubMed.
- S. Melle, M. Lask and G. G. Fuller, Pickering emulsions with controllable stability, Langmuir, 2005, 21(6), 2158–2162 CrossRef CAS PubMed.
- B. P. Binks and P. D. I. Fletcher, Particles adsorbed at the oil-water interface: a theoretical comparison between spheres of uniform wettability and “Janus” particles, Langmuir, 2001, 17, 4708 CrossRef CAS.
- B. Madivala, S. Vandebril, J. Fransaer and J. Vermant, Exploiting particle shape in solid stabilized emulsions, Soft Matter, 2009, 5, 1717–1727 RSC.
- J. de Graaf, M. Dijkstra and R. van Roij, Adsorption trajectories and free-energy separatrices for colloidal particles in contact with a liquid-liquid interface, J. Chem. Phys., 2010, 132(16), 164902 CrossRef PubMed.
- L. Dong and D. T. Johnson, Adsorption of acircular particles at liquid-fluid interfaces and the influence of the line tension, Langmuir, 2005, 21, 3838–3849 CrossRef CAS PubMed.
- F. Bresme and M. Oettel, Nanoparticles at fluid interfaces, J. Phys.: Condens. Matter, 2007, 19(41), 413101 CrossRef.
- J. Faraudo and F. Bresme, Stability of particles adsorbed at liquid/fluid interfaces: shape effects induced by line tension, J. Chem. Phys., 2003, 18, 6518 CrossRef PubMed.
- A. R. Morgan, N. Ballard, L. A. Rochford, G. Nurumbetov, T. S. Skelhon and S. A. F. Bon, Understanding the multiple orientations of isolated superellipsoidal hematite particles at the oil-water interface, Soft Matter, 2013, 9, 487–491 RSC.
- H. Lehle, E. Noruzifar and M. Oettel, Ellipsoidal particles at fluid interfaces, Eur. Phys. J. E: Soft Matter Biol. Phys., 2008, 26, 151–160 CrossRef CAS PubMed.
- J. Bleibel, S. Dietrich, A. Domínguez and M. Oettel, Shock waves in capillary collapse of colloids: a model system for two-dimensional screened Newtonian gravity, Phys. Rev. Lett., 2011, 107, 128302 CrossRef CAS.
- J. Bleibel, A. Domínguez, F. Günther, J. Harting and M. Oettel, Hydrodynamic interactions induce anomalous diffusion under partial confinement, arXiv, 1305.3715, 2013.
- C. Zeng, F. Brau, B. Davidovitch and A. D. Dinsmore, Capillary interactions among spherical particles at curved liquid interfaces, Soft Matter, 2012, 8, 8582–8594 RSC.
- L. Botto, E. P. Lewandowski, M. Cavallaro and K. J. Stebe, Capillary interactions between anisotropic particles, Soft Matter, 2012, 8, 9957–9971 RSC.
- B. Madivala, J. Fransaer and J. Vermant, Self-assembly and rheology of ellipsoidal particles at interfaces, Langmuir, 2009, 25, 2718 CrossRef CAS PubMed.
- S. Sacanna, W. K. Kegel and A. P. Philipse, Thermodynamically stable Pickering emulsions, Phys. Rev. Lett., 2007, 98, 158301 CrossRef CAS.
- W. K. Kegel and J. Groenewold, Scenario for equilibrium solid-stabilized emulsions, Phys. Rev. E: Stat., Nonlinear, Soft Matter Phys., 2009, 80, 030401 CrossRef.
- R. Aveyard, Can Janus particles give thermodynamically stable Pickering emulsions?, Soft Matter, 2012, 8, 5233–5240 RSC.
- L. L. Dai, S. Tarimala, C. Y. Wu, S. Guttula and J. Wu, The structure and dynamics of microparticles at Pickering emulsion interfaces, Scanning, 2008, 30(2), 87–95 CrossRef CAS PubMed.
- S. Succi, The Lattice Boltzmann Equation for Fluid Dynamics and Beyond, Numerical Mathematics and Scientific Computation, Oxford University Press, Oxford, 2001 Search PubMed.
- P. L. Bhatnagar, E. P. Gross and M. Krook, A model for collision processes in gases. I. Small amplitude processes in charged and neutral one-component systems, Phys. Rev., 1954, 94, 511 CrossRef CAS.
- X. Shan and H. Chen, Lattice Boltzmann model for simulating flows with multiple phases and components, Phys. Rev. E: Stat. Phys., Plasmas, Fluids, Relat. Interdiscip. Top., 1993, 47, 1815 CrossRef.
- E. Orlandini, M. R. Swift and J. M. Yeomans, A lattice Boltzmann model of binary-fluid mixtures, Europhys. Lett., 1995, 32(6), 463 CrossRef CAS.
- M. R. Swift, E. Orlandini, W. R. Osborn and J. M. Yeomans, Lattice Boltzmann simulations of liquid-gas and binary fluid systems, Phys. Rev. E: Stat. Phys., Plasmas, Fluids, Relat. Interdiscip. Top., 1996, 54, 5041–5052 CrossRef CAS.
- S. V. Lishchuk, C. M. Care and I. Halliday, Lattice Boltzmann algorithm for surface tension with greatly reduced microcurrents, Phys. Rev. E: Stat., Nonlinear, Soft Matter Phys., 2003, 67, 036701 CrossRef CAS.
- T. Lee and P. F. Fischer, Eliminating parasitic currents in the lattice Boltzmann equation method for nonideal gases, Phys. Rev. E: Stat., Nonlinear, Soft Matter Phys., 2006, 74, 046709 CrossRef.
- T. Krüger, S. Frijters, F. Günther, B. Kaoui and J. Harting, Numerical simulations of complex fluid-fluid interface dynamics, Eur. Phys. J.: Spec. Top., 2013, 222(1), 177–198 CrossRef.
- C. K. Aidun, Y. Lu and E.-J. Ding, Direct analysis of particulate suspensions with inertia using the discrete Boltzmann equation, J. Fluid Mech., 1998, 373, 287 CrossRef CAS.
- A. J. C. Ladd, Numerical simulations of particulate suspensions via a discretized Boltzmann equation. Part I. Theoretical foundation, J. Fluid Mech., 1994, 271, 285 CrossRef CAS.
- A. J. C. Ladd, Numerical simulations of particulate suspensions via a discretized Boltzmann equation. Part II. Numerical results, J. Fluid Mech., 1994, 271, 311 CrossRef CAS.
- A. J. C. Ladd and R. Verberg, Lattice-Boltzmann simulations of particle-fluid suspensions, J. Stat. Phys., 2001, 104, 1191–1251 CrossRef CAS.
- B. J. Berne and P. Pechukas, Gaussian model potentials for molecular interactions, J. Chem. Phys., 1972, 56, 4213 CrossRef CAS PubMed.
- F. Janoschek, F. Toschi and J. Harting, Simplified particulate model for coarse-grained thermodynamics simulations, Phys. Rev. E: Stat., Nonlinear, Soft Matter Phys., 2010, 82, 056710 CrossRef CAS.
- H. Hertz, Über die Berührung fester elastischer Körper, J. Reine Angew. Math., 1881, 92, 156 Search PubMed.
- S. Kralj, S. Žumer and D. W. Allender, Nematic-isotropic phase transition in a liquid-crystal droplet, Phys. Rev. A: At., Mol., Opt. Phys., 1991, 43, 2943–2952 CrossRef.
- P. J. Collings, B. R. Ratna and R. Shashidhar, Order parameter measurements of dichroic dyes dissolved in smectic liquid crystals that tilt without layer contraction, Phys. Rev. E: Stat., Nonlinear, Soft Matter Phys., 2003, 67, 021705 CrossRef.
- J. A. Cuesta and D. Frenkel, Monte Carlo simulation of two-dimensional hard ellipses, Phys. Rev. A: At., Mol., Opt. Phys., 1990, 42, 2126–2136 CrossRef.
- E. Kim, K. Stratford, R. Adhikari and M. E. Cates, Arrest of fluid demixing by nanoparticles: a computer simulation study, Langmuir, 2008, 24, 6549–6556 CrossRef CAS PubMed.
| This journal is © The Royal Society of Chemistry 2014 |

