 Open Access Article
Dry oil powders and oil foams stabilised by fluorinated clay platelet particles†
Bernard P.
Binks
*a,
Tomoko
Sekine
b and
Andrew T.
Tyowua
a
aSurfactant & Colloid Group, Department of Chemistry, University of Hull, Hull, HU6 7RX, UK. E-mail: b.p.binks@hull.ac.uk
bShiseido Research Center, Shin-Yokohama, 2-2-1 Hayabuchi, Tsuzuki-Ku, Yokohama 224-8558, Japan
First published on 9th December 2013
Abstract
A series of platelet sericite particles coated to different extents with a fluorinating agent has been characterised and their behaviour in mixtures with air and oil studied. The material which forms by vigorous shaking depends on both the surface tension of the oil and the surface energy of the particles which control their degree of wetting. Oil dispersions are formed in liquids of relatively low tension (<22 mN m−1), e.g. hexane and cyclomethicone, for all particles. Particle-stabilised air-in-oil foams form in liquids of higher tension, e.g. dodecane and phenyl silicone, where the advancing three-phase contact angle θ, measured on a planar substrate composed of the particles into the liquid, lies between ca. 65° and 120°. For oils of tension above 27 mN m−1 like squalane and liquid paraffin with particles for which θ > 70°, we have discovered that dry oil powders in which oil drops stabilised by particles dispersed in air (oil-in-air) can be prepared by gentle mixing up to a critical oil![[thin space (1/6-em)]](https://www.rsc.org/images/entities/char_2009.gif) :
:![[thin space (1/6-em)]](https://www.rsc.org/images/entities/char_2009.gif) particle ratio (COPR) and do not leak oil. These powders, containing up to 80 wt% oil, release the encapsulated oil when sheared on a substrate. For many of the systems forming oil powders, stable liquid oil marbles can also be prepared. Above the COPR, catastrophic phase inversion occurs yielding an ultra-stable air-in-oil foam. We thus demonstrate the ability to disperse oil drops or air bubbles coated with particles within novel materials.
particle ratio (COPR) and do not leak oil. These powders, containing up to 80 wt% oil, release the encapsulated oil when sheared on a substrate. For many of the systems forming oil powders, stable liquid oil marbles can also be prepared. Above the COPR, catastrophic phase inversion occurs yielding an ultra-stable air-in-oil foam. We thus demonstrate the ability to disperse oil drops or air bubbles coated with particles within novel materials.
Introduction
Following the pioneering work of Ramsden1 and Pickering2 ultra-stable oil–water emulsions3 and aqueous4,5 and non-aqueous (oil) foams6,7 have been prepared using small solid particles alone. For spherical particles, the extent to which the fluid phases wet the particles, quantified by the contact angle θ (measured through the more polar phase) they make with the fluid–fluid interface, dictates the type of end material. In oil (o)–water (w) systems (equal volumes), relatively hydrophilic particles (θ < 90°) partition more in the water phase and tend to stabilise oil-in-water (o/w) emulsions whilst relatively hydrophobic ones (θ > 90°) partition more in the oil phase and prefer to stabilise water-in-oil (w/o) emulsions.8 In the case of air (a)–water (w) systems, partially hydrophobic (very hydrophobic) particles are necessary for stabilisation of air-in-water (a/w) foams9 (water-in-air (w/a) materials, e.g. liquid marbles).10,11 In non-aqueous systems like oil, preparation of stable air-in-oil (a/o) foams and oil-in-air (o/a) materials (e.g. oil liquid marbles) requires relatively oleophilic (θ < 90°) and oleophobic (θ > 90°) particles, respectively.12 Omniphilic particles have fairly large affinity for both water and oil and would stabilise a/w and a/o systems, whilst omniphobic particles having very little affinity for both water and oil tend to stabilise w/a and o/a systems. Oleophobic and omniphobic surfaces are created from hydrophilic precursors by surface chemical modification using suitable fluorocarbons of low surface energy.13–15 Other properties that also influence the type of final product formed in air–liquid systems include the solid–air interfacial energy or particle surface energy γsa, liquid–air interfacial tension γla and the speed of mixing.16 In air–oil systems, it has been shown that with appropriate agitation, a combination of relatively low tension liquids and relatively high surface energy oleophilic particles yields a particle dispersion, but a combination of liquids of intermediate (high) tension and oleophobic particles of intermediate (low) surface energy gives oil foams (oil liquid marbles).7Liquid marbles, first described by Aussillous and Quéré,10 are now widely studied17–20 and can be considered an element of dry liquid powdered materials, i.e. dry water (if the liquid is water) and dry oil powders (if the liquid is an oil). Dry water21 (dry oil)22 is a free-flowing powder containing numerous water (oil) droplets coated with small solid particles which are poorly wetted by them. The encapsulated liquid may be released by evaporation or on application of mechanical stress. The particles confer stability on the liquid droplets and allow them to move with minimum adhesion to a substrate. This principle is also used by nature, both in the self-cleaning mechanism of various plant leaves23 and in the excretion of honeydew globules from aphids.24 Even though both dry water and dry oil powders have significant potential applications in the cosmetic, pharmaceutical and other related industries, studies on them are few and far between, especially for dry oils. This is partly due to the relatively low surface tension of many oils and partly due to the relatively high surface energy of many colloidal particles. Reports on oil liquid marbles are also limited for the same reason. From thermodynamic considerations,25 this prevents particle adsorption and hence stabilisation of the related materials.7 Papers on dry water include those from Binks and co-workers,21,26,27 Forny et al.28,29 and Carter et al.30,31 Catastrophic phase inversion of particle-stabilised air–water systems, from a/w foams to w/a powders (containing about 98 wt% of water with respect to the total mass) was demonstrated in ref. 21, by either a progressive change in the silica particle hydrophobicity at constant air![[thin space (1/6-em)]](https://www.rsc.org/images/entities/char_2009.gif) :
:![[thin space (1/6-em)]](https://www.rsc.org/images/entities/char_2009.gif) water ratio or by changing the air
water ratio or by changing the air![[thin space (1/6-em)]](https://www.rsc.org/images/entities/char_2009.gif) :
:![[thin space (1/6-em)]](https://www.rsc.org/images/entities/char_2009.gif) water ratio at fixed particle wettability. The change in particle wettability was linked to the first inversion,29 whilst change in the volume fraction of the phase(s) was crucial for inversion in the second case. Dry water has also been used to enhance the kinetics of heterogeneous catalytic hydrogenation30 and to enhance gas uptake rates in gas hydrates.31 On dry oil powders, Murakami and Bismarck22 used agglomerated oligomeric tetrafluoroethylene (OTFE) particles to prepare dry oil powders (containing 10–15 wt% of oil relative to the total mass). The dry oil powders were prepared by spraying oils from a spray gun on particles placed on a Tefal frying pan. A different preparation of dry oil powders employed protein-32 or particle-stabilised33 o/w emulsions as precursors followed by slow or rapid drying. Following this protocol, an oil powder containing about 90 wt% of oil relative to the total mass which showed no sign of oil leakage over several months was prepared. This process however requires high energy and the drying stage is time consuming. A similar procedure which does not require evaporation of the continuous phase has been used to prepare oil-in-water-in-air (o/w/a) materials termed either a powdered emulsion34 or a dry water emulsion.35 To obtain powdered emulsions,34 particle-stabilised o/w emulsions stable to coalescence were aerated with very hydrophobic solid particles using a blender at high shear. The hydrophobic particles coat the newly created water globules in air which encase the oil drops in water. Similarly, o/w emulsions stabilised by branched copolymer surfactant were diluted before aerating in the presence of hydrophobic silica nanoparticles to obtain the dry water emulsion.35 To the best of our knowledge, a systematic study on the preparation of dry oil powders is yet to be reported. In this study, using fluorinated solid particles of varying surface energy and polar oils and n-alkanes of varying surface tension and low shear, we show that dry oil powders containing up to 80 wt% of oil (relative to the total mass) can be prepared by simply hand shaking a mixture of solid particles and oil, and that the dry oil powder may invert to an ultra-stable oil foam at high oil
water ratio at fixed particle wettability. The change in particle wettability was linked to the first inversion,29 whilst change in the volume fraction of the phase(s) was crucial for inversion in the second case. Dry water has also been used to enhance the kinetics of heterogeneous catalytic hydrogenation30 and to enhance gas uptake rates in gas hydrates.31 On dry oil powders, Murakami and Bismarck22 used agglomerated oligomeric tetrafluoroethylene (OTFE) particles to prepare dry oil powders (containing 10–15 wt% of oil relative to the total mass). The dry oil powders were prepared by spraying oils from a spray gun on particles placed on a Tefal frying pan. A different preparation of dry oil powders employed protein-32 or particle-stabilised33 o/w emulsions as precursors followed by slow or rapid drying. Following this protocol, an oil powder containing about 90 wt% of oil relative to the total mass which showed no sign of oil leakage over several months was prepared. This process however requires high energy and the drying stage is time consuming. A similar procedure which does not require evaporation of the continuous phase has been used to prepare oil-in-water-in-air (o/w/a) materials termed either a powdered emulsion34 or a dry water emulsion.35 To obtain powdered emulsions,34 particle-stabilised o/w emulsions stable to coalescence were aerated with very hydrophobic solid particles using a blender at high shear. The hydrophobic particles coat the newly created water globules in air which encase the oil drops in water. Similarly, o/w emulsions stabilised by branched copolymer surfactant were diluted before aerating in the presence of hydrophobic silica nanoparticles to obtain the dry water emulsion.35 To the best of our knowledge, a systematic study on the preparation of dry oil powders is yet to be reported. In this study, using fluorinated solid particles of varying surface energy and polar oils and n-alkanes of varying surface tension and low shear, we show that dry oil powders containing up to 80 wt% of oil (relative to the total mass) can be prepared by simply hand shaking a mixture of solid particles and oil, and that the dry oil powder may invert to an ultra-stable oil foam at high oil![[thin space (1/6-em)]](https://www.rsc.org/images/entities/char_2009.gif) :
:![[thin space (1/6-em)]](https://www.rsc.org/images/entities/char_2009.gif) particle ratios. The findings are discussed in relation to the three-phase contact angle.
particle ratios. The findings are discussed in relation to the three-phase contact angle.
Experimental
Materials
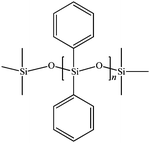
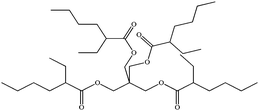
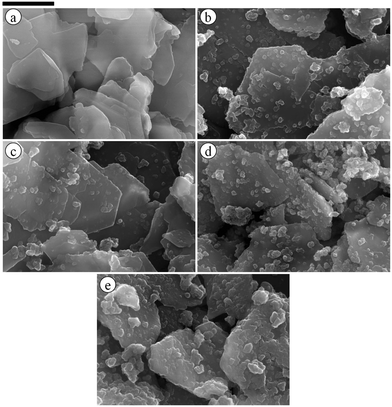
Perfluoroalkyl phosphate (PF) treated particles used in this study were prepared by Daito Kasei Kogyo Company Ltd., Japan. Such particles are common in cosmetics enabling the preparation of a long lasting make-up resilient to perspiration and sebum thus promoting a more natural and healthy appearance. The particles (PF-5, 8, 10 and 12) were obtained by coating raw hydrophilic sericite particles (PF-0) with varying amounts of C9–C15 perfluoroalkyl phosphate diethanolamine salt, [F3C(CF2)n(CH2)2O]mPOO[ONH2(CH2CH2OH)2]2, (where n = 6–18 and 2 > m > 1), which resulted in varying degrees of oleophobicity, with the PF-12 particles being the most oleophobic. Prior to fluorination, sericite particles are mixed with sodium aluminate and sulphuric acid leading to the formation of small crystals of Al(OH)3 on their surfaces rendering them positively charged and enabling an easy and uniform reaction with the anionic phosphate reactant. Sericite is a white, monoclinic, powdered mica mineral composed mainly of SiO2 (∼54%), Al2O3 (∼31%) and K2O (∼7%). The particles are plate-like of average size around 5 μm. They have a three-layer unit cell consisting of a SiO2 tetrahedron, an Al2O3 octahedron and a SiO2 tetrahedron held together by potassium ionic bonds.36 During chemical modification of the particles, the intermediate perfluoroalkyl phosphoric acid bonds to the particle surface through the formation of metal salts and/or hydrogen bonding depending on the alkalinity of the particles and imparts oleophobic properties to the particle surfaces.The oils, used as received from Shiseido Japan, were of different types and they include silicone, mineral, vegetable, ester and UV-absorbing oils. The name, chemical structure and density of these oils are given in Table 1. For comparison, n-alkanes (C5–C16) were also used. Such alkanes include pentane (Aldrich, ca. 98%), hexane (Fisher Scientific, ca. 95%), heptane (Sigma-Aldrich, ca. 99%), octane (Sigma-Aldrich, >98%), decane (Avocado, ca. 99%), dodecane (Sigma, ≥99%), tetradecane (Aldrich, ca. >99%) and general purpose grade hexadecane from Fisher Scientific. Air used was that present in the laboratory (N2 ≈ 78%, O2 ≈ 21%, Ar ≈ 0.9%, CO2 ≈ 0.04%). Water was passed through an Elga Prima reverse osmosis unit and then a Milli-Q reagent water system. The treated water has a surface tension of 72.0 mN m−1, pH of 6.9 and resistivity of 18 MΩ cm at 25 °C. Five other liquids (in addition to hexadecane and water) from Sigma-Aldrich were used as probe liquids to estimate the surface energies of particles from contact angle data. They include α-bromonaphthalene (97%), diiodomethane (99%), ethylene glycol (>99%), formamide (>99%) and glycerol (99%).
Methods
It was anticipated that dry oil powder formation would be possible with all the oil/particle combinations that gave oil liquid marbles. Nonetheless, knowing the amount of particles that must cover a known mass of oil to give it a dry oil powder appearance is fundamental. The critical oil![[thin space (1/6-em)]](https://www.rsc.org/images/entities/char_2009.gif) :
:![[thin space (1/6-em)]](https://www.rsc.org/images/entities/char_2009.gif) particle ratio, COPR, for the dry oil appearance defined as grams of oil per gram of particles, was determined by sequential addition of a small amount (≤0.25 g) of oil to 0.5 g of particles in a screw cap glass vessel, followed by gentle hand shaking (3 min). Above the COPR the mixture foamed. Conscious of this, attempts were made to prepare dry oils using five approaches. The first is described above. With this method, dry oil powder formation was possible for the majority of the oils and the PF-treated particle combinations that gave oil marbles previously. It was confirmed using liquid paraffin and jojoba oil and PF-8 particles that the sequential addition of oil to the particles serves to increase the size of oil droplets in the dry oil powder. The second approach also involves sequential addition of oil (≤0.25 g) but it is followed by vigorous hand shaking (3 min). In the third approach, using liquid paraffin or jojoba oil and PF-8 particles as well as 2-ethylhexyl-4-methoxycinnamate and PF-12 particles, the kind of materials formed at 0.2 g of oil below and above the COPR in a non-sequential procedure that lasted for at least 10 min was investigated. The required amount of oil was added at once to the particles (0.5 g) and hand shaken gently for the said time. This approach yielded a dry oil powder below the COPR and oil foam above it for liquid paraffin and jojoba oil, but foam for 2-ethylhexyl-4-methoxycinnamate in both cases. In the fourth, the amount of oil corresponding to the COPR was added at once to 0.5 g of particles in the glass vessel followed by gentle hand shaking (5 min). Using squalane, liquid paraffin and glyceryl tri(2-ethylhexanoate), this approach in which a large oil droplet hardly breaks into smaller ones yields a foam instead of a dry oil powder. Lastly, for liquid paraffin, macadamia nuts oil, jojoba oil and 2-ethylhexyl-4-methoxycinnamate and PF-5, 8, 10 and 12, attempts were made at preparing dry oil powders using an IKA T25 ultra turrax homogeniser (i.e. high shear) at between 4000 and 13
particle ratio, COPR, for the dry oil appearance defined as grams of oil per gram of particles, was determined by sequential addition of a small amount (≤0.25 g) of oil to 0.5 g of particles in a screw cap glass vessel, followed by gentle hand shaking (3 min). Above the COPR the mixture foamed. Conscious of this, attempts were made to prepare dry oils using five approaches. The first is described above. With this method, dry oil powder formation was possible for the majority of the oils and the PF-treated particle combinations that gave oil marbles previously. It was confirmed using liquid paraffin and jojoba oil and PF-8 particles that the sequential addition of oil to the particles serves to increase the size of oil droplets in the dry oil powder. The second approach also involves sequential addition of oil (≤0.25 g) but it is followed by vigorous hand shaking (3 min). In the third approach, using liquid paraffin or jojoba oil and PF-8 particles as well as 2-ethylhexyl-4-methoxycinnamate and PF-12 particles, the kind of materials formed at 0.2 g of oil below and above the COPR in a non-sequential procedure that lasted for at least 10 min was investigated. The required amount of oil was added at once to the particles (0.5 g) and hand shaken gently for the said time. This approach yielded a dry oil powder below the COPR and oil foam above it for liquid paraffin and jojoba oil, but foam for 2-ethylhexyl-4-methoxycinnamate in both cases. In the fourth, the amount of oil corresponding to the COPR was added at once to 0.5 g of particles in the glass vessel followed by gentle hand shaking (5 min). Using squalane, liquid paraffin and glyceryl tri(2-ethylhexanoate), this approach in which a large oil droplet hardly breaks into smaller ones yields a foam instead of a dry oil powder. Lastly, for liquid paraffin, macadamia nuts oil, jojoba oil and 2-ethylhexyl-4-methoxycinnamate and PF-5, 8, 10 and 12, attempts were made at preparing dry oil powders using an IKA T25 ultra turrax homogeniser (i.e. high shear) at between 4000 and 13![[thin space (1/6-em)]](https://www.rsc.org/images/entities/char_2009.gif) 000 rpm for 2 min below and above the COPR. A known mass of oil (0.2 g below or above COPR) was weighed into a glass vessel, followed by addition of particles (0.5 g) and then sheared. In a parallel approach, the particles were placed in the glass vessel before oil addition and then sheared. Only oil foams were obtained with both approaches. Thus, dry oil powders were prepared mainly via the first method as it gives powders with relatively high oil content for the majority of the oil–particle combinations. Unless stated otherwise, properties of dry oil powders described hereafter are those at the COPR.
000 rpm for 2 min below and above the COPR. A known mass of oil (0.2 g below or above COPR) was weighed into a glass vessel, followed by addition of particles (0.5 g) and then sheared. In a parallel approach, the particles were placed in the glass vessel before oil addition and then sheared. Only oil foams were obtained with both approaches. Thus, dry oil powders were prepared mainly via the first method as it gives powders with relatively high oil content for the majority of the oil–particle combinations. Unless stated otherwise, properties of dry oil powders described hereafter are those at the COPR.
Results and discussion
Firstly, the surface energy of the various particles is determined from advancing contact angle data of probe liquids. This is followed by a description of the behaviour of the particles on the surface of the liquids. Thirdly, we describe the characteristics of the oil liquid marbles and dry oil powders and how the latter invert to ultra-stable oil foams at relatively high oil![[thin space (1/6-em)]](https://www.rsc.org/images/entities/char_2009.gif) :
:![[thin space (1/6-em)]](https://www.rsc.org/images/entities/char_2009.gif) particle ratios. Lastly, a correlation between the formation of oil dispersions, oil foams, and dry oil powders with contact angle data is made.
particle ratios. Lastly, a correlation between the formation of oil dispersions, oil foams, and dry oil powders with contact angle data is made.
Particle surface energies
The surface energies of solid particles, γsa, and the surface tensions of liquids are commonly decomposed into their polar γp and dispersive γd components as:38,39| γ = γd + γp | (1) |
The polar component is due to dipolar interactions whilst the dispersive component comes from van der Waals forces between the molecules of the material.40 The interfacial tension γAB between two phases A and B is then expressed in terms of the two components for each phase as given by eqn (2),
 | (2) |
 | (3) |
It can be combined with eqn (4) to give eqn 5 (ref. 7 and 42)
 | (4) |
 | (5) |
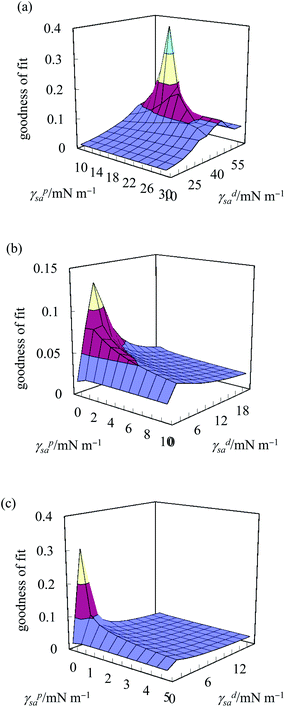
Eqn 5 contains two unknowns, γdsa and γpsa, the components of the solid surface energy as the other terms exist in the literature for many liquids. Finding the unknowns requires θ from at least two liquids of different polarity so that simultaneous versions of eqn (5) can be solved. As shown previously,42 it is more useful to use several probe liquids (water, glycerol, formamide, ethylene glycol, diiodomethane, α-bromonaphthalene and n-hexadecane) and to perform a least-squares calculation to determine the best combination of γdsa and γpsa that fits all the liquids simultaneously. The advancing θ of these liquids on relatively smooth disks composed of the sericite particles in air are given in Table 2. This approach is exemplified in Fig. 2 for the oleophilic and two fluorinated particles and in Fig. S2† for the rest of them. The 3-D surface energy charts are plots of the goodness of fit (=inverse of squares of variances) to θ set against a matrix of possible values of γdsa and γpsa. The best fit to all θ is read from the coordinates of the peak and the values are given in Table 3. This gives γdsa = 45 mN m−1 and γpsa = 18 mN m−1 for the oleophilic particles (PF-0). The value of γpsa is 0 mN m−1 for the rest of the particles, but γdsa decreases as the degree of fluorination increases. Generally, there is an inverse correlation between the degree of fluorination and the surface energy of the particles, as expected. The surface energy of a PTFE substrate (19.5 mN m−1), measured for comparison, is consistent with literature values (18.5 mN m−1).43 The advancing contact angle for water on it is 119°, in good agreement with literature values of 108–122°.44,45
| Liquid | γ la/mN m−1 | γdla/mN m−1 | γ pla/mN m−1 | θ/±2° | |||||
|---|---|---|---|---|---|---|---|---|---|
| PF-0 | PF-5 | PF-8 | PF-10 | PF-12 | PTFE | ||||
| Water | 72.8 | 21.8 | 51.0 | 0.0 | 140.3 | 147.7 | 138.4 | 148.0 | 118.5 |
| Glycerol | 64.0 | 34.0 | 30.0 | 18.2 | 128.1 | 145.3 | 131.4 | 146.2 | 101.6 |
| Formamide | 58.0 | 39.0 | 19.0 | 0.0 | 134.9 | 129.5 | 145.3 | 138.8 | 85.1 |
| Ethylene glycol | 48.0 | 29.0 | 19.0 | 0.0 | 119.3 | 134.8 | 136.2 | 137.5 | 75.8 |
| Diiodomethane | 50.8 | 58.0 | 0.0 | 29.2 | 127.5 | 130.5 | 127.6 | 130.2 | 100.6 |
| α-Bromonapthalene | 44.4 | 44.4 | 0.0 | 0.0 | 111.2 | 118.4 | 133.5 | 123.3 | 86.6 |
| n-Hexadecane | 27.8 | 27.8 | 0.0 | 5.0 | 89.5 | 97.8 | 104.8 | 117.6 | 35.1 |
| Particle | γ sa/mN m−1 | γ psa/mN m−1 | γ dsa/mN m−1 |
|---|---|---|---|
| PF-0 | 63.0 | 18.0 | 45.0 |
| PF-5 | 4.0 | 0.0 | 4.0 |
| PF-8 | 3.0 | 0.0 | 3.0 |
| PF-10 | 2.0 | 0.0 | 2.0 |
| PF-12 | 1.5 | 0.0 | 1.5 |
| PTFE | 19.5 | 0.0 | 19.5 |
Behaviour of particles on oil surfaces
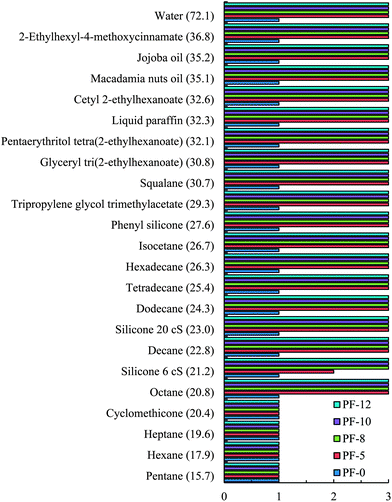
Fig. 3 summarises the results of the particle immersion experiment. The most oleophilic particles of PF-0 were wetted by all the oils and water and entered them within 30 s at rest. On agitation, a cloudy dispersion forms in the liquids. The following behaviour was observed for the other fluorinated particles. For the relatively low tension oils (γla below 22 mN m−1), the particles were either partially or completely wetted at rest or were not wetted at rest but entered the oil after agitation to give a cloudy dispersion. Oils of relatively high surface tension (γla above 22 mN m−1) did not wet the particles at rest. On agitation (apart from 20 cS PDMS and PF-5 mixture which gave a cloudy dispersion), all the oils possessing tensions between 22 and 32 mN m−1 produced a foam or a foam with a climbing film. Oils with tensions between 32 and 37 mN m−1 gave a foam and climbing film on agitation except cetyl 2-ethylhexanoate, macadamia nuts oil and jojoba oil that gave only a foam with the least fluorinated particles and 2-ethyhexyl-4-methoxycinnamate that gave only a climbing film with the most fluorinated ones. Water, possessing the highest surface tension, gave only a climbing film with the particles. Climbing films have been observed previously in water systems containing very hydrophobic solid particles and have been linked to the coalescence of unstable particle-coated bubbles with the planar air–water surface.46 As air bubbles coalesce with the surface, the interfacial area decreases thus causing an increase in the surface concentration of the adsorbed particles. This in turn leads to an increase in the surface pressure of the planar interface causing the film to climb. Photos of some of the materials formed by the particles with the various oils are shown in Fig. 4 and Fig. S3.† The transition from oil dispersions to oil foams and ultimately non-wetting states as the surface tension of the liquid increases is in line with earlier predictions and findings.12Oil liquid marbles and dry oils stabilised by particles
As mentioned earlier, oil liquid marbles can be conceived as the smallest unit of dry oil powders, although the size of a marble is significantly larger and it can be seen by eye. Marble formation was possible with most oil and particle combinations that produced oil foams described above (see Table 4). As the degree of particle fluorination increases, it is possible to encapsulate oils of lower tension and the robustness of the marbles also increased. It is generally accepted that relatively small (≤10 μL) liquid marbles, where the effect of surface tension dominates that of gravity, are quasi-spherical, whilst relatively large (≥50 μL) ones, where the effect of gravity dominates that of surface tension, are puddle-shaped.17,47 Here, however, the oil marbles (10 μL) assume a sausage-like shape if the oil droplet is rolled on the particle bed (to and fro) in only one direction. Otherwise, they are quasi-spherical. The origin of the shape of these relatively small liquid marbles is not clear at the moment, but might be due to the shape and/or density of the particles.| θ/±2° | ||||
|---|---|---|---|---|
| Liquid | PF-5 | PF-8 | PF-10 | PF-12 |
| Pentane | 0, 0: ○, × | 0, 0: ○, × | 0, 0: ○, × | 0, 0: ○, × |
| Hexane | 0, 0: ○, × | 0, 0: ○, × | 0, 0: ○, × | 0, 0: ○, × |
| Heptane | 43, 21: ○, × | 56, 25: ○, × | 50, 29: ○, × | 46, 22: ○, × |
| Cyclomethicone | 30, 12: ○, ✓ | 37, 20: ○, ✓ | 47, 27: ○, ✓ | 39, 24: ○, ✓ |
| 6 cS PDMS | 32, 18: ○, ✓ | 36, 30: ○, ✓ | 63, 39: ○, ✓ | 62, 38: ○, ✓ |
| Octane | 51, 27: ○, ✓ | 66, 40: ○, ✓ | 63, 36: ○, ✓ | 63, 33: ○, ✓ |
| 20 cS PDMS | 65, 42: ○, ✓ | 71, 35: ○, ✓ | 73, 43: ▲,✓ | 73, 32: ○, ✓ |
| Decane | 66, 36: ▲, ✓ | 88, 62: ▲, ✓ | 80, 47: ▲, ✓ | 84, 55: ▲, ✓ |
| Dodecane | 77, 63: ▲, ✓ | 92, 64: ▲, ✓ | 99, 65: ▲, ✓ | 95, 59: ▲, ✓ |
| Tetradecane | 82, 47: ▲, ✓ | 101, 69: ▲, ✓ | 106, 60: ▲, ✓ | 106, 73: ▲, ✓ |
| Isocetane | 63, 39: ▲,✓ | 68, 44: ▲, ✓ | 79, 52: ▲, ✓ | 56, 34: ▲, ✓ |
| Hexadecane | 90, 65: ▲, ✓ | 98, 69: ▲, ✓ | 105, 73: ▲, ✓ | 118, 93: ▲, ✓ |
| Phenyl silicone | 95, 72: ▲, ✓ | 91, 65: ▲, ✓ | 89, 61: ▲, ✓ | 96, 65: ▲, ✓ |
| Tripropylene glycol trimethylacetate | 78, 32: ▲, ✓ | 93, 44: ▲, ✓ | 76, 34: ▲, ✓ | 97, 56: ▲, ✓ |
| Squalane | 98, 76: ▲, ✓ | 111, 71: ▲, ✓ | 105, 70: ■, ✓ | 107, 71: ■, ✓ |
| Glyceryl tri(2-ethylhexanoate) | 106, 81: ▲, ✓ | 101, 60: ▲, ✓ | 93, 60: ▲, ✓ | 110, 80: ▲, ✓ |
| Pentaerythritol tetra(2-ethylhexanoate) | 110, 59: ▲, ✓ | 101, 57: ▲, ✓ | 97, 55: ■, ✓ | 118, 64: ■, ✓ |
| Liquid paraffin | 109, 83: ▲, ✓ | 121, 88: ■, ✓ | 121, 87: ■, ✓ | 126, 87: ■, ✓ |
| Cetyl 2-ethylhexanoate | 112, 75: ▲, ✓ | 111, 73: ■, ✓ | 94, 70: ■, ✓ | 96, 71: ■, ✓ |
| Macadamia nuts oil | 112, 76: ▲, ✓ | 101, 80: ■, ✓ | 115, 83: ■, ✓ | 128, 94: ■, ✓ |
| Jojoba oil | 113, 78: ▲, ✓ | 121, 88: ■, ✓ | 114, 82: ■, ✓ | 123, 94: ■, ✓ |
| 2-Ethylhexyl-4-methoxycinnamate | 91, 64: ■, ✓ | 117, 77: ■, ✓ | 113, 81: ■, ✓ | 118, 77: †, ✓ |
| Water | 140, 111: †, ✓ | 148, 119: †, ✓ | 138, 123: †, ✓ | 148, 127: †, ✓ |
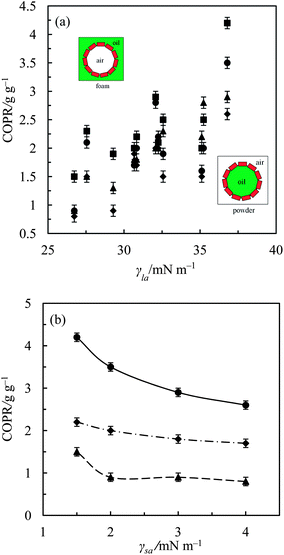
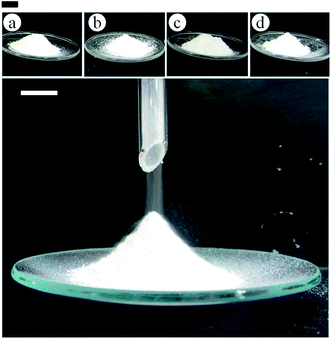
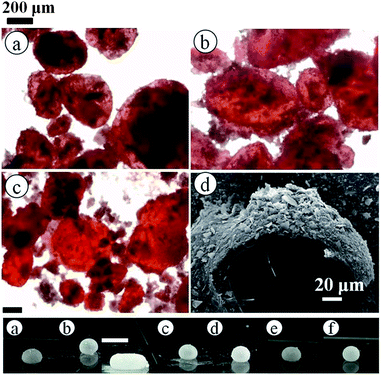
Following successful preparation of liquid marbles with these oils and fluorinated particles, attempts were made at preparing dry oil powders from them too. This was done in five different ways as stated earlier, conscious of the COPR, with the best being the sequential approach whose results are discussed here. Dry oil powder formation was possible with the majority of the oil and particle combinations that formed oil marbles. Fig. 5(a) shows that the COPR increases with an increase in the degree of fluorination on particle surfaces. The effect of the degree of fluorination and hence particle surface energy on the COPR is shown in Fig. 5(b) for isocetane, glyceryl tri(2-ethylhexanoate) and 2-ethylhexyl-4-methoxycinnamate. An inverse correlation exists between particle surface energy and the COPR. The amount of oil encapsulated within powders ranges from 44 (dry isocetane powder stabilised by PF-5 particles) to 81 wt% (2-ethylhexyl-4-methoxycinnamate powder stabilised by PF-12 particles), the latter exceeding that reported earlier22 by a factor of five. Similar to liquid marble formation, the most oleophilic and relatively high surface energy particles did not adsorb at the air–liquid interfaces and thus did not enable dry oil formation. Dry oil formation for the rest of the particles and with oils possessing γla below 25 mN m−1 (i.e. cyclomethicone, 6 and 20 cS PDMS) was also not possible even though marbles could be prepared. Dry oil powders were successfully prepared from the rest of the oils and particle types via sequential addition of the required amount of oil to the particles, followed by low shear up to the COPR. Formation of dry water was not possible by this route because of the large difference between its surface tension and the surface energy of the particles. In addition, the high surface tension of water did not allow disruption of a big water drop into smaller droplets by gentle shaking unlike the case with the relatively low tension oils. Photos of some dry oil powders and their corresponding optical micrographs (alongside photos of some oil marbles) are shown in Fig. 6 and 7, respectively. It can be seen that the oil droplets (>100 μm) within the powders are non-spherical in shape. Such deviation from spherical shape has been reported previously for particle-coated fluid dispersed phases and is due to the jamming of particles at the interface preventing their relaxation to a spherical geometry.48 A cryo-SEM image from an oil powder is included in Fig. 7 where a fractured oil drop coated with particles containing frozen oil within is clearly visible. Other images of the same oil powder are given in Fig. S4.†
The absence of significant oil staining upon placing the dry oil powders on a filter paper and watch glass suggests that the oil droplets in the powder are stable against oil leakage. Apart from the n-alkanes that released some of the encapsulated oil droplets after one week, the dry oil powders are stable to oil leakage and hence to phase separation for at least 8 months, but liquefy and cream releasing the encapsulated oil when sheared on the skin or a surface (Fig. S5†), except in cases where the oil content (relative to the total mass of powder) is less than 60 wt% which form a white paste. The latter dry oil powders invert to oil foams upon vigorous shaking as verified with squalane, liquid paraffin and jojoba oil stabilised by PF-8 particles. This suggests that the dry oil powders are metastable with the stable state being an oil foam.
Catastrophic phase inversion of dry oil powders to oil foams at high oil![[thin space (1/6-em)]](https://www.rsc.org/images/entities/h3_char_2009.gif) :
:![[thin space (1/6-em)]](https://www.rsc.org/images/entities/h3_char_2009.gif) particle ratio
particle ratio
Above the COPR, catastrophic phase inversion from a dry oil powder to an ultra-stable oil foam was observed for all the oils and the stable air bubbles coated with particles are also non-spherical but smaller than the oil droplets in the dry oil powders. Particle stabilised non-aqueous foams of excellent stability, in which the gas bubbles deviated from spherical geometry, were reported previously.6,7,22 Phase inversion was confirmed by verification of the continuous phase of the materials through the dispersion test. The dry oil powders did not disperse in the neat oils whereas the foams readily did (Fig. S5†). This phase inversion is similar to that in emulsions (i.e. o/w to w/o and vice versa)49 and is driven by the high oil![[thin space (1/6-em)]](https://www.rsc.org/images/entities/char_2009.gif) :
:![[thin space (1/6-em)]](https://www.rsc.org/images/entities/char_2009.gif) particle ratio. Increasing the oil content at fixed mass of particles can potentially increase the size of the oil droplets or their number in the dry oil powder, but reduce the amount of non-adsorbed particles in the system. Evidence from Fig. 8, for PF-8 particles containing different amounts of liquid paraffin, suggests that the former is favoured over the latter. Above the COPR, there are little or no particles to sufficiently coat the oil droplets following oil addition. In other words, the total amount of oil surfaces the particles can coat and stabilise in the form of dry oil powder is greater than that of the air surfaces trapped in the vessel. This makes the oil-in-air powder metastable and hence it inverts to the stable air-in-oil foam (Fig. 9) upon gentle shaking. Such a catastrophic phase inversion has also been reported in aqueous systems in the context of dry water.21 Most of the oil foams did not show any sign of drainage or coalescence indefinitely, but some of them underwent limited drainage within the first week after formation to yield very stable foams subsequently. These were those of squalane or 2-ethylhexyl-4-methoxycinnamate stabilised by PF-8, cetyl 2-ethylhexanoate stabilised by PF-10 and either glyceryl tri(2-ethylhexanoate), pentaerythritol tetra(2-ethylhexanoate) or jojoba oil stabilised PF-12 particles.
particle ratio. Increasing the oil content at fixed mass of particles can potentially increase the size of the oil droplets or their number in the dry oil powder, but reduce the amount of non-adsorbed particles in the system. Evidence from Fig. 8, for PF-8 particles containing different amounts of liquid paraffin, suggests that the former is favoured over the latter. Above the COPR, there are little or no particles to sufficiently coat the oil droplets following oil addition. In other words, the total amount of oil surfaces the particles can coat and stabilise in the form of dry oil powder is greater than that of the air surfaces trapped in the vessel. This makes the oil-in-air powder metastable and hence it inverts to the stable air-in-oil foam (Fig. 9) upon gentle shaking. Such a catastrophic phase inversion has also been reported in aqueous systems in the context of dry water.21 Most of the oil foams did not show any sign of drainage or coalescence indefinitely, but some of them underwent limited drainage within the first week after formation to yield very stable foams subsequently. These were those of squalane or 2-ethylhexyl-4-methoxycinnamate stabilised by PF-8, cetyl 2-ethylhexanoate stabilised by PF-10 and either glyceryl tri(2-ethylhexanoate), pentaerythritol tetra(2-ethylhexanoate) or jojoba oil stabilised PF-12 particles.
 | ||
| Fig. 8 Optical micrographs of dry liquid paraffin powder stabilised by 0.5 g of PF-8 sericite particles containing various amounts of liquid paraffin (given). | ||
Relationship between air-liquid-solid contact angle and the type of material formed
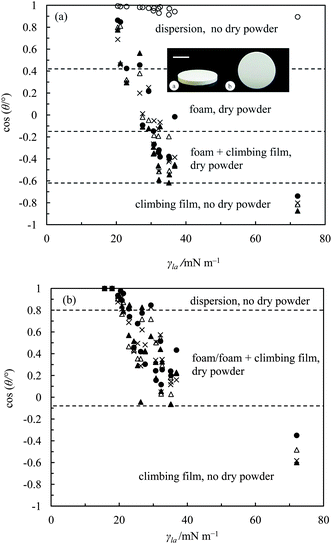
Since the kind of material a mixture of air, liquid and solid particles produces depends on the contact angle which the particles make with the liquid, it is important to have an idea of this angle here. For spherical particles it is generally accepted that if a liquid completely wets the particles (θ = 0°) it gives a particle dispersion and for θ = 180° no adsorption occurs. For intermediate values of θ, particles are more wetted by the liquid (θ < 90°) or air (θ > 90°) phase and foams or liquid marbles/dry liquid powders are stabilised, respectively, at least in the case of water.4,21 However, the contact angles reported here are not on the particles themselves but on disks composed of the particles with the danger being that certain surface groups are buried during particle compression. In addition, the particles are plate-like and the possibility exists that the fluoro-coating may be different on the edges compared with the faces. The configuration of such asymmetric particles at the fluid interface within materials like oil foams and oil powders is unknown at present although Garrett discusses the likely configurations, albeit at an air–water surface, which depends on the particle geometry.50 As a result, unravelling a clear correlation between contact angle and material type is obviously a challenge. Table 4 shows both the advancing and receding values of θ alongside the type of material that was obtained from the various oil and particle combinations in the case of vigorous mixing and gentle agitation. The liquids are arranged in order of increasing γla. For the oleophilic sericite particles (PF-0), all the liquids wet the particle disks as expected (θ < 5°). For the other particles, the hysteresis is relatively high (above 15°). Since hysteresis in contact angle is quite low for rough surfaces,51 what we observe may be due to the smooth nature of the surfaces of these disks.15 Particle dispersions in oil were obtained in liquids of relatively low γla. In cases where γla was moderate (between 27 and 37 mN m−1) and θ was between 70 and 120°, an oil foam or a foam + climbing film was observed. For water (highest γla) where θ ≥ 140°, only climbing films were observed. In addition, liquid oil marbles form not just for high contact angle systems, e.g. jojoba oil with PF-12, but also when the angle is as low as 30°, e.g. cyclomethicone with PF-5. This is very different to the case of liquid water marbles where particles required to date are all very hydrophobic. We admit however that the robustness of the marbles to transport decreases as the apparent contact angle decreases. Dry oil powder formation was possible with most of the oil–particle combinations which stabilised liquid oil marbles as expected. It was not possible for oils of lower γla, for example low chain length alkanes. A number of conclusions can be extracted from Table 4. Firstly, for all the fluorinated particles, there is a transition from a dispersion to a foam to a climbing film as γla increases. Secondly, foams and marbles can be stabilised in one and the same system depending on the mixing conditions. Thirdly, omniphobic surfaces can be created with these fluorinated particles.The cosine of both the advancing and receding contact angles on particle disks is plotted as a function of γla in Fig. 10. For certain smooth substrates, such plots are often linear of negative gradient.52 The inset in Fig. 10(a) shows an example of one of the disks on which θ was measured. The value of the cosine of the advancing angle is more or less unity for all the liquids on PF-0 surfaces, but decreases with increasing γla on the fluorinated particle surfaces as does the receding angle (Fig. 10(b)). We also label on the graphs the regions where either dispersions, foams or climbing films occur upon intense agitation or whether a dry oil powder can be formed or not upon gentle mixing. Since the receding contact angle is always less than the advancing one, the boundaries between the different regions depend on which angle is taken. It is not clear which angle is operative during the mixing of particles with liquid. Indeed, in the case of oil–water systems, the emulsion type depended on which liquid contacted the particles first which was argued in terms of the difference between the advancing and receding contact angle.53 The main point about this figure is that for any particle type, a particle dispersion forms when cos![[thin space (1/6-em)]](https://www.rsc.org/images/entities/char_2009.gif) θ is approximately 1, foams are stabilised as it decreases and eventually only climbing films are stabilised when it is close to −1. This is consistent with previous findings with PTFE particles6 and fluorinated silica particles.7
θ is approximately 1, foams are stabilised as it decreases and eventually only climbing films are stabilised when it is close to −1. This is consistent with previous findings with PTFE particles6 and fluorinated silica particles.7
Conclusions
The behaviour of a series of platelet sericite particles coated to different extents with a fluorinating agent in mixtures with air and oil has been studied. The material which forms after aeration by vigorous shaking depends on both the surface tension of the oil and the surface energy of the particles which control their degree of wetting. Oil dispersions are formed in liquids of relatively low tension (<22 mN m−1). Particle-stabilised air-in-oil foams form in liquids of higher tension where the three-phase contact angle θ measured on planar disks composed of the particles lies between ca. 70 and 125°. For oils of tension above 27 mN m−1 with particles for which θ > 70°, we have discovered that dry oil powders in which oil drops stabilised by particles are dispersed in air (o/a) can be prepared by gentle mixing up to a critical oil![[thin space (1/6-em)]](https://www.rsc.org/images/entities/char_2009.gif) :
:![[thin space (1/6-em)]](https://www.rsc.org/images/entities/char_2009.gif) particle ratio (COPR) and do not leak oil. These powders containing at least 60 wt% oil release the encapsulated oil however when sheared on a substrate. For many of the systems forming oil powders, stable oil liquid marbles can also be prepared. Above the COPR, catastrophic phase inversion occurs yielding an ultra-stable oil foam (a/o).
particle ratio (COPR) and do not leak oil. These powders containing at least 60 wt% oil release the encapsulated oil however when sheared on a substrate. For many of the systems forming oil powders, stable oil liquid marbles can also be prepared. Above the COPR, catastrophic phase inversion occurs yielding an ultra-stable oil foam (a/o).
Acknowledgements
We are grateful to the Tertiary Education Trust Fund of Nigeria and the University of Hull for a studentship to ATT, Shiseido (Japan) for partial financial support and Mr A. Sinclair (Univ. of Hull) for the SEM images and EDX spectra.References
- W. Ramsden, Proc. R. Soc. London, 1903, 72, 156 CrossRef CAS.
- S. U. Pickering, J. Am. Chem. Soc., 1907, 91, 2001 RSC.
- R. Aveyard, B. P. Binks and J. H. Clint, Adv. Colloid Interface Sci., 2003, 100–102, 503 CrossRef CAS.
- B. P. Binks and T. S. Horozov, Angew. Chem., Int. Ed., 2005, 44, 3722 CrossRef CAS PubMed.
- U. T. Gonzenbach, A. R. Studart, E. Tervoort and L. J. Gauckler, Langmuir, 2006, 22, 10983 CrossRef CAS PubMed.
- B. P. Binks, A. Rocher and M. Kirkland, Soft Matter, 2011, 7, 1800 RSC.
- B. P. Binks and A. T. Tyowua, Soft Matter, 2013, 9, 834 RSC.
- J. H. Schulman and J. Leja, Trans. Faraday Soc., 1954, 50, 598 RSC.
- A. Stocco, E. Rio, B. P. Binks and D. Langevin, Soft Matter, 2011, 7, 1260 RSC.
- P. Aussillous and D. Quéré, Nature, 2001, 411, 924 CrossRef CAS PubMed.
- P. McEleney, G. M. Walker, I. A. Larmour and S. E. J. Bell, Chem. Eng. J., 2009, 147, 373 CrossRef CAS PubMed.
- B. P. Binks and A. Rocher, Phys. Chem. Chem. Phys., 2010, 12, 9169 RSC.
- Y.-C. Sheen, Y.-C. Huang, C.-S. Liao, H.-Y. Chou and F.-C. Chang, J. Polym. Sci., Part B: Polym. Phys., 2008, 46, 1984 CrossRef CAS.
- R. Campos, A. J. Guenthner, T. S. Haddad and J. M. Mabry, Langmuir, 2011, 27, 10206 CrossRef CAS PubMed.
- A. Tuteja, W. Choi, J. M. Mabry, G. H. McKinley and R. E. Cohen, Proc. Natl. Acad. Sci. U. S. A., 2008, 105, 18200 CrossRef CAS PubMed.
- N. Eshtiaghi and K. P. Hapgood, Powder Technol., 2012, 223, 65 CrossRef CAS PubMed.
- P. Aussillous and D. Quéré, Proc. R. Soc. London, Ser. A, 2006, 462, 973 CrossRef CAS.
- E. Bormashenko, Curr. Opin. Colloid Interface Sci., 2011, 16, 266 CrossRef CAS PubMed.
- E. Bormashenko and A. Musin, Appl. Surf. Sci., 2009, 255, 6429 CrossRef CAS PubMed.
- J. Tian, T. Arbatan, X. Li and W. Shen, Chem. Commun., 2010, 46, 4734 RSC.
- B. P. Binks and R. Murakami, Nat. Mater., 2006, 5, 865 CrossRef CAS PubMed.
- R. Murakami and A. Bismarck, Adv. Funct. Mater., 2010, 20, 732 CrossRef CAS.
- W. Barthlott and C. Neinhuis, Planta, 1997, 202, 1 CrossRef CAS.
- N. Pike, D. Richard, R. Foster and L. Mahadevan, Proc. R. Soc. London, Ser. B, 2002, 269, 1211 CrossRef PubMed.
- P. A. Kralchevsky and K. Nagayama, Adv. Colloid Interface Sci., 2000, 85, 145 CrossRef CAS.
- B. P. Binks, A. J. Johnson and J. A. Rodrigues, Soft Matter, 2010, 6, 126 RSC.
- B. P. Binks, B. Duncumb and R. Murakami, Langmuir, 2007, 23, 9143 CrossRef CAS PubMed.
- L. Forny, I. Pezron, K. Saleh, P. Guigon and L. Komunjer, Powder Technol., 2007, 171, 15 CrossRef CAS PubMed.
- L. Forny, K. Saleh, R. Denoyel and I. Pezron, Langmuir, 2010, 26, 2333 CrossRef CAS PubMed.
- B. O. Carter, D. J. Adams and A. I. Cooper, Green Chem., 2010, 12, 783 RSC.
- B. O. Carter, W. Wang, D. J. Adams and A. I. Cooper, Langmuir, 2010, 26, 3186 CrossRef CAS PubMed.
- R. Mezzenga and S. Ulrich, Langmuir, 2010, 26, 16658 CrossRef CAS PubMed.
- H. Adelmann, B. P. Binks and R. Mezzenga, Langmuir, 2012, 28, 1694 CrossRef CAS PubMed.
- R. Murakami, H. Moriyama, M. Yamamoto, B. P. Binks and A. Rocher, Adv. Mater., 2012, 24, 767 CrossRef CAS PubMed.
- B. O. Carter, J. V. M. Weaver, W. Wang, D. G. Spiller, D. J. Adams and A. I. Cooper, Chem. Commun., 2011, 47, 8253 RSC.
- Y.-S. Perng, E. I.-C. Wang, C.-C. Lu and L.-S. Kuo, Tappi J., 2008, 3, 21 Search PubMed.
- D. D. Eberl, J. Srodon, M. Lee, P. H. Nadeau and H. R. Northrop, Am. Mineral., 1987, 72, 914 CAS.
- F. M. Fowkes, J. Phys. Chem., 1963, 67, 2538 CrossRef CAS.
- D. K. Owens and R. C. Wendt, J. Appl. Polym. Sci., 1969, 13, 1741 CrossRef CAS.
- C. J. Van Oss, Interfacial Forces in Aqueous Media, Marcel Dekker, New York, 1994 Search PubMed.
- T. Young, Philos. Trans. R. Soc. London, 1805, 95, 65 CrossRef.
- J. H. Clint and A. C. Wicks, Int. J. Adhes. Adhes., 2001, 21, 267 CrossRef CAS.
- C. J. Van Oss and R. F. Giese, Clays Clay Miner., 1995, 43, 474 CAS.
- J. Zhang, J. Li and Y. Han, Macromol. Rapid Commun., 2004, 25, 1105 CrossRef CAS.
- C. W. Extrand and Y. Kumagai, J. Colloid Interface Sci., 1995, 170, 515 CrossRef CAS.
- B. P. Binks, J. H. Clint, P. D. I. Fletcher, T. J. G. Lees and P. Taylor, Chem. Commun., 2006, 3531 RSC.
- E. Bormashenko, R. Progreb, G. Whyman and A. Musin, Colloids Surf., A, 2009, 351, 78 CrossRef CAS PubMed.
- A. B. Subramaniam, M. Abkarian, L. Mahadevan and H. A. Stone, Langmuir, 2006, 22, 10204 CrossRef CAS PubMed.
- B. P. Binks, L. Isa and A. T. Tyowua, Langmuir, 2013, 29, 4923 CrossRef CAS PubMed.
- P. R. Garrett, in Defoaming: Theory and Industrial Applications, ed. P.R. Garrett, Surfactant Science Series, Marcel Dekker, New York, 1993, vol. 45, p. 1 Search PubMed.
- D. Quéré, Annu. Rev. Mater. Res., 2008, 38, 71 CrossRef.
- H. W. Fox and W. A. Zisman, J. Colloid Sci., 1952, 7, 428 CrossRef CAS.
- B. P. Binks and J. A. Rodrigues, Langmuir, 2003, 19, 4905 CrossRef CAS.
Footnote |
| † Electronic supplementary information (ESI) available. See DOI: 10.1039/c3sm52748d |
| This journal is © The Royal Society of Chemistry 2014 |


