 Open Access Article
Creative Commons Attribution 3.0 Unported Licence
Emergence of surfactant-free micelles from ternary solutions†
S.
Schöttl
a,
J.
Marcus
a,
O.
Diat
b,
D.
Touraud
a,
W.
Kunz
a,
T.
Zemb
*b and
D.
Horinek
*a
aInstitut für Physikalische und Theoretische Chemie, Universität Regensburg, Universitätsstraße 31, 93053 Regensburg, Germany. E-mail: Dominik.Horinek@ur.de
bInstitut de Chimie Séparative de Marcoule (ICSM) UMR 5257 CEA/CNRS/UM2/ENSCM, F-30207 Bagnols sur Céze, France. E-mail: Thomas.Zemb@icsm.fr
First published on 14th April 2014
Abstract
Curious effects ranging from enzyme activity to anomalies in evaporation rates that have been known for over fifty years suggest the existence and thermodynamic stability of surfactant-free micelles. Only recently, joint X-ray, light and neutron scattering experiments have demonstrated that aggregates and bulk pseudo-phases coexist in presumably normal solutions, in which a water insoluble component is solubilized in a certain domain of concentration of a hydrotrope component like ethanol. Nevertheless, nothing is known about the molecular-level shape and structure of such aggregates. In this work we characterize mixtures of octanol, ethanol, and water by molecular dynamics simulations. For compositions in the “pre-ouzo” region (close to the single phase stability limit) we observe micelle-like aggregates that are clearly distinct from simple critical density fluctuations. We define an ethanol partition in the pseudo-phase from an integral of the van der Waals dispersion energy term. From this partition, octanol-rich aggregates swollen with ethanol appear with an emerging interface. Ethanol is present in the water pseudo-phase with an exponential decay similar to the one predicted by Marcelja and Radic forty years ago.
Introduction
Surfactants in solution form several types of nanoscale structures: lyotropic liquid crystals were identified in the late XIXth century, micelles were proposed as such in the thirties of the XXth century by McBain but were accepted only ten years later,1 and also microemulsions, which are thermodynamically stable in contrast to standard emulsions, were identified in 1948 by Winsor.2 Since then, the standard theory of micellisation, which considers the solvent with monomers as a pseudo-phase in equilibrium with structured aggregates, has been progressively accepted. These aggregates have an optimal volume set by steric constraints due to surfactant head-group area or “surface charge regulation”.3–5However, strange observations dating back to the early XXth century about membrane enzyme reactions in lipid-less media,6 non-linear effects in evaporation of ternary mixtures,7 the polar paradox in oxidation rates of ternary fluids8 as well as unexplained “single phase” ternary solutions that contain ethanol9 led to the proposition in the seventies by the group of Barden10 that “surfactant-less microemulsions” should go beyond a nice name to some strange unexplained properties of some homogeneous ternary fluids that can be reversibly phase separated by simple centrifugation,10 but correspond to a thermodynamic equilibrium in the phase diagram. The existence of SFME was considered by most people as a sort of urban legend, mainly due to the tautological argument that all known micelles contained surfactants, so surfactant-less micelles or microemulsions should not exist.
However, recent scattering experiments with light11 and with X-rays and neutrons,12 gave proof of structures identical to “standard” micelles, which led to the unambiguous conclusion that well-defined aggregates with a preferred size exist in ternary solutions containing two alcohols (ethanol, which is a hydrotrope13 and octanol, which acts in classical formulations as co-surfactant14). Some of these experiments also demonstrated that these structures are not caused by critical fluctuations, because the signals of different solution components give different q dependencies.
According to the standard theory of micelles, these surfactant-free microemulsions (SFME) should not exist. This work presents molecular modeling results (molecular dynamics simulations with fully atomistic resolution without specifically adjusted force field parameters) that demonstrate the microemulsion-like character of an octanol–ethanol–water ternary solution. The obtained results serve as a guide to the mind and help to investigate what is the emerging interfacial film, and to understand on a molecular level how these structures can subsequently “vanish” in ordinary ternary fluids by adding ethanol or be subject to an ouzo-type instability, where an emulsion is induced simply by evaporation of ethanol.
Results
Octanol aggregation into pre-ouzo micelles observed by molecular simulations
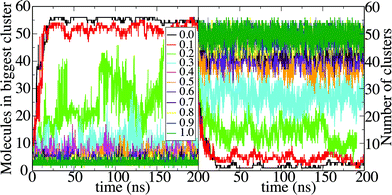
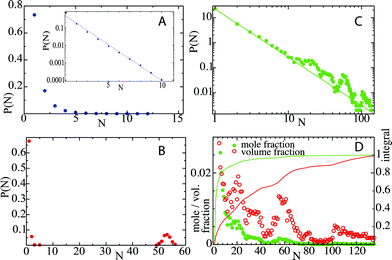
Octanol aggregation is studied in dilute solutions of octanol in ethanol–water mixtures with compositions ranging from pure water (mole fraction of ethanol xE = 0) to pure ethanol (xE = 1). For each composition the aggregation of octanol molecules in solution is analyzed by means of the number of octanol aggregates, shown in Fig. 1A, and the size of the largest octanol aggregate, shown in Fig. 1B. The poor solubility of octanol in pure water (xE = 0) leads to the formation of one octanol aggregate that contains basically all octanol molecules in the small simulation box. Only from time to time does an octanol molecule dissolve into the aqueous phase. A few more octanol molecules become solvated when small amounts of ethanol are present (xE = 0.1), but otherwise the scenario of a phase-separated system with one large cluster is unchanged. At the opposite limit (xE = 1), octanol is soluble in pure ethanol, and aggregation is limited to statistical association into small clusters in the solution. The characteristics of the aggregation are shown in histograms of aggregate sizes, in which all clusters observed during the simulation are included (not only the largest cluster as shown in Fig. 1B). Fig. 2A shows the histogram for a very high ethanol content (xE = 0.9). An exponential decay with the cluster size is the result of subsequent size-independent association equilibria Octn + Oct ⇄ Octn+1. Fig. 2B shows this histogram for xE = 0.1. The probability distribution shows one large cluster that contains almost all octanol molecules that are present in the system, which again points to phase separation. The key point here lies in compositions that correspond to the pre-ouzo regime at intermediate ethanol contents close to the instability curve: these mixtures do not show macroscopic phase separation, but they are also not simple molecularly homogeneous solutions of octanol. We identify this regime in the simulations with an ethanol content of xE = 0.2 (owing to the simplicity of classical force fields this composition does not quantitatively match the composition at which the pre-ouzo effect is observed experimentally. Nevertheless, the qualitative observations are the same as long as the stability of the one-phase system is ensured in the MD simulations). Fig. 2C shows that aggregates of up to approximately 50 octanol molecules form in the solution, which is very close to the total octanol number of 56. A clearer view is obtained by looking at a 4 times larger simulation system, in which 224 octanol molecules are present. The cluster size histogram shows that there are no relevant aggregates with sizes larger than 100, which proves that the observed aggregates are not limited by the small system size. The cluster size distribution shows clear peaks centered at cluster sizes of approximately 20 and 55, and a weak broad peak with more than 100 molecules, which are clearly different from clusters that appear as a consequence of critical fluctuations of a system that is close to instability. Such critical fluctuations, which diverge for second order phase transitions but not for first order phase transitions, would produce a power-law distribution of cluster sizes without distinct peaks. In fact, a double-logarithmic plot clearly shows that the aggregate size distribution follows a power law with a scaling exponent of 1.93 up to aggregation sizes of ten octanol molecules. For higher aggregation sizes the power-law distribution is augmented by additional features: a broad signal around N = 20, a sharper peak around N = 55, and a weak and broader signal for sizes larger than 100 octanol molecules. Such numbers are typical of short-chain anionic surfactants presenting a peculiar variability of aggregation numbers with concentration.15 The distribution of cluster sizes shows that aggregates with these aggregation numbers fulfil the thermodynamic definition of micelle formation: they are local minima in the free energy and show up as local maxima in the histogram.These local maxima correspond to the emerging micelles that are stable between the phase separation and ordinary ternary fluids; we note also that the first distinct deviation from the power-law distribution corresponds to 20 molecules: for rather flexible surfactants, extremely monodisperse small direct micelles with ten to twenty molecules are obtained, since none of the molecules can be present “inside”.16
Signatures of pre-ouzo micelles in scattering signals
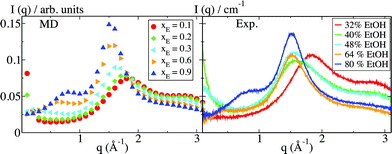
The formation of micelle-like aggregates in the pre-ouzo region is accompanied by characteristic patterns in the scattering signals. Fig. 3 shows the scattering intensity I(q) obtained from the simulation data for ternary systems that are a simple one-phase system (blue, xE = 0.9), a pre-ouzo system (green, xE = 0.2), and a two-phase system (red, xE = 0.1). In the simple, micelle-free solution in pure ethanol, there is a large peak around q = 1.7 Å−1. This peak is typical of the molecular packing in ethanol, which is the dominant component at this composition. At lower values of q, there is no indication of larger-scale structures. With increasing water content in the solution, the intensity of the ethanol peak is gradually diminished, while a double peak at q = 2 Å−1 and q = 3 Å−1, which is the typical signal of water scattering, arises at the same time. These peaks correspond directly to the angstrom-scale atomic packing in the system. Signatures of the emergence of micelles occur in the region of lower scattering angles: with pure ethanol as solvent, a weak secondary peak is seen at q ≈ 1 Å−1. The location of this peak gradually shifts towards lower q with increasing water content. The scattering signature is close to that obtained for micelles formed by sodium octanoate, a well-known short chain surfactant.15,17 For the xE = 0.2 solvent, the maximum of the peak cannot be resolved, because the low-q limit is dictated by the simulation box size, which is of the order of 10 nm, and a steady increase in intensity is observed for q → 0. This peak is a direct evidence for the existence of the micelles emerging in the pre-ouzo region, which increase when the composition approaches the limit of stability.The low-q signal of the phase-separated system with xE = 0.1 also shows a drastic increase in intensity for q → 0. In this case, the scattering signal is produced by the presence of only one large droplet in the simulation box and is a simple result of the finite-system phase separation. Experimental small and wide angle X-ray (SWAXS) data, which are also shown in Fig. 3, agree well with the simulation results, similar to the good agreement found for binary alcohol–water mixtures.18
Two populations of ethanol molecules
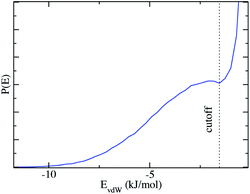
We now extend the concept of two pseudo-phases as introduced by Tanford: dilute solutions of monomers are in equilibrium with micelles: since there is no surfactant, this requires a “rule” for determining if a given ethanol molecule “belongs” to the micellar pseudo-phase or to the solvent pseudo-phase. As values of vapor pressure in the pre-ouzo region demonstrate, only a fraction of the ethanol is apparently present in the aqueous pseudo-phase, since the ethanol activity in the ternary system is lower than in the corresponding binary system.19 This is due to the fact that the ethanol molecules are partitioned between the pseudo-phase, and only a fraction is a constituent of the octanol-rich aggregates in the thermodynamic sense. Only the remaining ethanol molecules “belong” to the external water-rich pseudo-phase.In order to have a self-consistent definition of this partition of ethanol, we cannot rely on the distribution of head-groups of surfactants seen as a dividing surface: instead, we pick out one aggregate and determine the van der Waals interaction EEM between this aggregate and one selected ethanol molecule. Summing over all ethanol molecules in the system, the distribution of the interaction energies, which is shown in Fig. 4, shows a large peak centered at EEM = 0, which means that most ethanol molecules interact only weakly with the selected aggregate and are not part of the aggregate. However, the plot shows a minimum at EEM = −1.5 kJ mol−1 and a subsequent peak that represents a second population of ethanol molecules that are “bound” to the octanol aggregate and therefore belong to the octanol-rich pseudo-phase. The ethanol molecules which have weaker interaction energies than EEM = −1.5 kJ mol−1 do not belong to the analyzed aggregate. They are either in the water-rich pseudo-phase or they belong to another aggregate in the system. The average interaction energy of ethanol molecules bound to octanol-rich aggregates is EEM = −3.8 kJ mol−1, which can be interpreted as an average binding energy.
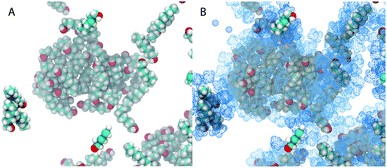
Fig. 5 shows snapshots of the simulation with xE = 0.2. In Fig. 5A only the octanol molecules are shown, in Fig. 5B all ethanol molecules that are part of an octanol aggregate are also shown. One core result of this work becomes apparent when we take the partition of ethanol into account: octanol-rich micelles are a discrete collection of globular aggregates when only octanol molecules are considered (A). Upon closer examination of part (B), it appears that some of the ethanol molecules penetrate into the core of the aggregate, but most ethanol molecules are close to the interface of the aggregate.
Structure of the micellar aggregates
We finally analyze the local density of the mixture components with respect to the centers of the octanol-rich domains, taken as micelles emerging along a dilution route going towards lower content in ethanol. With the assumption that the aggregates are approximated on average as spherical objects, the local densities can be reduced to one-dimensional functions, which are shown in Fig. 6. The density of octanol is highest inside the aggregate with a local density of 4 mol l−1 at the center. With increasing distance from the micelle center, there is a decay of the octanol concentration. As expected, the water density shows the opposite trend and increases with the distance from the micelle center. It is noteworthy that there is some water in the aggregate and some octanol in the aqueous phase. The location of the interface, determined as the distance at which the octanol concentration decays to 1/e, is at r = 15 Å, which is very close to the size determined by fitting to a Teubner–Strey parametric expression.12 The interface, in the sense of application of DLVO at a primitive level using Lifshitz’s approximation,20,21 can be defined as the plane where octanol and water density cross. Ethanol, the component of the mixture that induces miscibility, is distributed over both pseudo-phases: the density inside the micelle is approximately 4 mol l−1, about half the value that is found in the aqueous pseudo-phase. At the location of the interface, there is a slight but distinct peak in the ethanol concentration, after which the concentration decays slowly to the bulk value: this slight enhancement corresponds to the appearance of an interfacial film in classical micelles.22 The split of the ethanol density into contributions from “bound” and “unbound” molecules reveals that in the bulk aqueous phase the density of bound ethanol approaches zero, but even in the center of the micelle unbound ethanol is present.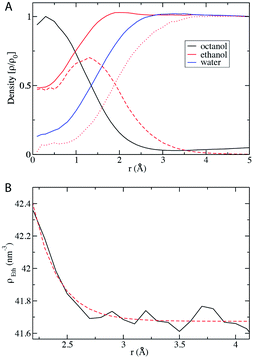 | ||
| Fig. 6 (A) Radial distribution function of water, octanol, and ethanol with respect to the center of mass of the micelle-like aggregate in the pre-ouzo region (xE = 0.2). The RDF of ethanol is also split into the curves of bound (dashed) and unbound (dotted) ethanol molecules as determined by the van der Waals interaction energy criterion (see Fig. 5). (B) A closer look at the decay of the ethanol RDF outside of the aggregate. The decaying concentration is nicely described by an exponential with a decay length of 2.2 Å. | ||
The distribution of ethanol in the aqueous phase
The ethanol concentration has a peak at the interface of the micelle, which is reminiscent of surfactants, but in contrast to a usual surfactant there is no sharp peak in the concentration profile. On both sides of the concentration maximum, the ethanol concentration decays slowly to a constant value. The decay in the liquid phase is approximately exponential with a decay length of length of 2.2 Å (see Fig. 6B). This decay appears without any force field tuning or ad hoc biasing of the simulation. It is a direct and natural consequence of the general mechanism of the primary hydration force near a hydrophilic interface, as proposed by Marcelja and Radic in 1974 (ref. 23) and confirmed experimentally in a very large corpus when lipids, proteins, latex, polysaccharide or even DNA are considered.24 The decay shown in Fig. 6B demonstrates that this general result is also valid for the case of micelles without surfactant. At first glance, octanol only appears as distinct clusters, but taking “bound” ethanol molecules also into account takes us close to a percolated bicontinuous network. In this case, one finds a fractal dimension of around 2. However, it should be noted that here we do not deal with particles with sharply defined edges, but surface–volume fractality is present, as defined by P. W. Schmidt,25 in which values beyond 1.7 correspond usually to infinite connectivity.Discussion and outlook
Our study gives a clear molecular view of the microemulsion-like properties of water-rich surfactant-free ternary systems octanol–ethanol–water: octanol forms aggregates that are swollen by ethanol, which is enhanced at the interface. The driving force for the octanol aggregation is the partial hydrophobic nature of octanol. This suggests a common mechanism for structure formation in a large class of ternary aqueous systems. Indeed, well-known solutions with microemulsion-like properties in the absence of surfactants are alcoholic beverages similar to ouzo, which contain rather hydrophobic components like anisole, which is a poorly water-soluble aromatic ether, as a third component. The fact that here (as in many other cases) the third, hydrophobic component is not a long-chain alcohol (or another type of a co-surfactant), makes us confident that the surface activity of octanol is not at the origin of the microemulsion-like behavior of the ternary mixture. In the presence of large amounts of ethanol all these solutions are thermodynamically stable, and it is common knowledge that the binodal stability curve is crossed upon the addition of water, causing the so-called “ouzo effect”:26 stable macroscopic droplets are formed and the formerly clear solution turns turbid. Other alcoholic beverages like whisky are known to have an increased flavor when diluted with water, which will drive the system into the pre-ouzo region, but any further dilution will induce phase separation. Antiseptic alcoholic solutions such as Synthol in France are in fact surfactant-free microemulsions. They are diluted and phase-separated when the mouthwash formulated as a structured pre-ouzo solution is mixed with saliva.This pre-ouzo to ouzo transition is a frequently observed phenomenon, usually upon dilution with water. By contrast, when moving into the other direction, i.e. into the region of an ordinary ternary solution, there is no phase transition, and the surfactant-free microemulsion aggregates gradually disappear when ethanol is added. This is likely due to the effect that the ethanol decay length becomes comparable to the radius of the octanol-rich aggregates and consequently the interface thickness becomes comparable to the inter-micellar distance.
Finally, it should be pointed out that the aggregates observed in our modeling study are distinct from “pre-micellar aggregates”, which are formed by many surfactants, bile salts, lipids, and amphiphilic proteins, and whose existence is a thermodynamic necessity.
After the characterization of the molecular properties of pre-ouzo aggregates, an obvious next step will be to investigate the gradual disappearance of these emerging micelles (or SFME) in favor of more classical micelles that are obtained upon gradual addition of surfactants to surfactant-free micellar solutions.
Methods
All simulations were carried out using the GROMACS 4.5 suite of programs.27 The simulation boxes contained a total of 8056 or 31![[thin space (1/6-em)]](https://www.rsc.org/images/entities/char_2009.gif) 970 molecules for the small or the large systems respectively, where the small systems contain 56 and the large one 224 octanol molecules. The boxes were cubic and the edge length ranges from 6.3 nm to 9.2 nm for the smaller systems, depending on the mole fraction of ethanol. For the large system, the edge length constitutes 11.2 nm.
970 molecules for the small or the large systems respectively, where the small systems contain 56 and the large one 224 octanol molecules. The boxes were cubic and the edge length ranges from 6.3 nm to 9.2 nm for the smaller systems, depending on the mole fraction of ethanol. For the large system, the edge length constitutes 11.2 nm.
Simulation box preparation
At first, boxes containing 56 (224) octanol molecules, distributed evenly throughout space, were generated for each system. In the same manner ethanol molecules were inserted and the box was subsequently filled with water. The configuration was minimized using a steepest descent algorithm until the maximum force was smaller than 10.0 kJ mol−1 nm−1. Subsequently the system was equilibrated for 100![[thin space (1/6-em)]](https://www.rsc.org/images/entities/char_2009.gif) 000 steps of 1 fs using the same parameters as for the production run (see next paragraph), but employing a Berendsen barostat.
000 steps of 1 fs using the same parameters as for the production run (see next paragraph), but employing a Berendsen barostat.
Simulation parameters
We used the OPLS/AA force field for ethanol,28 and for water the TIP4P2005 model29 was employed. For octanol, we used an optimized OPLS all-atom force field for long hydrocarbons (L-OPLS).30 We used a 1.0 nm long-range cutoff for Lennard-Jones interactions. Electrostatic interactions were accounted for applying the smooth particle mesh Ewald (PME) algorithm. The temperature was held constant at 300 K via the velocity rescaling algorithm and a Parrinello–Rahman barostat was used for pressure coupling at 1.0 bar and a compressibility of 4.5 × 10⁵. The time constant for both methods was 1.0 ps. All bond lengths were constrained to their equilibrium values using the LINCS algorithm. Periodic boundary conditions were applied in all directions. A leapfrog integrator with a time step of 2 fs was employed. The small systems were simulated for 200 ns, the big system was simulated for 550 ns.Trajectory analysis
The decision whether an octanol molecule is part of a clustered structure was made based on a distance criterion as implemented in the GROMACS tool g_clustsize. Two molecules are considered to be part of the same cluster whenever the distance between two of their atoms is smaller than 0.78 nm. For our analysis, the carbon atoms of octanol as well as the oxygen and its linked hydrogen were selected as a reference group. The first distinct minimum of the radial distribution function of all the atoms in the set for the case of phase separation (xE = 0) was chosen as the cutoff distance 0.78 nm. We note that this choice is not crucial, because a cutoff of 0.48 nm, where we find a weaker minimum in the radial distribution function, produces very similar results (see ESI†). The radial density distributions of any subset of atoms around the geometric center of a cluster of given size, averaged over the trajectory, were determined with a self-written program. The space around the center is divided into concentric spherical shells of adjustable width for each of which the number of atoms belonging to the considered group is evaluated.Comparison of MD results with X-ray scattering
The structure factor was calculated by the expression , in which the weights Γi,j were proportional to the product of the atomic numbers of the elements i and j. Calculations of the structure factor were done with nMoldyn.31 The scattering intensities were obtained by I(q) = S(q)f(q)2 with an approximate atomic form factor that was averaged from atomic form factor functions32 for all included atom types.
Scattering experiments
Small and wide-angle X-ray scattering (SWAXS) experiments were carried out on a bench built by Xenocs and using Mo radiation (λ = 0.71 Å). A large on-line scanner detector (MAR Research 345) located at 750 mm from the sample stage was used to record the scattered beam. A large q range (2 × 10⁻² to 2.5 Å−1) with q defined as was covered thanks to off-center detection (ϑ being the scattering angle). Collimation was applied using a 12
![[thin space (1/6-em)]](https://www.rsc.org/images/entities/char_2009.gif) :
:![[thin space (1/6-em)]](https://www.rsc.org/images/entities/char_2009.gif) ∞ multilayer Xenocs mirror (for Mo radiation) coupled to two sets of Forvis scatterless slits providing a 0.8 mm × 0.8 mm X-ray beam at the sample position. The experimental resolution is Δq/q = 0.05. Absolute intensities were obtained using either a 2.36 mm thick high-density polyethylene sample (from Goodfellow) as a calibration standard or water for which the level of scattering at low q is known (1.64 × 10⁻² cm−1) because it is proportional to the compressibility of the fluid. Data pre-analysis was performed using FIT2D software, taking into account the electronic background of the detector (the flat field being homogeneous), transmission measurements (using a photodiode that can be inserted upstream the sample) and empty cell subtraction. The scattering intensities were thus expressed versus the magnitude of scattering vector.
∞ multilayer Xenocs mirror (for Mo radiation) coupled to two sets of Forvis scatterless slits providing a 0.8 mm × 0.8 mm X-ray beam at the sample position. The experimental resolution is Δq/q = 0.05. Absolute intensities were obtained using either a 2.36 mm thick high-density polyethylene sample (from Goodfellow) as a calibration standard or water for which the level of scattering at low q is known (1.64 × 10⁻² cm−1) because it is proportional to the compressibility of the fluid. Data pre-analysis was performed using FIT2D software, taking into account the electronic background of the detector (the flat field being homogeneous), transmission measurements (using a photodiode that can be inserted upstream the sample) and empty cell subtraction. The scattering intensities were thus expressed versus the magnitude of scattering vector.
Acknowledgements
TZ thanks the Alexander von Humboldt Foundation for a Humboldt Award and the French–German L.E.A. “Sono” as well as ERC “Ree-cycle”. Supercomputing access was granted by the LRZ Munich (HLRB Project pr63ca). This work was supported by the CheMISyst excellence project (2012-2019).Notes and references
- F. M. Menger, Acc. Chem. Res., 1979, 12, 111 CrossRef CAS.
- P. A. Winsor, Trans. Faraday Soc., 1948, 44, 376 RSC.
- C. Tanford, J. Phys. Chem., 1972, 76, 3020 CrossRef CAS.
- D. F. Evans and H. Wennerström, The Colloidal Domain, Wiley-VCh, 1994 Search PubMed.
- J. N. Israelachvili, Intermolecular and Surface Forces, Academic Press, 3rd edn, 2011 Search PubMed.
- C. J. O'Connor, A. Aggett, D. R. Wiliams and R. A. Stanley, Aust. J. Chem., 1991, 44, 53 CrossRef CAS.
- G. N. Vriens and E. C. Medcalf, Ind. Eng. Chem., 1953, 45, 1098 CrossRef CAS.
- T. Bakır, I. Sönmezoğlu, F. Imer and R. Apak, J. Sci. Food Agric., 2013, 93, 2478 CrossRef PubMed.
- R. Zana, Adv. Colloid Interface Sci., 1995, 57, 1 CrossRef CAS.
- G. D. Smith, C. E. Donelan and R. E. Barden, J. Colloid Interface Sci., 1977, 60, 488 CrossRef CAS.
- M. L. Klossek, D. Touraud, T. Zemb and W. Kunz, ChemPhysChem, 2012, 13, 4116 CrossRef CAS PubMed.
- O. Diat, M. Klossek, D. Touraud, B. Deme, I. Grillo, W. Kunz and T. Zemb, J. Appl. Crystallogr., 2013, 46, 1665 CAS.
- S. E. Friberg, H. Hasinović, Q. Yin, Z. Zhang and R. Patel, Colloids Surf., A, 1999, 156, 145 CrossRef CAS.
- E. Caponetti, A. Lizzio, R. Triolo, W. L. Griffith and J. S. Johnson Jr, Langmuir, 1992, 8, 1554 CrossRef CAS.
- B. Hayter, M. Hayoun and T. Zemb, Colloid Polym. Sci., 1984, 262, 798 CAS.
- R. Auzély-Velty, F. Djedaïni-Pilard, S. Désert, B. Perly and T. Zemb, Langmuir, 2000, 16, 3727 CrossRef.
- J. B. Hayter and T. Zemb, Chem. Phys. Lett., 1982, 93, 91 CrossRef CAS.
- M. Tomsic, G. Fritz-Popovski, L. Vlcek and A. Jamnik, Acta Chim. Slov., 2007, 54, 484 CAS.
- B. Chen and J. I. Siepmann, J. Am. Chem. Soc., 2000, 122, 6464 CrossRef CAS.
- T. Zemb, L. Belloni, M. Dubois, A. Aroti and E. Leontidis, Curr. Opin. Colloid Interface Sci., 2004, 9, 74 CrossRef CAS PubMed.
- W. Kunz, L. Belloni, O. Bernard and B. W. Ninham, J. Phys. Chem. B, 2004, 108, 2398 CrossRef CAS.
- B. Cabane, R. Duplessix and T. Zemb, J. Phys., 1985, 46, 2161 CAS.
- S. Marcelja and N. Radic, Chem. Phys. Lett., 1976, 42, 129 CrossRef CAS.
- V. A. Parsegian and T. Zemb, Curr. Opin. Colloid Interface Sci., 2011, 16, 618 CrossRef CAS PubMed.
- H. D. Bale and P. W. Schmidt, Phys. Rev. Lett., 1984, 53, 596 CrossRef CAS.
- S. Vitale and J. Katz, Langmuir, 2003, 19, 4105 CrossRef CAS.
- B. Hess, C. Kutzner, D. van der Spoel and E. Lindahl, J. Chem. Theory Comput., 2008, 4, 435 CrossRef CAS.
- W. L. Jorgensen, D. S. Maxwell and J. Tirado-Rives, J. Am. Chem. Soc., 1996, 118, 11225 CrossRef CAS.
- J. L. F. Abascal and C. Vega, J. Chem. Phys., 2005, 123, 234505 CrossRef CAS PubMed.
- S. W. I. Siu, K. Pluhackova and R. A. Böckmann, J. Chem. Theory Comput., 2012, 8, 1459 CrossRef CAS.
- K. Hinsen, E. Pellegrini, S. Stachura and G. R. Kneller, J. Comput. Chem., 2012, 33, 2043 CrossRef CAS PubMed.
- W. Muhammad and S. H. Lee, PLoS One, 2013, 8, e69608 CAS.
Footnote |
| † Electronic supplementary information (ESI) available. See DOI: 10.1039/c4sc00153b |
| This journal is © The Royal Society of Chemistry 2014 |

