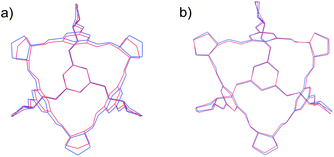
 Open Access Article
Creative Commons Attribution 3.0 Unported Licence
Predicted crystal energy landscapes of porous organic cages†
Edward O.
Pyzer-Knapp
a,
Hugh P. G.
Thompson
a,
Florian
Schiffmann
b,
Kim E.
Jelfs
c,
Samantha Y.
Chong
d,
Marc A.
Little
d,
Andrew I.
Cooper
d and
Graeme M.
Day
*e
aDepartment of Chemistry, University of Cambridge, Cambridge, CB2 1EW, UK
bDepartment of Materials, ETH Zürich, CH-8093 Zürich, Switzerland
cDepartment of Chemistry, Imperial College London, South Kensington, London, SW7 2AZ, UK
dDepartment of Chemistry and Centre for Materials Discovery, University of Liverpool, Liverpool, L69 7ZD, UK
eSchool of Chemistry, University of Southampton, Highfield, Southampton, SO17 1BJ, UK. E-mail: G.M.Day@soton.ac.uk
First published on 11th March 2014
Abstract
In principle, the development of computational methods for structure and property prediction offers the potential for the in silico design of functional materials. Here, we evaluate the crystal energy landscapes of a series of porous organic cages, for which small changes in chemical structure lead to completely different crystal packing arrangements and, hence, porosity. The differences in crystal packing are not intuitively obvious from the molecular structure, and hence qualitative approaches to crystal engineering have limited scope for designing new materials. We find that the crystal structures and the resulting porosity of these molecular crystals can generally be predicted in silico, such that computational screening of similar compounds should be possible. The computational predictability of organic cage crystal packing is demonstrated by the subsequent discovery, during screening of crystallisation conditions, of the lowest energy predicted structure for one of the cages.
Introduction
Micropores, defined as pores with width smaller than 2 nm,1 can lead to chemically interesting properties because pores of molecular dimensions can interact in specific ways with guest molecules. This can be exploited in applications such as gas storage, molecular separations and heterogeneous catalysis. To date, research on microporous crystals has focussed on network solids such as zeolites, metal–organic frameworks (MOFs), polymers and covalent organic frameworks (COFs). Recently, however, there has been significant activity in the area of organic porous molecular crystals.2,3 Molecular crystals can have permanent porosity deriving from an intrinsic internal void within the molecule, from extrinsic voids resulting from inefficient molecular packing, or both. The current record for Brunauer–Emmett–Teller surface area for a porous molecular material is 3758 m2 g−1, demonstrating the potential for porous molecules to compete with porous networks.4While the design of MOFs has become increasingly modular and directed through the application of reticular chemistry, the discovery of porous molecular crystals has tended to rely as much on serendipity as rational design. This is because porosity depends on the relative arrangement of molecules in the crystal structure, which is determined by relatively weak intermolecular interactions whose optimal arrangement is less predictable than the strong, directional covalent or coordination bonds that determine network crystals. The prediction of molecular crystal structures, given nothing more than a description of atomic connectivity, is a rapidly advancing field, as seen in the regular blind tests of crystal structure prediction5–8 and by reports of successful applications of such methods to large, flexible molecules.8–11 Recently, we have demonstrated that computational methods correctly predict the crystal packing of several single-component crystal structures and binary cocrystal structures of porous organic cages,12 suggesting a computational route to the design of new functional materials. This would allow one to predict which molecules will form a porous material, and provides the opportunity for in silico property screening to guide synthetic effort.
Here, we study four chiral imine-linked tetrahedral cages (Fig. 1), which are synthesised by a [4 + 6] condensation of trialdehydes with vicinal diamines. The arene faces of the cage leave four roughly triangular windows opening into the empty intrinsic void of the molecules. The connectivity of the resulting prefabricated voids is, therefore, determined by the alignment of windows on adjacent molecules in their crystal structures. Window-to-window packing connects the void space, resulting in a porous network, while a window-to-arene arrangement results in pockets of isolated void space, and a formally non-porous crystal.
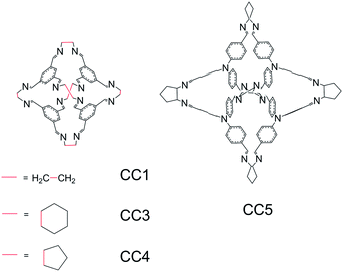 | ||
| Fig. 1 The molecular structures of cages CC1, CC3, CC4 and CC5. The molecular numbering is as used in previous work.12,13 | ||
The simplest of the cages studied here (CC1) is synthesized from 1,3,5-triformylbenzene and 1,2-ethylenediamine. Cyclohexane and cyclopentane substituted diamines lead to the functionalisation of the cage vertices (CC3 and CC4, respectively; Fig. 1). Of this series of cages, CC2, with a single methyl group on each ethylene vertex, is omitted because the observed crystal structure is a disordered mixture of isomers, which complicates structure prediction. We also include CC5, which is formed using a larger aldehyde, tri(4-formylphenyl)amine, in place of the single arene ring on the face of the smaller cages; the resulting internal volume is much larger than that enclosed by CC1 (143.4 Å3vs. 37.9 Å3).12
Crystallisation of each of these cages yields structures with solvent located within the voids. The solvent can, however, be removed easily and desolvated crystal structures of each of these molecules have been reported. A helical chirality, deriving from the chirality of the diamine starting materials, allows the construction of R and S enantiomers of these cages. Where spontaneous resolution of cage enantiomers does not occur, both racemic and non-racemic crystal structures are known, the latter grown from enantiomerically pure solutions.
Functionalisation of the cage vertices has been shown to direct the crystal packing, and hence the resulting porosity and adsorption properties of these organic cage molecules.12,13 This is a subtle effect, with small changes to the vertex functionalisation usually causing a large change in the preferred packing mode. For example, while CC1–CC4 differ only in their vertex functionality, they exhibit remarkably diverse crystal structures. CC1 can be crystallised as a non-porous polymorph or a polymorph that connects the cage pores into helical channels; CC2 displays extrinsic 1-D channels that are disconnected from the isolated cage pores; and CC3 forms an intrinsic diamondoid 3-D connected void network in both enantiomerically pure and racemic forms.13CC4 packs with 3-D connected diamondoid pores in racemic form, but has a low-symmetry crystal structure with a complex pore network when enantiomerically pure.14
The vertex-directed topology of void space provides an opportunity for design, provided that the relationship between molecular structure and crystal packing is generally predictable. Our goal here is to test the generality of our approach to structure prediction,12 to establish the sensitivity of the predictions to the computational model and to assess the information gained by analysis of the energy landscapes of these materials.
Computational methods
Global lattice energy minimisation has been applied to predict the crystal structures of four organic cages, CC1,15CC3,13CC414 and CC5.12 All calculations are performed on the pure cage structures, with no solvent included.The calculations involve the following steps:
1. Possible conformers of the isolated molecules are generated and their energies are evaluated, to assess which molecular conformers are most likely to be adopted in the crystal structures.
2. Molecular geometries of the lowest energy conformations are optimised using density functional theory (DFT).
3. Hypothetical crystal packings are generated using this DFT optimised molecular geometry and lattice energy minimised using an isotropic atom–atom model potential.
4. A low energy subset of these crystal structures is lattice energy minimised using an atom–atom potential with anisotropic electrostatics.
In steps 3 and 4, the molecule is constrained to be rigid at the DFT-optimised geometry by optimising only with respect to unit cell parameters, molecular positions and orientations. For comparison with the rigid-molecule, atom–atom potential results, a smaller subset of these structures is lattice energy minimised using dispersion-corrected solid-state DFT.
Conformational analysis
A low mode conformer search16 was performed for each cage molecule. This method searches for new conformations by distorting the molecular geometry along its low-energy normal modes, followed by local energy minimisation. We have previously employed this method to generate initial molecular conformations for subsequent crystal structure prediction of pharmaceutical molecules17 and to explore the conformational landscape of organic cage molecules.18 The starting conformation for each molecule was generated from a 1D SMILES molecular identifier using the Avogadro chemical editor.19 Searches consisted of 10![[thin space (1/6-em)]](https://www.rsc.org/images/entities/char_2009.gif) 000 search steps, with minimum and maximum move distances of 3 and 12 Å. The energy evaluations and geometry optimisations were performed using the OPLS-AA force field20 with convergence criteria of 0.05 kJ mol−1 Å−1 on gradients. The lowest energy conformers of each molecule were refined by DFT re-optimisation, using the B3LYP functional and 6-31G** basis set, using the Gaussian03 package.21
000 search steps, with minimum and maximum move distances of 3 and 12 Å. The energy evaluations and geometry optimisations were performed using the OPLS-AA force field20 with convergence criteria of 0.05 kJ mol−1 Å−1 on gradients. The lowest energy conformers of each molecule were refined by DFT re-optimisation, using the B3LYP functional and 6-31G** basis set, using the Gaussian03 package.21
Crystal structure search
Hypothetical crystal structures were generated using the Monte Carlo simulated annealing algorithm,22–24 as implemented in the Materials Studio package.25 The molecular geometry is held rigid at the B3LYP/6-31G** geometry during the Monte Carlo simulations and subsequent force field based lattice energy minimisations. Intermolecular interactions at this stage of the prediction calculations were modelled using the COMPASS force field.26We considered the eight most commonly observed Sohnke space groups for enantiopure crystal structures (P21, P212121, P1, C2, P41212, C2221, P21212, and R3) and eight space groups for racemic structures (P21/c, P![[1 with combining macron]](https://www.rsc.org/images/entities/char_0031_0304.gif) , C2/c, Pbca, Pnma, Pbcn, Pna21, and Cc). All space groups were searched with one molecule in the asymmetric unit (Z′ = 1), apart from cage CC1, where some limited searching was also performed with two independent molecules. For symmetric molecules, higher symmetry space groups with Z′ < 1 are located during the search by fortuitous alignment of molecular point group and space group symmetry elements.
, C2/c, Pbca, Pnma, Pbcn, Pna21, and Cc). All space groups were searched with one molecule in the asymmetric unit (Z′ = 1), apart from cage CC1, where some limited searching was also performed with two independent molecules. For symmetric molecules, higher symmetry space groups with Z′ < 1 are located during the search by fortuitous alignment of molecular point group and space group symmetry elements.
Due to the stochastic nature of the search method, multiple simulated annealing runs were performed in each space group, starting from different random seeds. We considered the search to be complete when each low energy crystal structure was located multiple times.
Lattice energy minimisation
All crystal structures within 40 kJ mol−1 of the global minimum after the crystal structure search were lattice energy minimised using an anisotropic atom–atom potential within the program DMACRYS.27 The molecular geometry was kept rigid during these calculations. Electrostatic interactions were modelled using an atomic multipole description of the molecular charge distribution; multipoles up to hexadecapole were calculated from the B3LYP/6-31G** calculated charge density using the original distributed multipole analysis (DMA) algorithm.28 Atom–atom repulsion and dispersion interactions were modelled using the W99 intermolecular potential.29 Charge–charge, charge–dipole and dipole–dipole interactions were calculated using an Ewald summation, while all other intermolecular interactions were summed to a 30 Å cutoff between molecular centres-of-mass.‡ Clustering was performed at this stage to remove duplicate crystal structures, using the COMPACK algorithm.30For comparison with the atom–atom potential results, and to examine the influence of distortions in the molecular geometry away from the isolated molecule structure, the ten lowest energy crystal structures were re-optimised using periodic DFT, allowing full relaxation of each structure (i.e. unit cell and atomic coordinates). These calculations were performed using CP2K31 at the PBE/TZVP-MOLOPT32 level of theory with the D3 Grimme dispersion correction33 and a plane wave energy cutoff of 280 Ry.
Results
Conformational analysis
Conformational analysis is used to inform the choice of which molecular geometries must be considered during trial crystal structure generation. For all four molecules, the most stable predicted conformation displays tetrahedral symmetry (point group T) with a C3 axis through each aryl face of the cage, so that all three imines point in the same direction around this axis. For all four molecules, these predicted conformations very accurately reproduce the molecular geometry found in the observed crystal structures (Table 1). To obtain a complete picture of all crystal packing possibilities, a range of the lowest energy molecular conformations must sometimes be considered, where intermolecular interactions in the crystal are able to make up for a higher intramolecular energy.9,34| Cage | Energy difference between the two lowest energy conformations (kJ mol−1) | RMSD in atomic positions (Å) between the lowest energy predicted conformation and the experimental crystallographic molecular structurea | ||
|---|---|---|---|---|
| FF | DFT | FF | DFT | |
| a Root mean squared deviations (RMSD) are calculated between calculated and observed molecular geometries excluding hydrogen atoms. The experimentally determined crystal structure used in each comparison is given in parentheses. R and RS refer to enantiomerically pure and racemic crystal structures. | ||||
| CC1 | 13.42 | 17.23 | 0.22 (α′), 0.15 (β′) | 0.16 (α′), 0.20 (β′) |
| CC3 | 22.18 | 25.82 | 0.12 (3-R), 0.11 (3-RS) | 0.14 (3-R), 0.13 (3-RS) |
| CC4 | 24.08 | 27.49 | 0.25 (4-R), 0.18 (4-RS) | 0.28 (4-R), 0.12 (4-RS) |
| CC5 | 13.24 | 25.45 | 0.54 | 0.33 |
For all four cages, the results of the conformer search demonstrate large energy differences between the most stable conformations (Table 1). All four molecules maintain their internal cavity in all low energy conformations; hence, it is predictable from the conformer search that these molecules form ‘open’, shape-persistent structures. According to DFT calculations, CC1 displays the smallest calculated energy difference between the second lowest energy conformation and the global minimum conformation (17.2 kJ mol−1). The corresponding energy difference is significantly larger (between 25.5 and 27.5 kJ mol−1) for all of the other cages.
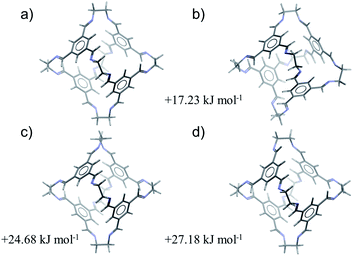
Therefore, of the four molecules studied here, CC1 is predicted to be the most likely to adopt a non-tetrahedral molecular geometry. The four lowest energy conformations of CC1, excluding conformational enantiomers, are shown in Fig. 2. The global minimum energy conformation (Fig. 2a) displays the highest symmetry, point group T, while the next three conformations (Fig. 2b–d) are related by flipping the direction of the imines and/or rotation about the vertex carbon–carbon single bond. The third and fourth conformations involve rotation of a single vertex (Fig 2c) or flipping the direction of a single imine (Fig. 2d). Either distortion on its own introduces significant strain that is partly relieved by a combination of imine flips and carbon–carbon bond rotation in three of the vertices, producing the second lowest energy conformer (Fig. 2b). Only one of the C3 axes is maintained in the resulting distorted cage geometry (Fig. 2b), but these changes incur a relatively small increase in conformational energy of 17.2 kJ mol−1. Both of the lowest energy conformations have been observed in crystal structures of CC1 and the predicted conformations reproduce the molecular geometries in the crystal structures with good accuracy (Table 1): the lowest energy tetrahedral conformation is seen in all of the known solvated and desolvated CC1 crystal structures, while one known CC1 solvate crystal structure (β) contains a 1![[thin space (1/6-em)]](https://www.rsc.org/images/entities/char_2009.gif) :
:![[thin space (1/6-em)]](https://www.rsc.org/images/entities/char_2009.gif) 1 mixture of T and C3 conformers. Previous work has calculated that the lowest barrier to imine bond rotation is between 26 and 32 kJ mol−1 and that this barrier is reduced when explicit solvent molecules of DCM are considered.35 In combination, these results provide a rationalisation as to why this cage exhibits conformational polymorphism, and why these forms can interconvert in the presence of DCM molecules.
1 mixture of T and C3 conformers. Previous work has calculated that the lowest barrier to imine bond rotation is between 26 and 32 kJ mol−1 and that this barrier is reduced when explicit solvent molecules of DCM are considered.35 In combination, these results provide a rationalisation as to why this cage exhibits conformational polymorphism, and why these forms can interconvert in the presence of DCM molecules.
The cyclic substituents at the vertices of CC3 and CC4 prevent rotation of the vertex carbon–carbon bond, because this would lead to a diaxial arrangement of these hydrocarbon rings. As a consequence, the CC3 and CC4 equivalents of the second and third conformations of CC1 are not possible. Instead, the second lowest energy conformations of CC3 and CC4 are analogous to CC1's fourth lowest energy conformation, with a similar relative energy (Table 1 and Fig. S1 and S2†). The different structure of the starting tri-aldehyde for CC5 leads to significant changes in the conformational landscape: here, the second lowest energy conformation relates to a reversal of the tilt angles of the aromatic rings on a single face (Fig. S3†).
All known crystal structures of CC3, CC4 and CC5 consist of the lowest energy, tetrahedral conformation, and the crystalline molecular geometries are reproduced very well by the predictions (Table 1).
Due to the large energy separating the second lowest energy conformation from the global minimum for all four molecules, only the lowest energy conformation of each molecule was considered in the crystal structure searches.
Crystal structure prediction results
We first focus on the results of the crystal structure prediction calculations after step 4 of the methodology (rigid molecule lattice energy minimisation using anisotropic atom–atom potentials) to evaluate the overall success of this relatively inexpensive computational approach.Chiral versus racemic structures
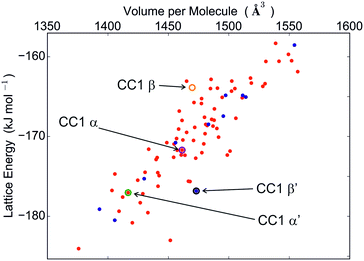
The calculated crystal energy landscapes of CC1, CC3, CC4 and CC5 are summarised in Fig. 3, 5, S4 and S5 (ESI†). For these chiral molecules, we first examine the predicted relative stabilities of racemic and enantiomerically pure crystal structures. The outcome influences the chirality of the pore structure and could affect, for example, adsorption selectivity for chiral guest molecules.The energy landscape of CC1 crystal structures shows that this molecule lacks a strong preference between racemic and enantiomerically pure packing: both possibilities are found in the low energy region (Fig. 3), in which the structures are separated by energy differences of 1 kJ mol−1 or less. This molecule has the ability to switch enantiomers in solution12 and is the most isotropic or ‘spherical’ of the cages, and it therefore has the potential for low energy molecular rearrangements. Coupled with the fine energetic balance predicted here, it is unsurprising that CC1 is observed to form both racemic and enantiopure polymorphs that can be readily interconverted in the solid state.15
Functionalisation of the cage vertices opens up an energy gap between racemic and enantiopure crystal packing possibilities. Our previous studies found strong but opposite preferences for CC3 and CC5:12 the computed energy landscape for CC3 predicts a strong preference for heterochiral packing, with the difference between the lowest energy predicted racemate and the lowest energy predicted enantiopure structure (ΔERS–R) calculated as −32.2 kJ mol−1 (Fig. S4†). In contrast, predictions for CC5 show an equally strong preference for homochiral packing (ΔERS–R = +33.25 kJ mol−1, see Fig. S5†). These results agree with experimental observations: CC5 undergoes spontaneous resolution, so that only enantiomerically pure crystals can be formed, even from a racemic solution, whereas CC3 forms a racemic crystal structure from racemic solutions.
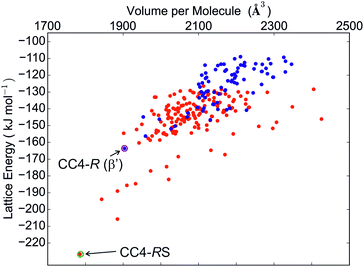
Much like CC3, its closely related analogue, CC4, shows a strong preference for a racemic packing, with the difference in the lowest energy predicted racemic and enantiomerically pure crystal structures being in the region of 60 kJ mol−1 (Fig. 5). The experimental observation that a racemic crystal structure is formed unless CC4 is prepared in an enantiomerically pure form agrees with this prediction.
Overall, comparison of the computational results with observed crystallisation behaviour demonstrates that the chiral recognition of these molecules is predictable, de novo. The contrasting chiral recognition behaviour of CC5 with respect to CC3 and CC4, and the lack of a strong preference for homo- or heterochiral packing for CC1, are not intuitively obvious from the molecular structures of these cages. Nevertheless, the calculated crystal energy landscapes predict with confidence whether the opposite enantiomers of these molecules will spontaneously resolve or co-crystallise.
Prediction of the observed crystal structures
The crystal structures of CC3 are predicted successfully: the global energy minimum in all space groups for CC3 corresponds to the known racemic structure, CC3-RS, which was predicted in space group Cc, but shows the full observed space group symmetry (Fd![[3 with combining macron]](https://www.rsc.org/images/entities/char_0033_0304.gif) ) after analysis with PLATON.36 Considering predicted structures only in chiral space groups, the lowest energy predicted structure corresponds to the observed (space group F4132) chiral structure, CC3-R, that is obtained by crystallisation from an enantiomerically pure solution. The two structures are reproduced to high accuracy; the root mean squared deviations in atomic positions in 15-molecule clusters taken from the predicted and observed crystal structures (RMSD15) are 0.418 and 0.377 Å for CC3-RS and CC3-R, respectively, excluding hydrogen atoms (see Fig. S7†). The results are equally good for CC5: the predicted global minimum in lattice energy accurately reproduces the observed chiral crystal structure, with an RMSD15 deviation in atomic positions of 0.232 Å from the experimental structure (see overlay in Fig. S8†).
) after analysis with PLATON.36 Considering predicted structures only in chiral space groups, the lowest energy predicted structure corresponds to the observed (space group F4132) chiral structure, CC3-R, that is obtained by crystallisation from an enantiomerically pure solution. The two structures are reproduced to high accuracy; the root mean squared deviations in atomic positions in 15-molecule clusters taken from the predicted and observed crystal structures (RMSD15) are 0.418 and 0.377 Å for CC3-RS and CC3-R, respectively, excluding hydrogen atoms (see Fig. S7†). The results are equally good for CC5: the predicted global minimum in lattice energy accurately reproduces the observed chiral crystal structure, with an RMSD15 deviation in atomic positions of 0.232 Å from the experimental structure (see overlay in Fig. S8†).
Like all of the cage molecules studied here, the CC3 and CC5 crystal structures encapsulate solvent when grown. No significant rearrangement of the CC3 or CC5 molecules is observed upon desolvation of these crystals and the computational results, which ignore solvent inclusion in the structures, demonstrate that the observed crystal structures correspond to the lowest energy arrangement of the pure cage molecules. We conclude that, in these cases, the inclusion of solvent molecules during crystal growth has no structure-directing influence on the arrangement of the cages.
Both desolvated forms (α′ and β′) were located among the predicted structures and are geometrically reproduced quite well (Fig. 4). However, these are not the lowest energy calculated structures: α′ and β′ are ranked 11 and 12, respectively, in the energy-ranked list of predicted structures, 7.0 and 7.2 kJ mol−1 above the global minimum (Fig. 3).
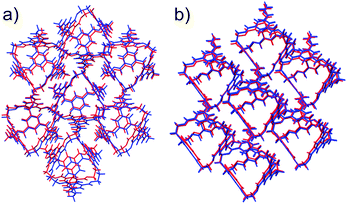 | ||
| Fig. 4 Overlays of experimental (red) and predicted (blue) CC1 polymorphs α′ (a) and β′ (b), showing the best attainable overlay of 15 molecule clusters, with RMSD15 = 0.697 Å (α′) and 0.393 Å (β′). | ||
It has been observed previously that the frameworks of crystalline solvates correspond to local energy minima on the lattice energy surface, and are therefore predictable,37 even when the solvate is unstable to desolvation. We find the same here: the cage molecule framework for the α solvate is located among the predictions, albeit at a much higher energy (structure #33, 12.3 kJ mol−1 above the global minimum).
The β dichloromethane solvate structure, with two independent CC1 molecules of different conformation in the asymmetric unit, could not have been found in our Z′ = 1 crystal structure searches. To test whether the β solvate framework could have been predictable, if the search had been more comprehensive, additional searches were performed with two molecules in the asymmetric unit in the observed space group (see ESI†). The lowest energy structure with one of each CC1 conformer matches the experimentally observed β framework very well, with an RMSD15 of 0.398 Å (Fig. S6†), demonstrating that this solvate framework would have been located if our search had been more extensive in terms of conformations and Z′. The total energy of this structure, including the relative intramolecular energy of the C3 conformer, is 20.2 kJ mol−1 above the Z′ = 1 global minimum (Fig. 3), indicating that the solvent must have an important stabilising role.
Indeed, crystallisation of a racemic solution of cage CC4 leads to a racemic crystal (space group Fd![[3 with combining macron]](https://www.rsc.org/images/entities/char_0033_0304.gif) ) with molecules in a window-to-window arrangement,14 and this structure is accurately reproduced by the predicted global lattice energy minimum (RMSD15 = 0.379 Å, see Fig. 6).
) with molecules in a window-to-window arrangement,14 and this structure is accurately reproduced by the predicted global lattice energy minimum (RMSD15 = 0.379 Å, see Fig. 6).
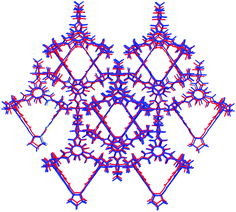 | ||
| Fig. 6 Overlay of experimental (red) and predicted (blue) CC4-RS racemic structures. The overlays show the lowest attainable RMSD when overlaying a cluster of 15 molecules (RMSD15 = 0.379 Å). | ||
The predictions also suggest that crystallisation of the pure enantiomer, CC4-R, should have similar behaviour to CC3-R: the global minimum, enantiomerically pure crystal structures of CC4-R and CC3-R are nearly isostructural, with a porous window-to-window molecular arrangement and 3-D pore structure. However, the observed crystallisation behaviour of CC4-R is more complex:14 a trigonal (space group R3, Z′ = 1) methanol solvate is formed from the reaction mixture, in which CC4 molecules pack in a window-to-arene arrangement. Desolvation results in rearrangement into a lower symmetry P3 structure with three symmetrically independent molecules (Z′ = 3), while maintaining the window-to-arene packing. This behaviour indicates that the solvent molecules included during crystal growth are important in determining the structure of the CC4-R solvate.
With multiple independent molecules, the structure of the CC4-R desolvate is outside of the scope of the crystal structure prediction calculations that we have performed here. Surprisingly, we also do not find the R3 Z′ = 1 cage packing seen in the methanol solvate among the final set of predicted structures. To explore these structures further, lattice energy calculations were performed on the experimentally determined crystal structures, both with the observed molecular geometry and with the molecule replaced by the DFT optimised geometry used in the prediction calculations.
While the optimised geometry used in the predictions does not differ greatly from the molecular geometry found in these crystal structures, these small conformational differences have a dramatic effect on the calculated energy (Table 2). With the observed molecular geometry, both observed crystal structures result in more stabilising intermolecular interactions than the best predicted crystal structure; the improved intermolecular interactions will be partly balanced by increased intramolecular energy, and this is explored further below. The most interesting finding is that neither of these crystal packing arrangements can accommodate the DFT optimised molecular geometry: the resultant solvate framework energy is very high and, in the case of the desolvate, the optimised molecular geometry led to intermolecular clashes that prevented successful lattice energy minimisation.
| Structure | Intermolecular energy/kJ mol−1 |
|---|---|
| a The optimised molecular structure pasted into the Z′ = 3 crystal packing results in clashing of atoms, preventing lattice energy minimisation. | |
| Z′ = 1 CC4-R solvate framework | |
| Observed molecular geometry | −171.00 |
| Optimised molecular geometry | −113.60 |
| Z′ = 3 CC4-R desolvate | |
| Observed molecular geometry | −196.82 |
| Optimised molecular geometry | —a |
| Lowest energy predicted structure | −163.61 |
Analysis of the crystal packing reveals close intermolecular contacts of three of the four arene faces with the cyclopentyl groups on neighbouring molecules. This leads to a slight compression of the cage as a whole, as well as bending of the cyclopentyl groups away from the intermolecular contact (Fig. 8a). These results demonstrate a failure of the rigid molecule approximation used in crystal structure prediction of these molecules to date. Below, we explore this further using solid-state DFT calculations.
Insight from the predicted energy landscapes
The window-to-window packing motif is important in this family of molecules, as this arrangement forms a connected 3-D network of void space involving the pores within the cage molecules. However, the window-to-window motif is not observed in the crystal structures of all of the cages. Since the structure prediction calculations generate all possible packing possibilities and their relative stabilities, at least within the space groups considered, the results allow us to examine how small changes in molecular structure influence the balance between competing packing possibilities.For the largest cage, CC5, by far the lowest energy packing possibility is the enantiomerically pure structure with all cages in a homochiral window-to-window arrangement. The next lowest energy structure is a racemate in which each cage forms two homochiral (R:R) and two heterochiral (R:S) window-to-window interactions. The enantiomerically pure structure is calculated to be much lower in energy than any other, but there are alternative packings close in energy to the window-to-window racemate (Fig. S5†). This shows that it is the greater stability of the homochiral window-to-window arrangement compared to other packings that drives CC5 to form a chiral, porous structure.
CC1, CC3 and CC4 form a series with the same core molecular structure. The striking difference in their calculated energy landscapes is in the energy gaps between crystal structures: while the global minima for CC3 and CC4 are approximately 20 kJ mol−1 more stable than the next structure, we find 70–80 distinct crystal structures in a 20 kJ mol−1 energy range from the CC1 global minimum. This number of structures in a small energy range is typical of many organic molecules, and demonstrates that no single arrangement of CC1 molecules is preferred. Indeed, many relative arrangements of the CC1 molecules are found in the low energy structures: arene-to-window packing is particularly common, as is penetration of the ethane vertices into a neighbouring cage window. However, perfect alignment of windows on neighbouring cages is absent from any of the low energy predicted CC1 crystal structures: a structure in which all CC1 molecules are of the same handedness, and all cage windows are aligned to a neighbouring cage window, is 49 kJ mol−1 above the global minimum, while an analogous structure with half the molecules in each enantiomer is a further 21 kJ mol−1 higher in energy. Interestingly, window-to-window alignment was found to be relatively uncommon with respect to window-to-vertex or window-to-arene alignment for adjacent cage pairs in amorphous models of CC1, suggesting that this packing mode is an inherent preference that does not only apply to the crystalline state.38
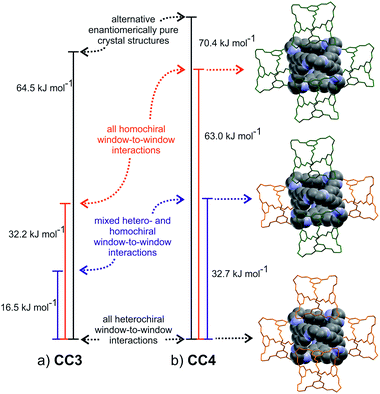
In contrast, the predicted structures of CC3 show a strong preference for packing in a window-to-window arrangement. There are no other crystal packing possibilities of enantiomerically pure CC3 within 30 kJ mol−1 of the lowest energy CC3-R structure (Fig. S4†), which displays homochiral window-to-window packing on all four windows of each cage (Fig. 7a). There is a similar ∼30 kJ mol−1 energy difference between other predicted racemic structures and the CC3-RS global minimum, in which all four cage windows form heterochiral window-to-window interactions. One structure sits midway between the CC3-RS global minimum and the rest of the predicted structures, and this displays an alternative window-to-window packing: each cage forms two heterochiral window-to-window connections along with two homochiral window-to-window connections (Fig. 7a). So far, this packing mode has not been observed experimentally. It is clear that the interlocking of cage windows is strongly preferred over any other cage–cage interaction and the energy penalty for swapping one heterochiral for a homochiral window-to-window interaction is approximately 8 kJ mol−1.
Comparison of the CC3 and CC1 energy landscapes shows the important role of the cage vertex in directing the crystal packing: the bulky cyclohexyl vertex leads to the strong preference for window-to-window packing in CC3 and the resulting large energy gaps lead to a robust porous structure, that possibly aids in stabilizing crystalline CC3, for example, to the extent that it can be boiled in water with no effect on the structure.39 The cyclopentyl vertex groups on CC4 are of similar steric bulk and, unsurprisingly, racemic CC4-RS also shows a marked preference for window-to-window packing: this porous packing, in which all window-to-window connections are heterochiral, is observed in the global minimum energy structure.
The same three window-to-window structures that appear on the CC3 energy landscape are also seen for CC4 (Fig. 7b). However, the energy of CC4 homochiral window-to-window packing relative to heterochiral is predicted to be approximately double that found for CC3. This is important because the stability of alternative CC4 packing possibilities relative to the racemic global minimum is similar to that found for CC3. The overall effect is that the window-to-window packed enantiomerically pure CC4-R is raised sufficiently high in the energy landscape such that other crystal packing possibilities for the enantiomerically pure system become energetically competitive (Fig. 5). These alternative packing possibilities show a variety of packing motifs, including window-to-window, arene-to-window, and offset arene–window arrangements of the molecules. Hence, the calculated energy landscapes help explain why racemic CC3 and CC4 are isostrucural, while the enantiomerically pure CC4 behaves differently from CC3. The more complex behaviour of CC4-R stems, at least in part, from less favourable homochiral interlocking of cage windows.
Re-ranking after DFT-D re-optimisation
A major approximation made in the calculations thus far is to constrain the molecular geometry in the solid state to that of the isolated (gas phase) molecule. This rigid-molecule approximation avoids having to treat the complex conformation-dependence of the atomic multipole model, which provides accurate intermolecular electrostatics in the force field calculations. Furthermore, force field methods typically do not provide a sufficiently accurate description of intramolecular interactions for the prediction of crystal structures of flexible molecules. However, it is clear from the results for CC4 that the rigid-molecule constraints limit the reliability of the predictions, both in terms of locating all relevant structures and ranking their relative stabilities.Dispersion-corrected solid-state DFT has been very successful in crystal structure prediction of smaller organic molecules40 and we have applied such calculations here, allowing full flexibility of the predicted crystal structures during lattice energy minimisation. Due to the computational expense, we limit these calculations to the 10 lowest energy predicted crystal structures for each system.
The molecular geometry was compared in each of these DFT-D optimised crystal structures to the calculated geometry of the isolated molecule, as used in the crystal structure prediction (Table S1†). The RMS geometric changes in molecular structure are largest for CC5, where the mean RMSD over 10 crystal structures is 0.09 Å, about 50% larger than the mean RMSD of the molecular structure in CC1, CC3 and CC4 crystal structures. This leads to changes in CC5 relative lattice energies of up to 30 kJ mol−1 (Fig. S9†), which is not enough to change the global minimum structure. DFT-D geometry optimisation also leads to some reordering of the higher energy structures on the CC3 landscape, but the global minimum CC3-RS and CC3-R structures remain unchanged from the force field-based calculations.
In the solvate and desolvated crystal structures of enantiomerically pure CC4-R, close intermolecular contacts in the crystal structure distort the molecular geometry and we found (Table 2) that the optimised isolated molecule geometry is unable to pack in the observed crystal packing without introducing high energy intermolecular clashes. The DFT-D results on the 10 lowest energy CC4-RS and CC4-R crystal structures would have given a warning of the importance of molecular flexibility for this molecule: while the mean RMS changes in molecular geometry during DFT-D lattice energy minimisation are only marginally larger than for CC3, there are several individual CC4 crystal structures in which the molecular geometry changes by much more than in any of the CC3 structures (Table S1†).
The DFT-D calculations do not lead to significant re-ranking of the CC4-RS crystal structures (Fig. S9†). It is the effect on the observed CC4-R structures that demonstrates the importance of treating this molecular flexibility during crystal structure prediction: DFT-D geometry optimisation of the solvate framework, which was very high on the rigid-molecule crystal energy landscape, brings the energy of this structure much closer to the most stable predicted structures (Table 3 and Fig. S9†). Comparison of the molecular geometry to that in the observed crystal structure (Fig. 8b) shows very good agreement and an important improvement over assuming the isolated molecule's geometry (Fig. 8a). Furthermore, DFT-D lattice energy minimisation of the CC4-R desolvate (the structure with three independent molecules in the asymmetric unit) leads to a lower energy structure than any of the Z′ = 1 predictions (Table 3).
| Structure | Relative energy/kJ mol−1 |
|---|---|
| Z′ = 1 (observed solvate framework) | 15.82 |
| Z′ = 3 (observed desolvate) | −8.19 |
Polymorph prediction: new forms of CC3-R and CC4-R
The main purpose of this study was the evaluation of crystal structure prediction methodologies on a series of organic cages, testing against a series of known crystal structures. While these a posteriori or ‘post-diction’ studies identify where the calculation methods are successful, or where they need development, our ultimate purpose is to apply these computational methods to systems with unknown crystal structures, and to achieve de novo predictions for new crystal forms and, ultimately, new physical properties.During the writing of this paper, further crystallisation screens of CC3-R and CC4-R were performed using a range of solvents, identifying new solid forms of both molecules.41 Two previously unknown solvates of CC3-R have been isolated, one of which can be desolvated to a new high energy polymorph.41 The CC3-R desolvate structure contains three independent molecules, so it falls outside the scope of the prediction calculations performed here. Desolvation of a para-xylene solvate of CC4-R resulted in a previously unseen polymorph, referred to here as CC4-R β′.†41 This new polymorph, with space group F4132, matches the lowest energy predicted structure from the rigid molecule search (RMSD15 = 0.244 Å). The fact that this polymorph was only isolated well after its prediction highlights the potential for these methods to aid in solid form screening, and to point to the potential for as-yet unrealised polymorphic forms. Good agreement between simulated powder X-ray diffraction patterns from the observed and predicted structures (Fig. 9) demonstrates the potential for predicted structures to aid in the identification of new materials.17,42
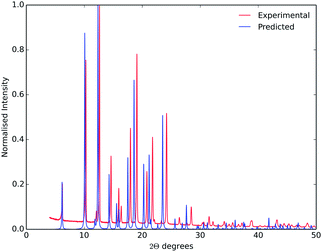 | ||
| Fig. 9 Observed powder X-ray diffraction from CC4-R β′ (red), and simulated from the lowest energy predicted CC4-R structure (blue). The experiment and simulation used a wavelength of λ = 1.54056 Å. | ||
Conclusions
The results that we present for this family of cage molecules are very promising, but cautionary in some respects. The molecular geometry observed in these structures is, in most cases, accurately predicted from a conformational search and rigid-molecule crystal structure searches give remarkably successful results for molecules of this size: the global lattice energy minima for each of CC3-R, CC3-RS, CC4-RS and CC5-R reproduce previously known observed crystal structures to good accuracy. Furthermore, the lowest energy predicted structure for CC4-R was subsequently isolated in polymorph screening studies. The preference for a molecule to form a racemic over an enantiopure packing, or vice versa, is also correctly predicted in each case. These results demonstrate the potential for prediction of the crystallisation behaviour and crystal packing of as-yet unsynthesised systems, forming a key part of the process of in silico design of porous molecular materials.We also highlight several challenges that remain in developing methods for reliable, de novo prediction of the crystal structures for functional molecular crystals. One challenge is to accurately treat the influence of intermolecular forces in the solid state on the molecular geometry. Currently, the computational resources required for solid state DFT calculations on systems of this size are prohibitive. A second key challenge is the importance that solvent molecules incorporated in the crystal structure can have, as underlined by the behaviour of CC1 and CC4-R. For both molecules, desolvation leads to a structural rearrangement of the cage molecules. This behaviour demonstrates that solvent can have a templating effect, influencing the polymorph that is formed during crystallisation. Methods for incorporating these effects in crystal structure prediction are required to predict which solvents will stabilise promising predicted polymorphs.
Despite the need for further method development, the results presented here show that crystal structure prediction can already play a role in the design and synthesis of molecular materials with targeted properties. The sets of predicted low energy structures can help anticipate likely packing modes and the changes that can be induced by small chemical changes to molecular building blocks. These predicted packing modes are a necessary starting point for predicting properties of as-yet unsynthesised materials.
Acknowledgements
E.O.P. was funded by an EPSRC Doctoral Training Account studentship. We thank the Royal Society (G.M.D. for a University Research Fellowship and A.I.C. for a Research Merit Award), the EPSRC (EP/H000925/1) and the European Research Council (ERC-StG-2012-307358-ANGLE) for financial support. The work made use of HECToR, the UK's national high-performance computing service, via our membership of the UK's HPC Materials Chemistry Consortium, which is funded by the EPSRC (EP/L000202). We thank Dr Tom Hasell for discussions regarding the polymorphism of CC3 and CC4.Notes and references
- J. Rouquerol, D. Avnir, C. W. Fairbridge, D. H. Everett, J. M. Haynes, N. Pernicone, J. D. F. Ramsay, K. S. W. Sing and K. K. Unger, Pure Appl. Chem., 1994, 66, 1739–1758 CrossRef CAS
.
- J. R. Holst, A. Trewin and A. I. Cooper, Nat. Chem., 2010, 2, 915–920 CrossRef CAS PubMed
.
- M. Mastalerz, Synlett, 2013, 24, 781–786 CrossRef CAS
.
- G. Zhang, O. Presly, F. White, I. M. Oppel and M. Mastalerz, Angew. Chem., Int. Ed., 2014, 53, 1516–1520 CrossRef CAS PubMed
.
- W. D. S. Motherwell, H. L. Ammon, J. D. Dunitz, A. Dzyabchenko, P. Erk, A. Gavezzotti, D. W. M. Hofmann, F. J. J. Leusen, J. P. M. Lommerse, W. T. M. Mooij, S. L. Price, H. Scheraga, B. Schweizer, M. U. Schmidt, B. P. van Eijck, P. Verwer and D. E. Williams, Acta Crystallogr., Sect. B: Struct. Sci., 2002, 58, 647 Search PubMed
.
- G. M. Day, W. D. S. Motherwell, H. L. Ammon, S. X. M. Boerrigter, R. G. Della Valle, E. Venuti, A. Dzyabchenko, J. D. Dunitz, B. Schweizer, B. P. van Eijck, P. Erk, J. C. Facelli, V. E. Bazterra, M. B. Ferraro, D. W. M. Hofmann, F. J. J. Leusen, C. Liang, C. C. Pantelides, P. G. Karamertzanis, S. L. Price, T. C. Lewis, H. Nowell, A. Torrisi, H. A. Scheraga, Y. A. Arnautova, M. U. Schmidt and P. Verwer, Acta Crystallogr., Sect. B: Struct. Sci., 2005, 61, 511 CAS
.
- G. M. Day, T. G. Cooper, A. J. Cruz-Cabeza, K. E. Hejczyk, H. L. Ammon, S. X. M. Boerrigter, J. S. Tan, R. G. Della Valle, E. Venuti, J. Jose, S. R. Gadre, G. R. Desiraju, T. S. Thakur, B. P. van Eijck, J. C. Facelli, V. E. Bazterra, M. B. Ferraro, D. W. M. Hofmann, M. A. Neumann, F. J. J. Leusen, J. Kendrick, S. L. Price, A. J. Misquitta, P. G. Karamertzanis, G. W. A. Welch, H. A. Scheraga, Y. A. Arnautova, M. U. Schmidt, J. van de Streek, A. K. Wolf and B. Schweizer, Acta Crystallogr., Sect. B: Struct. Sci., 2009, 65, 107 CAS
.
- D. A. Bardwell, C. S. Adjiman, Y. A. Arnautova, E. Bartashevich, S. X. M. Boerrigter, D. E. Braun, A. J. Cruz-Cabeza, G. M. Day, R. G. Della Valle, G. R. Desiraju, B. P. van Eijck, J. C. Facelli, M. B. Ferraro, D. Grillo, M. Habgood, D. W. M. Hofmann, F. Hofmann, K. V. J. Jose, P. G. Karamertzanis, A. V. Kazantsev, J. Kendrick, L. N. Kuleshova, F. J. J. Leusen, A. V. Maleev, A. J. Misquitta, S. Mohamed, R. J. Needs, M. A. Neumann, D. Nikylov, A. M. Orendt, R. Pal, C. C. Pantelides, C. J. Pickard, L. S. Price, S. L. Price, H. A. Scheraga, J. van de Streek, T. S. Thakur, S. Tiwari, E. Venuti and I. K. Zhitkov, Acta Crystallogr., Sect. B: Struct. Sci., 2011, 67, 535 CAS
.
- G. M. Day, W. D. S. Motherwell and W. Jones, Phys. Chem. Chem. Phys., 2007, 9, 1693–1704 RSC
.
- A. V. Kazantsev, P. G. Karamertzanis, C. S. Adjiman, C. C. Pantelides, S. L. Price, P. T. A. Galek, G. M. Day and A. J. Cruz-Cabeza, Int. J. Pharm., 2011, 418, 168–178 CrossRef CAS PubMed
.
- H. C. S. Chan, J. Kendrick and F. J. J. Leusen, Angew. Chem., Int. Ed., 2011, 50, 2979–2981 CrossRef CAS PubMed
.
- J. T. A. Jones, T. Hasell, X. Wu, J. Bacsa, K. E. Jelfs, M. Schmidtmann, S. Y. Chong, D. J. Adams, A. Trewin, F. Schiffman, F. Cora, B. Slater, A. Steiner, G. M. Day and A. I. Cooper, Nature, 2011, 474, 367–371 CrossRef CAS PubMed
.
- T. Tozawa, J. T. A. Jones, S. I. Swamy, S. Jiang, D. J. Adams, S. Shakespeare, R. Clowes, D. Bradshaw, T. Hasell, S. Y. Chong, C. Tang, S. Thompson, J. Parker, A. Trewin, J. Bacsa, A. M. Z. Slawin, A. Steiner and A. I. Cooper, Nat. Mater., 2009, 8, 973 CrossRef CAS PubMed
.
- T. Mitra, X. Wu, R. Clowes, J. T. A. Jones, K. E. Jelfs, D. J. Adams, A. Trewin, J. Bacsa, A. Steiner and A. I. Cooper, Chem. – Eur. J., 2011, 17, 10235–10240 CrossRef CAS PubMed
.
- J. T. A. Jones, D. Holden, T. Mitra, T. Hasell, D. J. Adams, K. E. Jelfs, A. Trewin, D. J. Willock, G. M. Day, J. Bacsa, A. Steiner and A. I. Cooper, Angew. Chem., Int. Ed., 2011, 50, 749–753 CrossRef CAS PubMed
.
- I. Kolossváry and W. C. Guida, J. Am. Chem. Soc., 1996, 118, 5011–5019 CrossRef
.
- M. Baias, C. M. Widdifield, J.-N. Dumez, H. P. G. Thompson, T. G. Cooper, E. Salager, S. Bassil, R. S. Stein, A. Lesage, G. M. Day and L. Emsley, Phys. Chem. Chem. Phys., 2013, 15, 8069 RSC
.
- K. E. Jelfs, E. G. B. Eden, J. L. Culshaw, S. Shakespeare, E. O. Pyzer-Knapp, H. P. G. Thompson, J. Bacsa, G. M. Day, D. J. Adams and A. I. Cooper, J. Am. Chem. Soc., 2013, 135, 9307 CrossRef CAS PubMed
.
- M. D. Hanwell, D. E. Curtis, D. C. Lonie, T. Vandermeersch, E. Zurek and G. R. Hutchison, J. Cheminf., 2012, 4, 17 CAS
.
- G. A. Kaminski, R. A. Friesner, J. Tirado-Rives and W. L. Jorgensen, J. Phys. Chem. B, 2001, 105, 6474–6487 CrossRef CAS
.
-
M. Frisch, G. Trucks, H. Schlegel, G. Scuseria, M. Robb, J. Cheeseman, J. Montgomery, T. Vreven, K. Kudin, J. Burant, J. Millam, S. Iyengar, J. Tomasi, V. Barone, B. Mennucci, M. Cossi, G. Scalmani, N. Rega, G. Petersson, H. Nakatsuji, M. Hada, M. Ehara, K. Toyota, R. Fukuda, J. Hasegawa, M. Ishida, T. Nakajima, Y. Honda, O. Kitao, H. Nakai, M. Klene, X. Li, J. Knox, H. Hratchian, J. Cross, V. Bakken, C. Adamo, J. Jaramillo, R. Gomperts, R. Stratmann, O. Yazyev, A. Austin, R. Cammi, C. Pomelli, J. Ochterski, P. Ayala, K. Morokuma, G. Voth, P. Salvador, J. Dannenberg, V. Zakrzewski, S. Dapprich, A. Daniels, M. Strain, O. Farkas, D. Malick, A. Rabuck, K. Raghavachari, J. Foresman, J. Ortiz, Q. Cui, A. Baboul, S. Clifford, J. Cioslowski, B. Stefanov, G. Liu, A. Liashenko, P. Piskorz, I. Komaromi, R. Martin, D. Fox, T. Keith, A. Laham, C. Peng, A. Nanayakkara, M. Challacombe, P. Gill, B. Johnson, W. Chen, M. Wong, C. Gonzalez and J. Pople, Gaussian03, 2003 Search PubMed
.
- H. R. Karfunkel and R. J. Gdanitz, J. Comput. Chem., 1992, 13, 1171–1183 CrossRef CAS
.
- H. R. Karfunkel and F. J. J. Leusen, Speedup, 1992, 6, 43 Search PubMed
.
- H. R. Karfunkel, R. J. Gdanitz and F. J. J. Leusen, J. Comput.-Aided Mater. Des., 1993, 1, 177 CrossRef
.
-
Materials Studio v6.10, Accelrys Software Inc., 2012 Search PubMed
.
- H. Sun, J. Phys. Chem. B, 1998, 102, 7338–7364 CrossRef CAS
.
- S. L. Price, M. Leslie, G. W. A. Welch, M. Habgood, L. S. Price, P. G. Karamertzanis and G. M. Day, Phys. Chem. Chem. Phys., 2010, 12, 8478 RSC
.
- A. J. Stone and M. Alderton, Mol. Phys., 1985, 56, 1047–1064 CrossRef CAS
.
- D. E. Williams, J. Comput. Chem., 2001, 22, 1154–1166 CrossRef CAS
.
- J. A. Chisholm and S. Motherwell, J. Appl. Crystallogr., 2005, 38, 228–231 CrossRef
.
- J. Van de Vondele, M. Krack, F. Mohamed, M. Parrinello, T. Chassaing and J. Hutter, Comput. Phys. Commun., 2005, 167, 103–108 CrossRef CAS
.
- J. VandeVondele and J. Hutter, J. Chem. Phys., 2007, 127, 114105 CrossRef PubMed
.
- S. Grimme, J. Antony, S. Ehrlich and H. Krieg, J. Chem. Phys., 2010, 132, 154104 CrossRef PubMed
.
- T. G. Cooper, W. Jones, W. D. S. Motherwell and G. M. Day, CrystEngComm, 2007, 9, 595–602 RSC
.
- K. E. Jelfs, F. Schiffmann, J. T. A. Jones, B. Slater, F. Cora and A. I. Cooper, Phys. Chem. Chem. Phys., 2011, 13, 20081–20085 RSC
.
-
A. L. Speck, PLATON, a multipurpose crystallographic tool, Utrecht University, Utrecht, The Netherlands, 2001 Search PubMed
.
- A. J. Cruz-Cabeza, G. M. Day and W. Jones, Chem. – Eur. J., 2009, 15, 13033–13040 CrossRef CAS PubMed
.
- S. Jiang, K. E. Jelfs, D. Holden, T. Hasell, S. Y. Chong, M. Haranczyk, A. Trewin and A. I. Cooper, J. Am. Chem. Soc., 2013, 135, 17818–17830 CrossRef CAS PubMed
.
- T. Hasell, M. Schmidtmann, C. A. Stone, M. W. Smith and A. I. Cooper, Chem. Commun., 2012, 48, 4689–4691 RSC
.
- M. A. Neumann, F. J. J. Leusen and J. Kendrick, Angew. Chem., Int. Ed., 2008, 47, 2427–2430 CrossRef CAS PubMed
.
- M. A. Little, S. Y. Chong, T. Hasell, M. Schmidtmann and A. I. Cooper, manuscript in preparation.
- M. D. Eddleston, K. E. Hejczyk, E. G. Bithell, G. M. Day and W. Jones, Chem. – Eur. J., 2013, 19, 7874–7882 CrossRef CAS PubMed
.
Footnotes |
| † Electronic supplementary information (ESI) available: Details of the CC1Z′ = 2 crystal structure search. Figures of the low energy conformers of CC3, CC4 and CC5; crystal energy landscapes of CC3 and CC5; predicted/experimental crystal structure overlays of CC1, CC3, CC4-RS, CC5; comparisons between rigid-body force field and periodic DFT-D relative energies for CC1, CC3, CC4 and CC5; RMSD comparisons between the gas phase and periodic DFT-D optimised geometry for low energy structures of CC1, CC3, CC4 and CC5; comparisons of experimental and predicted powder X-ray patterns for CC1, CC3, CC4-RS, CC5. CIF files are included for the low energy predicted structures from the rigid body prediction of CC1, CC3, CC4 and CC5. CCDC 991218 for CC4-R β′. See DOI: 10.1039/c4sc00095a |
| ‡ This larger cutoff was used than in our previous study12 as the relative energies of some of the predicted crystal structures were found to be very sensitive to the summation cutoff radius. |
| This journal is © The Royal Society of Chemistry 2014 |

