Nucleation and growth of mercury on Pt nanoelectrodes at different overpotentials†
Jeyavel
Velmurugan‡
,
Jean-Marc
Noël§
and
Michael V.
Mirkin
*
Department of Chemistry and Biochemistry, Queens College – CUNY, Flushing, NY 11367, USA. E-mail: mmirkin@qc.cuny.edu
First published on 22nd October 2013
Abstract
Three-dimensional nucleation and growth on active surface sites are fundamentally important initial stages of electrodeposition of metals. Electrodeposition of Hg is a widely employed model for studies of such processes because the near-ideal hemispherical growth of its liquid nuclei can be used to check the existing theory. In this article we discuss nucleation/growth of Hg at 50–100 nm radius Pt electrodes. Recently, atomic force microscopy (AFM) was used to demonstrate that a nanoelectrode of this size has a single active site for Ag nucleation, at which the growth of a single nucleus was monitored (Chem. Sci., 2012, 3, 3307). Here we report similar observations for Hg nucleation/growth at relatively low overpotentials (e.g., 25 to 75 mV). However, at higher overpotentials (e.g., ≥100 mV), the kinetics of this process changed, and very fast multiple nucleation of Hg was observed. Possible origins of this phenomenon are discussed.
Introduction
There has been continuing interest in electrodeposition of metals from the early 19th century, when it was used for electroplating, to most recent applications in nanotechnology.1–5 Understanding the mechanism and kinetics of the initial deposition stages, including 3D nucleation/growth, is the key to controlling the geometry and other properties of the deposited metal structures.6,7 After decades of active theoretical and experimental studies, our understanding of heterogeneous nucleation on active sites remains incomplete,6b–10 and the quantitative description of the ensemble of growing nuclei is highly approximate.11–16 The quantitative analysis of the signal, which is produced by a large number of nuclei formed at different times and interacting with each other is challenging and the information about individual active sites is hard to obtain.One approach to decreasing the complexity of the analysis and gaining information about individual nucleation events is to study the electrodeposition of metals at nanometre-sized electrodes, where only a small number of nuclei can be formed.17 Recently, we employed nanometre-sized Pt electrodes and atomic force microscopy (AFM) to investigate the formation and growth of single silver nanocrystals on individual nucleation sites.18 As could be expected from the literature, only one nucleation site was observed on the surface of a ∼50 nm-radius Pt electrode, and two sites—on a larger (∼190 nm radius) electrode. The calculated effective site densities were either comparable to or somewhat higher than those reported previously for macroscopic electrodes, and the current transients obtained at ∼100 nm or smaller electrodes corresponded to the theory for the diffusion-controlled growth of a single nucleus. However, in some potentiostatic transients obtained at high negative overpotentials (>100 mV) the current increase was too fast to be attributed to the formation of one or two Ag nuclei. Here we will investigate this phenomenon using nucleation/growth of mercury on Pt nanoelectrodes as a model experimental system. Unlike solid metals, the 3D nucleation/growth of liquid Hg yields uniform and defect-free droplets, and it is not accompanied by the formation of dendrites and other complications.19,20 This process, which can be realistically described by the hemispherical growth model, has been used in classical nucleation/growth studies.19,21,22
Recently, we carried out electrodeposition of Hg at nm-sized Pt electrodes to produce mercury nanoelectrodes.23 From chronoamperograms and SECM approach curves, it was found that hemispherical Hg deposit grew and eventually covered the entire nanoelectrode’s surface similarly to the previously reported experiments at microelectrodes.20,24 Potentiostatic transients of Hg deposition obtained at Pt microelectrodes were similar to those reported in the literature.
Results and discussion
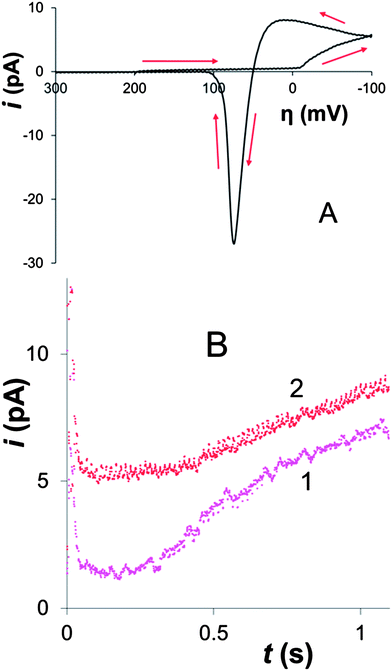
A cyclic voltammogram (CV) of Hg electrodeposition at the 100 nm-radius polished Pt electrode in Fig. 1A shows a characteristic hysteresis, appearing after the potential sweep reversal, and a sharp anodic peak of Hg stripping; both features are typical of metal nucleation/growth CVs at macroscopic electrodes.20,24,25The two potentiostatic transients in Fig. 1B were obtained by stepping the nanoelectrode potential to −50 mV (1) and −200 mV (2) vs. Hg quasi-reference. In both curves, the initial spike of charging current is followed by the slow increase in current due to the growth of mercury deposit. Curve 1 is qualitatively similar to the transients produced by nucleation/growth of a single Ag nucleus.18 After the initial spike, the current decayed to about 0 pA, as expected for the sub-nm size of the critical nucleus.6a,7,25 The second transient is different: before increasing, the current decays not to zero, but to ∼5 pA, which is close to the expected value of the steady-state diffusion limiting current to a ∼50 nm-radius disk electrode in 100 μM solution of Hg2(NO3)2 (∼4 pA) that can be calculated from eqn (1)
| idisk = 4zFDac | (1) |
| i = πzF(2Dc)3/2VM1/2(t − t0)1/2[1 − exp(zfη)]3/2 | (2) |
 | (3) |
 | ||
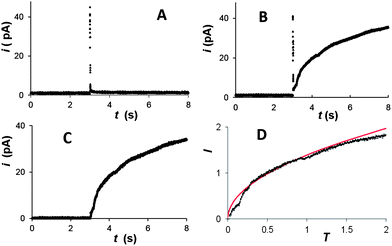
| Fig. 2 Background subtraction for potentiostatic transients of Hg deposition at a 100 nm Pt electrode from solution containing 0.2 mM Hg2(NO3)2 and 0.125 M HClO4. The potential was stepped to η = −50 mV. (A) Background transient obtained without Hg2(NO3)2. Deposition transient before (B) and after (C) background subtraction, and the same current–time curve in the normalized form (symbols) fitted to the theory (solid line; eqn (4)) (D). | ||
The dimensionless form of eqn (2), from which the theoretical curve in Fig. 2D was calculated, is
 | (4) |
The experimental current in Fig. 2D fits the theoretical curve (eqn (4)) up to T ≈ 1.3 at which the nucleus radius becomes similar to that of the underlying electrode.
Similarly to the previously reported growth of single Ag nuclei,18 a large number of Hg deposition transients obtained at different Pt nanoelectrodes (∼20 nm < a < ∼150 nm) with different concentrations of mercury in solution and |η| < 100 mV were found to fit eqn (4) very well (see Fig. 2D and 3A and ESI†). The time scale of the deposition transient is determined by the concentration of mercury in solution. It was varied between milliseconds (Fig. 3A and S5†) and seconds (Fig. 2). A single adjustable parameter in eqn (4), t0, could only be varied within very narrow limits. Thus, at relatively low overpotentials only a single nucleus of Hg forms on the Pt nanoelectrode surface.
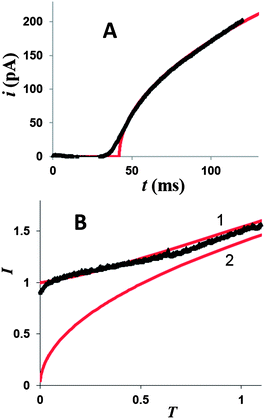
Two background-subtracted nucleation/growth transients obtained by stepping the potential of the same 80 nm radius Pt electrode to −25 mV (A) and −200 mV (B) vs. Hg quasi-reference are shown in Fig. 3. The experimental data in Fig. 3A fits the theory (eqn (2)) well except for small deviations in the short-time region, which are most likely due to the electron transfer limitations.27 After the application of a high cathodic overpotential (Fig. 3B), the normalized current jumped to the unity value, which corresponds to the steady-state diffusion limiting current of 1 mM Hg22+ to the 80 nm electrode (eqn (4)). This finding suggests that the growth of Hg started from the entire disk surface rather than from a sub-nm sized nucleus. To reconcile this result with the existing nucleation/growth theory, one has to assume that a significant number of nuclei “instantaneously” formed at the nanoelectrode surface, and their diffusion zones overlapped on the time scale too short to be resolved in our chronoamperometric experiments. Such a process can be modelled mathematically as diffusion to a growing spherical cap (see Appendix). Similarly to the growth of a single hemispherical nucleus, the cap grows on the millisecond to second time scale, depending on the concentration of mercury in solution; and this time scale is always sufficiently long for the diffusion current at a nanoelectrode to reach a steady state. Therefore, one can use the steady-state treatment of Alfred and Oldham28a to express the diffusion limiting current to a growing spherical cap.28b To facilitate the comparison to the single nucleus growth, the current was normalized by idisk and the dimensionless time was expressed according to eqn (3). Using a tabulated function f(H) (ref. 28a) (where H = h/a is the height of the cap normalized by the effective radius of the electrode, which serves as its base), one can calculate the dimensionless working curve (I vs. T) from eqn (A4) and (A8).
At longer normalized times, e.g., T > 1,29 the working current–time curves computed for a single growing nucleus (curve 2 in Fig. 3B and for multiple nucleation (curve 1, solid line) at a nanoelectrode are quite similar, but the short-time portions of these transients are completely different and can be distinguished experimentally. The contributions of individual nuclei growing on the nanoelectrode surface to the measured current cannot be differentiated in our experiments because their diffusion layers overlap very quickly (on the microsecond time scale). Clearly, if only two (or three) nuclei formed on the nanoelectrode at the same time, the recorded current would initially be twice (or thrice) as large as that predicted by eqn (4) and the current–time curve would be intermediate between curves 2 and 1 in Fig. 3B. Typically, no such curves were obtained in our experiments. The current measured at low overpotentials followed the theory for a single growing nucleus (Fig. 2D, 3A, S1A, S2A, and S3A†), while at high overpotentials the initial value of the normalized current was I = 1, corresponding to the formation of multiple nuclei whose diffusion zones quickly covered the entire nanoelectrode surface (Fig. 3B, S1B, S2B, and S3B†).
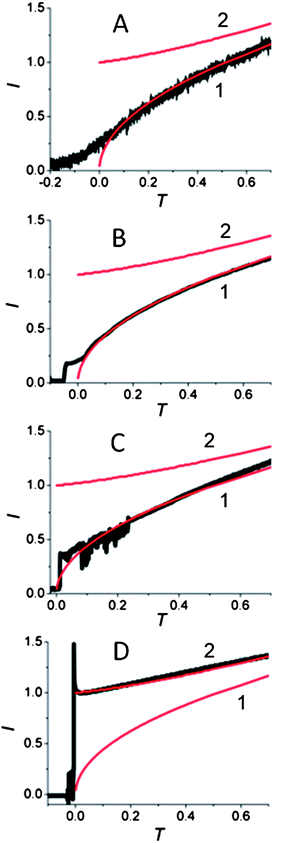
The change in the transient shape with applied overpotential is shown in Fig. 4. While the transients obtained at the same 60 nm electrode clearly show the formation of a single nucleus at the −25 mV, −50 mV and −75 mV overpotentials (Fig. 4A–C), the transient obtained by stepping the electrode potential to −100 mV fits very well the theory for multiple nucleation. The transition between these two types of responses occurred at the overpotential close to −100 mV. Essentially all transients obtained at cathodic overpotentials less than 100 mV exhibited single nucleus growth, while those obtained at larger η values showed multiple nucleation. By stepping the potential to −100 mV, we observed both types of growth transients, i.e., the growth of many nuclei (Fig. 4D) or a single nucleus (Fig. S4†). While such randomness is inherent to nucleation phenomena, this observation demonstrates the sharp transition between a single site on the nanoelectrode surface active for Hg nucleation at less negative potentials and a much larger number of active sites at higher cathodic overpotentials.
Despite a number of published studies, there is no single, generally accepted description of the nature and density of the incipient nucleation sites on the surface.6,7,25 Earlier models, assuming that all nucleation sites are equally active, and their density on the surface (N0) is independent of η,30 could not explain our findings. The assumption that active sites on the electrode surface may appear and disappear in the course of the electrochemical experiment at constant η (ref. 6b, 21 and 31) does not help either. The deposition transients obtained at low overpotentials showed the single nucleus formation both on the 1 ms (Fig. S5†) and on the second (Fig. 2 and 4A–C) time scale. There is no evidence for the appearance of additional sites with time. Similarly, multiple nuclei were formed at |η| ≥ 100 mV regardless of the experimental timescale. Furthermore, the presented experimental results could not be clarified with the notion that N0 increases continuously (e.g., exponentially) with increasing cathodic overpotential32,33 because only one nucleus formed at different η values from −25 mV to −100 mV.
A simple way to account for the aforementioned results is by assuming the existence of active sites with different activities with respect to nucleus formation.34,35 As discussed is ref. 18, one latent nucleation site on the surface of a 50 nm-radius electrode corresponds to the effective site density, N0 ≈ 1.3 × 1010 cm−2, close to the highest N0 values reported in the literature.25 These are higher activity sites, on which nucleation can occur at the overpotentials as low as ∼25 mV. Multiple nucleation events occurring at the electrodes with radii ≤100 nm point to the density of active sites significantly exceeding any reported literature values (e.g., N0 ≥ 1011 cm−2). Apparently, these are low activity sites requiring large overpotentials (|η| ≥ 100 mV) for the nucleation to occur. The nuclei forming at such sites are very closely spaced; their diffusion layers overlap very quickly, and therefore these nucleation events could not be differentiated on our experimental time scale or in any previously reported electrochemical experiments. However, by using nanoelectrodes, one can detect multiple nucleation from the shape of the initial portion of the current transient.
Using a somewhat larger (e.g., a = 190 nm) electrode, we previously observed the formation of two Ag nuclei on two persistent active sites at the 85 mV overpotential.18 It should be possible to grow two Hg nuclei at |η| < 100 mV at a suitably sized Pt nanoelectrode, thus, observing the transient shape intermediate between “single nucleus” and “multiple nucleation” cases. Such a behaviour was not typical of 50 to 100 nm electrodes used in the present study; however, a small current jump following the potential step in a few transients (e.g., in Fig. 4B) may have been caused by the formation of more than one nucleus.
Conclusions
We used nanometre-sized polished electrodes to investigate 3D nucleation/growth of mercury on platinum. The potentiostatic transients recorded at lower (<100 mV) overpotentials were similar to those obtained previously for the deposition of a single Ag nucleus at a Pt nanoelectrode visualized by AFM.18 Such transients fit well the theory for the diffusion-controlled growth of a single nucleus regardless of specific η value and Hg22+ concentration in solution.The chronoamperograms obtained at higher overpotentials showed the initial current (after the charging current decay) corresponding to the diffusion of Hg22+ to the entire nanoelectrode surface, and their shape could be modelled as the diffusion-controlled growth of a spherical cap. To interpret such transients, we have to assume the rapid formation of a number of nuclei on the nanoelectrode surface, which in turn points to the density of the active sites significantly larger than the values reported in the literature. Although the increase in N0 with cathodic overpotential is well documented,25,32,33 the formation of only one nucleus at a range of lower overpotentials and the sharp transition to multiple nucleation at |η| ≈ 100 mV could not be observed at macroscopic electrodes. A plausible explanation of this behaviour is in the existence of nucleation sites with different activities on the electrode surface. At small overpotentials, Hg nucleates only on a relatively small number of highly active sites, while higher overpotentials provide sufficient driving force for the nucleation to occur at numerous lower activity sites.
At high overpotentials, which are typical for most systems of technological interest,36 the site density and the number of nuclei formed after the application of a potential pulse may be higher than those reported in the literature. The values determined by experiments at macroscopic electrodes may reflect the effects of nanocluster surface movement and aggregation.10,37
Experimental
Chemicals
Mercury(I) nitrate dihydrate was obtained for Sigma Aldrich. Hexaammineruthenium(III) chloride (99%) was from Strem Chemicals. H2SO4 and HClO4 from Aldrich were used as received. Aqueous solutions were prepared from deionized water (Milli-Q, Millipore Co.).Preparation of nanoelectrodes
The fabrication of laser-pulled Pt nanoelectrodes was described previously.38 Briefly, an annealed 25 μm Pt wire (Goodfellow) was pulled into a borosilicate capillary (Drummond; 1.0 mm o.d, 0.2 mm i.d.) under vacuum with the help of a Sutter P-2000/G laser pipet puller. The pulled electrodes were polished on 50 nm lapping tape under video microscopic control, and washed by distilled water. The effective radius of an electrode was evaluated from steady-state voltammetry and AFM.18,39Instrumentation and procedures
Chronoamperometric and cyclic voltammetric experiments were carried out using either an EI-400 bipotentiostat (Ensman Instruments, Bloomington, IN) or a BAS-100B electrochemical analyser (Bioanalytical Systems, West Lafayette, IN). The two-electrode setup with a mercury pool quasi-reference was used to avoid an effect of Cl−. For shorter time scale (μs) measurements, Multiclamp 700B amplifier (Molecular Devices Corporation, CA) was used in the voltage-clamp mode to apply voltage and measure the resulting current. The signal was digitized using a Digidata 1440A analog-to-digital converter (Molecular Devices Corporation) at a sampling frequency of 100–250 kHz. A low pass filter with 1–10 kHz bandwidth was used, depending on the experimental time scale and the level of noise. The data were recorded and analysed using pClamp 10 (Molecular Devices Corporation). For current transients, first a potential sufficiently positive for Hg oxidation (e.g., 200 mV vs. Hg) was applied for several seconds in order to remove traces of mercury. Then, the potential stepped to the mercury deposition value (between −25 mV and −200 mV).An XE-120 scanning probe microscope (Park Systems) was employed for imaging nanoelectrodes. PPP-NCHR AFM probes (Nanosensors) were used for noncontact imaging. The procedures for AFM imaging of nanoelectrodes either in air or in solution were reported previously.39
Appendix
Theory for spherical cap growing and curve normalization
The volume of a spherical cap is: | (A1) |
The charge required to electrodeposit the spherical cap is
 | (A2) |
 | (A3) |
The current can be normalized by the steady-state diffusion limiting current of the metal ions to the disk electrode (idisk = 4zFDca, where D and c are the diffusion coefficient and the bulk concentration of metal ion, respectively) to obtain
 | (A4) |
Because the time scale of the cap growth is much longer that the time required for the spherical diffusion to reach a steady state (this time is ∼a2/D, i.e., ∼1 μs for a nanoelectrode), the diffusion process is always at quasi-steady-state, and i depends on time only because the cap is growing with time.
I can be calculated by multiplying the right-hand side of eqn (7.1) in ref. 28a by π/2. This function is tabulated in ref. 28a for an independent variable Ξ, which can be related to H as follows:
H = (1 + cos![[thin space (1/6-em)]](https://www.rsc.org/images/entities/char_2009.gif) Ξ)/sin Ξ)/sin![[thin space (1/6-em)]](https://www.rsc.org/images/entities/char_2009.gif) Ξ Ξ | (A5) |
Eqn (A4) can be rewritten to separate the variables:
 | (A6) |
 | (A7) |
 | (A8) |
Eqn (A8) and (A4) were used to calculate the dimensionless theoretical curve for the growing spherical cap shown in Figs. 3B and 4 for the H values in the range between 0.001 and 50. In the experimental curves, the current is normalized by idisk.
Acknowledgements
The support of this work by the National Science Foundation (CHE-0957313 and CHE-1026582) and the Donors of the Petroleum Research Fund administrated by the American Chemical Society is gratefully acknowledged.Notes and references
- Y. D. Gamburg and G. Zangari, Theory and Practice of Metal Electrodeposition, Springer, New York, 2011 Search PubMed.
- N. Tian, Z.-Y. Zhou, N.-F. Yu, L.-Y. Wang and S.-G. Sun, J. Am. Chem. Soc., 2010, 132, 7580 CrossRef CAS PubMed.
- T. P. Moffat and D. Josell, Isr. J. Chem., 2010, 50, 312 CrossRef CAS.
- I. Valov, I. Sapezanskaia, A. Nayak, T. Tsuruoka, T. Bredow, T. Hasegawa, G. Staikov, M. Aono and R. Waser, Nat. Mater., 2012, 11, 530 CrossRef CAS PubMed.
- J. A. Switzer, Science, 2012, 338, 1300 CrossRef CAS PubMed.
- (a) A. Milchev, Electrocrystallization: Fundamentals of Nucleation and Growth, Kluwer, Boston, 2002 Search PubMed; (b) A. Milchev, J. Electroanal. Chem., 1998, 457, 35 CrossRef.
- M. E. Hyde and R. G. Compton, J. Electroanal. Chem., 2003, 549, 1 CrossRef CAS.
- D. Mazaira, C. Borras, J. Mostany and B. R. Scharifker, J. Electroanal. Chem., 2009, 631, 22 CrossRef CAS.
- A. Radisic, P. M. Vereecken, J. B. Hannon, P. C. Searson and F. M. Ross, Nano Lett., 2006, 6, 238 CrossRef CAS PubMed.
- J. Ustarroz, X. Ke, A. Hubin, S. Bals and H. Terryn, J. Phys. Chem. C, 2012, 116, 2322 CAS.
- B. R. Scharifker and J. Mostany, J. Electroanal. Chem., 1984, 177, 13 CrossRef CAS.
- M. Sluyters-Rehbach, J. H. O. J. Wijenberg, E. Bosco and J. H. Sluyters, J. Electroanal. Chem., 1987, 236, 1 CrossRef CAS.
- V. Mirkin and A. P. Nilov, J. Electroanal. Chem., 1990, 283, 35 CrossRef.
- (a) Y. Cao and A. C. West, J. Electroanal. Chem., 2001, 514, 103 CrossRef CAS; (b) Y. Cao, P. Searson and A. C. West, J. Electrochem. Soc., 2001, 148, C376 CrossRef CAS; (c) L. Guo, A. Radisic and P. C. Searson, J. Phys. Chem. B, 2005, 109, 24008 CrossRef CAS PubMed.
- E. Matthijs, S. Langerock, E. Michailova and L. Heerman, J. Electroanal. Chem., 2004, 570, 123 CrossRef CAS.
- M. Y. Abyaneh, J. Electroanal. Chem., 2006, 586, 196 CrossRef CAS.
- S. Chen and A. Kucernak, J. Phys. Chem. B, 2003, 107, 8392 CrossRef CAS.
- J. Velmurugan, J.-M. Noël, W. Nogala and M. V. Mirkin, Chem. Sci., 2012, 3, 3307 RSC.
- (a) B. Scharifker and G. Hills, J. Electroanal. Chem., 1981, 130, 81 CrossRef CAS; (b) G. Gunawardena, G. Hills and B. Scharifker, J. Electroanal. Chem., 1981, 130, 99 CrossRef CAS.
- K. R. Wehmeyer and R. M. Wightman, Anal. Chem., 1985, 57, 1989 CrossRef CAS.
- A. Milchev and V. Tsakova, Electrochim. Acta, 1985, 30, 133 CrossRef CAS.
- R. C. Salvarezza and A. J. Arvia, Electrochim. Acta, 1988, 33, 1031 CrossRef CAS.
- J. Velmurugan and M. V. Mirkin, ChemPhysChem, 2010, 11, 3011 CrossRef CAS PubMed.
- (a) Z. Stojek and J. Osteryoung, Anal. Chem., 1988, 60, 131 CrossRef CAS; (b) J. Mauzeroll, E. A. Hueske and A. J. Bard, Anal. Chem., 2003, 75, 3880 CrossRef CAS PubMed; (c) S. Daniele, C. Bragato, I. Ciani and M. A. Baldo, Electroanalysis, 2003, 15, 621 CrossRef CAS.
- B. R. Scharifker and J. Mostany, in Encyclopedia of Electrochemistry, ed. A. J. Bard and M. Stratmann, Wiley VCH, Weinheim, 2003, vol. 2, ch. 5.3 Search PubMed.
- G. J. Hills, D. J. Schiffrin and J. Thompson, Electrochim. Acta, 1974, 19, 657 CrossRef CAS.
- (a) S. Fletcher, J. Cryst. Growth, 1983, 62, 505 CrossRef CAS; (b) A. Milchev, Russ. J. Electrochem., 2008, 44, 619 CrossRef CAS.
- (a) C. R. Alfred and K. B. Oldham, J. Phys. Chem., 1996, 100, 2170 CrossRef; (b) D. P. Branco, J. Mostany, C. Borrás and B. R. Scharifker, J. Solid State Electrochem., 2009, 13, 565 CrossRef.
- If the overpotential is sufficiently large, and a hemispherical nucleus growth is diffusion-controlled, its radius can be evaluated as r = [2DVMc(t − t0)]1/2. Thus, T = 1 corresponds to
 and r = aπ1/2/2 ≈ 0.9a.
 - M. Fleischmann and H. R. Thirsk, Electrochim. Acta, 1959, 1, 146 CrossRef CAS.
- S. Fletcher, J. Electroanal. Chem., 1986, 215, 1 CrossRef CAS.
- J. Mostany, J. Mozota and B. R. Scharifker, J. Electroanal. Chem., 1984, 177, 25 CrossRef CAS.
- J. Mostany, J. Parra and B. R. Scharifker, J. Appl. Electrochem., 1986, 16, 333 CrossRef CAS.
- R. Kaischev and B. Mutaftschiev, Electrochim. Acta, 1965, 10, 643 CrossRef.
- I. Markov and D. Kashchiev, J. Cryst. Growth, 1972, 16, 170 CrossRef CAS.
- L. Guo and P. C. Searson, Electrochim. Acta, 2010, 55, 4086 CrossRef CAS.
- J. Ustarroz, J. A. Hammons, T. Altantzis, A. Hubin, S. Bals and H. Terryn, J. Am. Chem. Soc., 2013, 135, 11550 CrossRef CAS PubMed.
- P. Sun and M. V. Mirkin, Anal. Chem., 2006, 78, 6526 CrossRef CAS PubMed.
- W. Nogala, J. Velmurugan and M. V. Mirkin, Anal. Chem., 2012, 84, 5192 CrossRef CAS PubMed.
Footnotes |
| † Electronic supplementary information (ESI) available: Additional Hg deposition transients. See DOI: 10.1039/c3sc52488d |
| ‡ Present address: Sandia National Laboratories, Albuquerque, NM 87185, USA. |
| § Present address: Physicochimie des Electrolytes, Colloides et Sciences Analytiques, ESPCI ParisTech, CNRS-UMR 7195, 10 rue Vauquelin, 75231 Paris Cedex 05, France. |
| This journal is © The Royal Society of Chemistry 2014 |


