Measuring meta-ignorance through the lens of confidence: examining students' redox misconceptions about oxidation numbers, charge, and electron transfer
Alexandra R.
Brandriet
and
Stacey Lowery
Bretz
*
Department of Chemistry and Biochemistry, Miami University, Oxford, OH 45056, USA. E-mail: bretzsl@miamioh.edu
First published on 28th July 2014
Abstract
This manuscript describes the relationship between students' redox understandings and confidence as measured by the Redox Concept Inventory (ROXCI) which assesses symbolic and particulate redox concepts. The ROXCI was administered to two samples of 1st- and 2nd-semester general chemistry students after the students were taught and tested on redox concepts in their classrooms. Cluster analysis was used to identify groups of students with similar response patterns, based upon both total scores and average confidence on the ROXCI. Three clusters of students were identified in both samples: students with (1) moderate total scores and high confidence, (2) low total scores and low confidence, and (3) low total scores but high confidence. Clusters were further analyzed at an individual item level using average confidence, individual item difficulties, and the Confidence Discrimination Quotient (CDQ). Findings align with the Dunning–Kruger effect, i.e. in which students demonstrated a false sense of confidence regarding their own poor performance, and therefore, exemplify meta-ignorance. Descriptions of the clusters, example misconceptions held by the students regarding oxidation numbers and electron transfer, and the implications of this research are discussed.
Introduction
Students' understandings
Students construct knowledge based upon information gathered from their environments by their senses. Constructivist theories describe knowledge as viable, adaptive, and founded within the learner's prior knowledge (von Glasersfeld, 1984, 1995; Bodner, 1986), and that students construct meaningful ideas when an integration of students' thoughts, feelings, and actions exists (Novak, 2010). However, when students construct meaningful knowledge, this does not necessarily mean that the new knowledge aligns with scientifically accepted ideas. When knowledge is incorrect, it can impede upon a deep understanding of scientifically correct ideas (Chi and Roscoe, 2002; National Research Council, 2012). Some of these incorrect ideas are seen as robust within students' mental frameworks because they are highly plausible and intelligible to students (Nakhleh, 1992; Strike and Posner, 1992). Because of this, they can be very difficult to remediate through formal instruction. These incorrect ideas are often described as “misconceptions” (Strike and Posner, 1992; Chi et al., 1994; Chi and Roscoe, 2002). Students hold misconceptions in a wide variety of chemistry content domains (Peterson and Treagust, 1989; Sanger and Greenbowe, 2000; Taber, 2002; Chandrasegaran et al., 2007; Smith and Nakhleh, 2011; Linenberger and Bretz, 2012, 2014; Naah and Sanger, 2012; Luxford and Bretz, 2013; Cruz-Ramirez de Arellano and Towns, 2014). As documented in the literature, one potential source of misconceptions is a student's inability to transition between the wide variety of chemical representations found in textbooks, lectures, laboratories, and scientific journals. Johnstone (1982, 1991, 1993, 2006, 2010) has categorized chemists' representations into the symbolic (e.g. chemical equation), the macroscopic (e.g. demonstration), and the particulate (e.g. atoms, molecules, or ions) domains. While experts may be able to effortlessly transition between domains, novices often struggle (Nakhleh, 1992; Davidowitz et al., 2010; Kelly et al., 2010; Kern et al., 2010; Nyachwaya et al., 2014).Of particular interest to this study are students' understandings about oxidation–reduction reactions. Redox content is especially difficult for students (Johnstone et al., 1971; Butts and Smith, 1987), and several studies have identified misconceptions or difficulties that students have with redox concepts (Allsop and George, 1982; Garnett and Treagust, 1992; De Jong et al., 1995; Schmidt and Volke, 2003; Stains and Talanquer, 2008; Österlund and Ekborg, 2009; Österlund et al., 2010; Jaber and BouJaoude, 2012; Rosenthal and Sanger, 2012; Øyehaug and Holt, 2013; Brandriet and Bretz, 2014). In a fundamental study, Garnett and Treagust (1992) identified that students could not distinguish the concepts of oxidation numbers and charges such as assigning oxidation numbers to entire polyatomic molecules or ions, and using changes in the charges of polyatomic species to identify redox reactions. For example, in a reaction of CO2−3 + 2H+ → H2O + CO2, students identified that the charge changed from −2 for carbonate ion to 0 for carbon dioxide, and therefore, decided that the carbonate ion was oxidized. Additionally, in a study by Schmidt and Volke (2003), German students were surveyed and interviewed in order to determine if the students could identify acids, bases, oxidizing agents, and reducing agents in several reactions, as well as what mechanisms the students used to identify the reaction species. As with the findings of Garnett and Treagust (1992), these students also used changes in charges on polyatomic ions and molecules to identify oxidized and reduced species.
While a majority of the previous literature on students' understandings of redox reactions has focused on students' understandings in the symbolic domain (e.g., using chemical equations as prompts, applying oxidation numbers, etc.), fewer studies have identified students' misconceptions in the particulate domain. In a study by Rosenthal and Sanger (2012), students' misconceptions were elicited using two computer animations of varying complexity representing a reaction of solid copper and aqueous silver nitrate. Several student misconceptions were elicited during this study, including that cations and anions are attached or bonded together, an unspecified number of electrons transfer from copper to silver, and nitrate ions are more attracted to copper ions than to silver ions and thus drive the reaction.
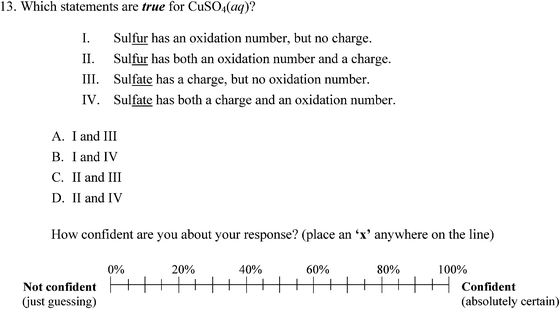
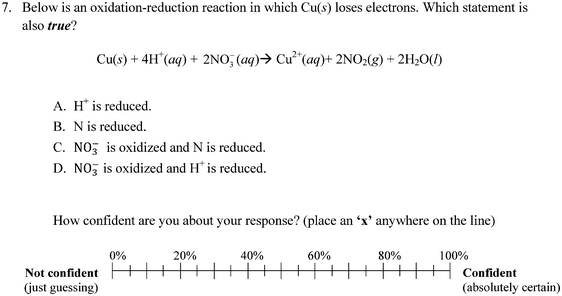
In order to quantify the presence of misconceptions about redox chemistry, Brandriet and Bretz (2014) developed the Redox Concept Inventory (ROXCI) to measure students' understandings about redox concepts. The ROXCI is an 18-item multiple-choice assessment that measures students' ideas about oxidation numbers, surface features of chemical reactions, electron transfer, the role of the spectator ion, the dynamic reaction process, and electrostatics & bonding. These 6 major themes were identified during interviews with students, and individual item responses were drawn from students' quotes during the interviews. The ROXCI uses both symbolic and particulate prompts in order to elicit students' misconceptions within the symbolic domain, particulate domain, and the connections between the two. Each of the 18 items also includes an associated confidence tier that asks students to report their confidence about their responses by marking an ‘X’ on a 0% (Just Guessing) to 100% (Absolutely Certain) scale. Through the use of the confidence tier, the ROXCI not only detects students' redox misconceptions, but also identifies the robustness of the misconceptions. Example ROXCI questions and the associated confidence tier can be found in Fig. 1 and 2. Additional information about the development of the ROXCI, including the validity and reliability of the data generated is discussed elsewhere (Brandriet and Bretz, 2014).
Meta-ignorance
Several recent chemistry education research studies have recently reported that not only do students have misconceptions, but they are also largely unaware of their own misconceptions (Caleon and Subramaniam, 2010a, 2010b; McClary and Bretz, 2012; Sreenivasulu and Subramaniam, 2014). These results demonstrate the Dunning–Kruger effect, a well-known psychological phenomenon in which poor performers are largely unaware of their own deficiency (Dunning, 2011) and may exhibit greater confidence than their more able peers. Essentially, poor performing individuals lack the metacognitive resources which are necessary to recognize their inabilities, and therefore, these individuals embody meta-ignorance, i.e., ignorance about one's own deficits in knowledge (Dunning, 2011). Dunning (2011) describes three kinds of deficits: (1) instances of “unknown unknowns”, (2) instances where knowledge deficits are concealed by “misbeliefs” that individuals believe is true knowledge, and (3) instances where individuals “construct responses that are relevant and reasonable” to the individual, but in reality are incorrect. The latter two instances are most powerful for explaining students' misconceptions which are often intelligible, plausible, and highly integrated in students' mental frameworks. Therefore, it comes as no surprise that students may feel quite confident about their misconceptions. However, identifying deficits in one's own knowledge is an intrinsically difficult task, and students are unlikely to identify these deficits without intervention (Carter and Dunning, 2008; Dunning, 2011). Based on the emerging literature on the Dunning–Kruger effect in chemistry education research (Bell and Volckmann, 2011; Karatjas, 2013; Pazicni and Bauer, 2014), the problem of meta-ignorance seems to be a pervasive issue in the classroom, and therefore, suggests that students may be “poorly calibrated” (Caleon and Subramaniam, 2010b).One way that instructors can help students identify deficiencies in their own understandings is to use formative assessments, such as concept inventories, in the classroom. A variety of chemistry concept inventories have been created (Treagust, 1988; Voska and Heikkinen, 2000; Mulford and Robinson, 2002; Chandrasegaran et al., 2007; Caleon and Subramaniam, 2010a; Villafañe et al., 2011; Bretz and Linenberger, 2012; Luxford and Bretz, 2014; Wren and Barbera, 2014). To a large extent, concept inventories use multiple-choice questions to elicit students' understandings. However, multiple-choice questions have been criticized because they allow for the possibility that students may respond by guessing rather than report their candid understandings (Burton, 2001; Roediger and Marsh, 2005; Caleon and Subramaniam, 2010a, 2010b). Researchers have sought to reduce this limitation by incorporating confidence tiers in order to gain an understanding of how confidently students rate specific responses (Clement et al., 1989; Hasan et al., 1999; Caleon and Subramaniam, 2010a, 2010b).
Recently, confidence testing has begun to appear in the chemistry education research literature (Caleon and Subramaniam, 2010a, 2010b; McClary and Bretz, 2012; Brandriet and Bretz, 2014). In a series of studies by Caleon and Subramaniam (2010a, 2010b), the authors developed the Wave Diagnostic Instrument in order to identify alternate conceptions that students held about waves. In these studies, genuine alternate conceptions were identified when students chose an incorrect distracter at a frequency of greater than 10% above chance and when the average confidence rating was greater than 3.5 on a 1–6 scale (greater than 50%). In these studies, a Likert scale was used for the confidence tier moving from “Just Guessing” at one end through “Very Unconfident,” “Unconfident,” “Confident,” “Very Confident,” to “Absolutely Confident” at the other end of the scale. In these studies, Caleon and Subramaniam (2010a, 2010b) introduced the Confidence Discrimination Quotient (CDQ) as a statistic for the standardized mean difference between the average confidence of the correct and incorrect students for each item. In this study, Caleon and Subramaniam (2010b) identified several items in which the CDQ values were negative, meaning that students who chose incorrect responses had greater confidence than their correct peers.
When creating a measurement, several decisions must be made regarding the scales used. Controversy exists within research regarding the appropriateness of conducting interval and ratio level analyses on ordinal data (e.g. Likert scales). The degree of difference between the categories in an ordinal scale may not be uniform (e.g., the difference between ‘Strongly Agree’ and ‘Agree’ may not be equal to the difference between ‘Agree’ and ‘Neutral’) (Stevens, 1946; Knapp, 1990), which could potentially be problematic when conducting statistical analyses, such as means and standard deviations. In a separate study, McClary and Bretz (2012) developed a concept inventory called ACID I to identify organic chemistry students' alternate conceptions and associated confidence about acid strength. In this study, the authors attempted to reduce these limitations by using an interval confidence tier that asked students to mark their confidence with an ‘X’ along an continuous scale from 0% (Just Guessing) to 100% (Absolutely Certain). McClary and Bretz (2012), identified several genuine student alternate conceptions and negative CDQ values, suggesting that the ACID I measures several robust student misconceptions. Based on this argument, the ROXCI also uses a continuous confidence scale similar to that used on the ACID I (Brandriet and Bretz, 2014).
Study significance
Dunning (2011) argues that there are many instances in life where individuals exhibit meta-ignorance and that some of these instances have no repercussions on their lives. However, in instances where knowledge deficiencies have implications for individuals' day-to-day activities, it becomes imperative to determine what deficiencies exist. However, it is impossible to expect individuals to identify these deficiencies on their own (Dunning, 2011). This outlook is not only true in the field of psychology, but also for chemistry students. The goal of this study is to characterize students' meta-ignorance regarding their understandings of redox concepts, and to provide chemistry instructors with examples of misconceptions that students hold post-instruction and post-assessment on redox content. Misconceptions that students hold are detrimental to future learning processes, and redox concepts are foundational to many chemical and biological processes that are recommended for an American Chemical Society approved Bachelor's degree curriculum (ACS, 2008). Students who are meta-ignorant are burdened by not only holding misconceptions, but also by being grossly unaware that their mental models are faulty, as they will continue to rely upon such misconceptions during their learning processes (Dunning, 2011).Research questions
This research uses cluster analysis to explore the extent to which students who have been taught and tested about redox reactions are meta-ignorant regarding their understandings of redox concepts. A robust description of each cluster in terms of the students' average confidence, item difficulties, and Confidence Discrimination Quotients (CDQ) (Caleon and Subramaniam, 2010b) are described below. Finally, examples of students' misconceptions with high confidence are discussed in order to help instructors understand the difficulties that students have in the chemistry classroom. The research questions that guided this study include:1. What is the nature of the relationship between students' understandings and confidence as measured by the ROXCI?
(a) Are students meta-ignorant about their understandings of redox concepts?
2. What misconceptions do students hold regarding electron transfer and oxidation numbers?
Methods
Student samples & data collection
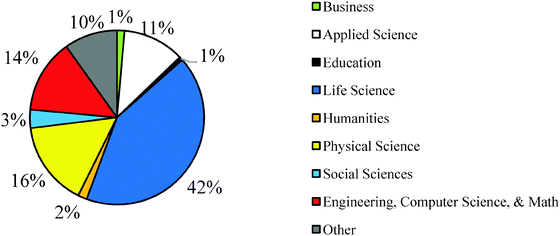
Institutional Review Board (IRB) approval for human subjects research was obtained from the colleges and universities sampled for this study prior to collecting students' data. Data was collected from two distinct student samples. Sample 1 consisted of 1083 students in the first-semester of first year university chemistry called general chemistry I (GC1) in the United States. The students in Sample 1 were from 10 colleges/universities from 9 states within the United States. Instructors were recruited primarily through a chemistry education research listserv and by advertising the research study at conferences. In order to standardize the data collection methods, instructors were given detailed instructions for administering the ROXCI to their students and were given a script to read to students before the students took the assessment. The instructors were asked to implement the ROXCI to their students after they had been taught and tested on first-semester redox concepts (e.g., electron transfer and oxidation number concepts, often couched within the major classes of chemical reactions). All students answered a paper-and-pencil version of ROXCI, however, only those students who consented to allow their data to be used in the research study and did not have any missing data were included in the analysis. Students in Sample 1 marked their confidence by placing an ‘X’ on the scale from 0% to 100% (see Fig. 1 and 2). Sample 1 was 58% female and 42% male (3 students did not report their sex), and the students reported a variety of different academic majors (Fig. 3).The ROXCI was also administered in an online format to Sample 2 who were students in the second-semester of first year university chemistry (GC2) at a large, Midwestern research university. No students from this university were part of Sample 1. Students answered the ROXCI using a department computer lab near the end of second-semester general chemistry, immediately prior to any instruction on electrochemistry or any experiments regarding electrochemistry and electrolysis. The continuous confidence tier scale was modified for use in online data collection software; students in Sample 2 did not mark an ‘X’ on the continuous scale shown in Fig. 1 and 2. Rather, they indicated their confidence using check-boxes from 0% to 100%, incremented every 5%. The option of 50% was not included, however, in order to address the local instructor's concern that students might choose a ‘neutral’ confidence response for each question. A total of 554 students consented to participate and 510 students remained for analysis after removing missing data. Demographic information was not collected for these students.
Data preparation
After the GC1 students completed the ROXCI, the paper-and-pencil assessments were mailed back to the researchers for scoring. A template ruler was created to simplify the scoring process for the confidence tier and estimated to nearest 1%. The students' multiple-choice and confidence responses were entered into a Microsoft Excel spreadsheet for data analysis. The accuracy of both the confidence measurements and the entered data were assessed by re-evaluating a random 10% of data from each college/university. For the GC2 students, the data was exported from survey software within a course management system, scanned for missing data, and prepared so that it was in a form practical for data analysis. Data analyses were conducted through the use of SAS 9.3, SPSS 21, and Microsoft Excel 2013.Cluster analysis
Cluster analysis is a generic term to describe a variety of statistical techniques that can be used to identify and describe homogenous groups of entities, namely, clusters within a dataset (Mirkin, 2005). A chemistry analogy to cluster analysis would be classifying reactions as redox, combustion, precipitation, or acid–base. Reactions can be categorized or “clustered” according to empirical similarities, e.g., when electrons transfer or protons transfer. Clustering methods are particularly useful for exploring large datasets and are a convenient way of organizing data into smaller groupings (Everitt et al., 2011). Cluster analyses suggest structure within a dataset based upon relationships between variables.Cluster analysis techniques are often considered exploratory and within a family of statistical techniques used for data mining (Everitt et al., 2011). Accordingly, cluster analysis does not provide the researcher with pre-defined clusters. While, the cluster solution identifies students who respond in a similar manner, the researcher must interpret these response patterns. That is, the researcher must craft an explanation of why the students are so clustered and determine the significance of the cluster's existence within, in this case, a chemistry context. In this study, students were clustered based upon patterns in both their total scores and their average confidence.
Results & discussion
Descriptive statistics
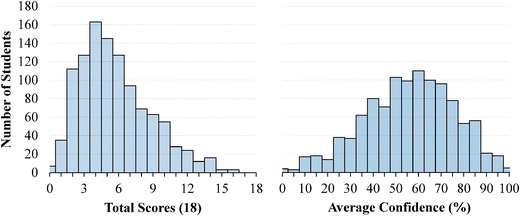
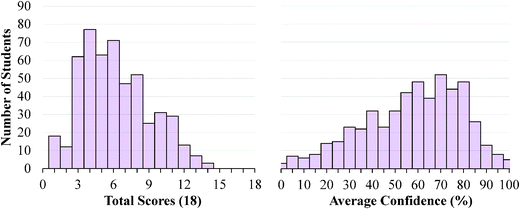
The descriptive statistics for the students' total scores and average confidence, as well as the Cronbach-α (Cronbach, 1951) and Ferguson-δ (Ferguson, 1949) for the ROXCI data can be found in Table 1. Scores on the ROXCI can range from 0 to 18; the mean score was 5.7 for GC1 and 6.2 for GC2. Therefore, ROXCI was quite difficult for both samples as can be seen by the total scores in Fig. 4 and 5. By contrast, students' average confidence was skewed toward the higher end of the 0–100% confidence range (also shown in Fig. 4 and 5), with an average confidence of 55.9% for GC1 and 57.5% for GC2. Clearly these histograms depict a disconnect between students' total scores and average confidence. However, histograms are insufficient for characterizing a possible relationship between total scores and average confidence about redox concepts, so students' total scores and average confidence were examined using scatterplots (Fig. 6a and 7a). Because the data was skewed, a Spearman Rank-Order correlation (also known as Spearman's rho) coefficient was used to evaluate whether or not a relationship existed. A medium positive correlation for both the GC1 (ρ = 0.433) and GC2 (ρ = 0.325) students suggests that there is a moderate relationship between students' total scores and average confidence. However, inspection of Fig. 6a and 7a reveal large variability within the students' average confidence, especially for the students with low total scores. Such variability warranted additional investigation in order to characterize the students' responses.| GC1 | GC2 | |||
|---|---|---|---|---|
| Total score (0–18) | Average confidence (0–100%) | Total score (0–18) | Average confidence (0–100%) | |
| N | 1083 | 1083 | 510 | 510 |
| Mean | 5.7 | 55.9% | 6.2 | 57.5% |
| Std. dev. | 3.1 | 19.7% | 2.9 | 21.6% |
| Minimum | 0.0 | 0.2% | 1.0 | 0.0% |
| Median | 5.0 | 56.9% | 6.0 | 60.6% |
| Maximum | 16.0 | 99.8% | 14.0 | 100.0% |
| Cronbach-α | 0.68 | 0.94 | 0.62 | 0.96 |
| Ferguson-δ | 0.95 | 0.99 | 0.95 | 0.99 |
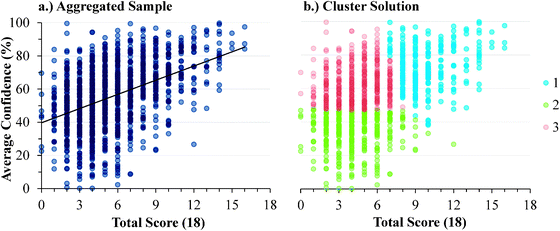 | ||
| Fig. 6 GC1 students' average confidence plotted against total scores for: (a) the aggregate of the sample, (b) the cluster solutions. | ||
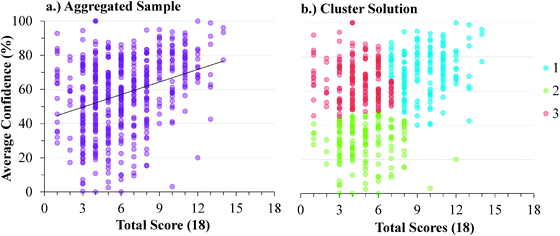 | ||
| Fig. 7 GC2 students' average confidence plotted against total scores for: (a) the aggregate of the sample, (b) the cluster solutions. | ||
Cluster analyses
The TwoStep method uses a log-likelihood distance measurement that works well for both categorical and continuous variables. The distance measure assumes that the variables in the model are independent, that each continuous variable is normally distributed, and that each categorical variable has a multinomial distribution (IBM SPSS Statistics, 2011; Norušis, 2012). However, this is rarely the case in practice, and the literature describes that the clustering algorithm is fairly robust to violations in these assumptions (IBM SPSS Statistics, 2011; Norušis, 2012). Further, the order in which the cases are arranged in the dataset can influence the final solution (IBM SPSS Statistics, 2011). Therefore, the stability of the cluster solution was assessed and is described below.
| Cluster | Cluster description | GC1 | GC2 | ||||
|---|---|---|---|---|---|---|---|
| N | Average total score (SD) | Average confidence (SD) | N | Average total score (SD) | Average confidence (SD) | ||
| 1 | Moderate scores, high confidence | 264 | 10.0 (2.0) | 73.0% (13.0%) | 158 | 9.6 (1.7) | 72.2% (13.2%) |
| 2 | Lowscores, low confidence | 334 | 4.2 (2.0) | 32.7% (11.1%) | 148 | 4.9 (1.9) | 30.0% (12.0%) |
| 3 | Low scores, high confidence | 485 | 4.4 (1.7) | 62.7% (10.7%) | 204 | 4.5 (1.6) | 66.0% (11.7%) |
Analytic interpretation of the cluster solution offers a meaningful characterization of the student sample that neither the histograms nor the correlations could provide. In both samples, more than 1/3 of the students responded with high confidence about their responses, despite scoring very poorly on the ROXCI assessment (i.e., Cluster 3). This is highly suggestive of the aforementioned Dunning–Kruger effect in which students hold illusory confidence and rate their abilities higher than is accurate (Kruger and Dunning, 1999; Dunning, 2011). Similar to Cluster 3, the students in Cluster 1 also responded with high confidence about their responses to the ROXCI, and while Cluster 1 on average scored higher than Cluster 3, their average scores were still only at that of the mid-point of the total possible scale. This again suggests that these students held illusory high confidence in comparison to their ROXCI responses, but to a lesser degree than the students in Cluster 3. While the students in Cluster 2 scored poorly on ROXCI, unlike Cluster 1 or 3, these students responded with low confidence which suggests they were aware that that they were performing poorly.
As noted above, a limitation of the TwoStep cluster method is that the results are dependent upon the order in which the objects (i.e. students) exist in the dataset. In order to examine the stability of the solution, IBM SPSS Statistics (2011) recommends repeating the cluster analysis with the objects (i.e. students) sorted in different random orders. Therefore, the cluster analysis was replicated 9 additional times. The order of the students in the dataset was randomly redistributed each time based on a random number generator. A 3 cluster solution was generated 7 out of 10 times for the GC1 student sample and 8 out of 10 times for the GC2 student sample. Furthermore, the replicate solutions produced scores and confidence results very similar to that summarized in Table 2. (For additional information, see the Appendix.)
Item analyses
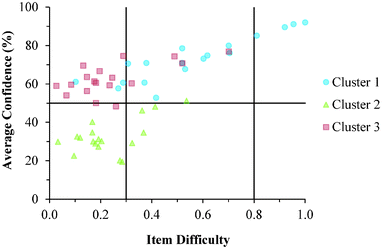
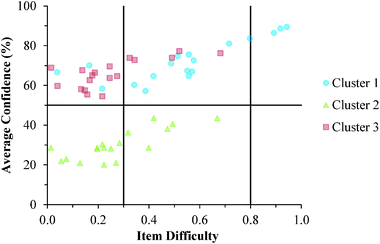
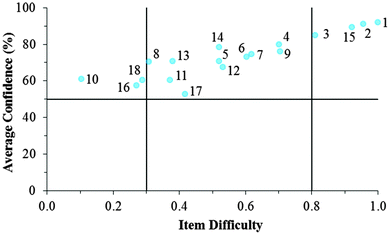
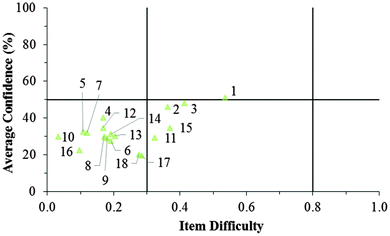
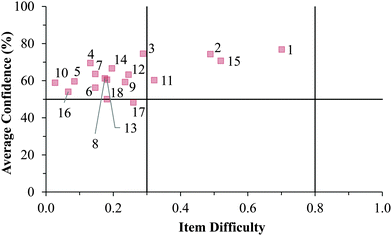
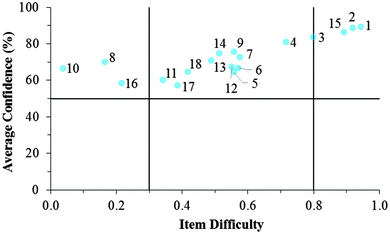
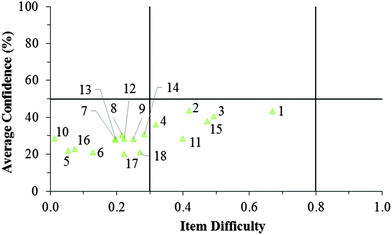
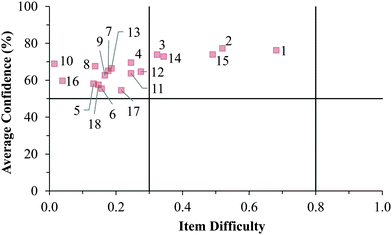
Cluster 3. As can be seen in Fig. 8 and 9, the students in Cluster 3 had the greatest mismatch between item difficulties and average confidence. For both the GC1 and GC2 samples, 13 of the 18 items had difficulty indices below 0.30 (very difficult items) with average confidence greater than 50%. Therefore, students were highly confident despite that the items were very difficult. A total of 11 of these 13 items were common across both the GC1 and GC2 student samples. While the cutoffs for difficulty and confidence are somewhat arbitrary designations established in the research literature, such cutoffs do help to facilitate an interpretation of the data. This analysis suggests that not only is there a large group of students (Cluster 3 contains nearly 50% of the sample in both samples) who are essentially unaware that they are choosing responses which are misconceptions, but also that this effect is fairly stable across GC1 and GC2 students. Also in Fig. 8 and 9, only a very small incline is observed in the relative slope of the items which can be interpreted to mean that the students in Cluster 3 were generally unable to distinguish whether an item was relatively difficult or easy. (Note that even the easiest items for both samples still had less than 80% of the students responding correctly.) Consequently, students' were unable to recognize whether their understandings were valid knowledge or misconceptions, and the ROXCI was able to detect the meta-ignorance exhibited by these students.
Cluster 1. On average, the students in Cluster 1 answered more questions correctly than the students in either Cluster 2 or 3. Despite being the strongest students, instances of mismatch between confidence and item difficulty were still observed in which 3 items had difficulty indices below 0.30, but average confidence greater than 50%. Therefore, even the strongest students in the samples still held robust misconceptions about redox concepts, and the ROXCI can be used to detect these misconceptions. Note that 2 of these 3 items were common to both the GC1 and GC2 student samples.
Cluster 2. The items tended to be very difficult for the students in Cluster 2, but for this group of students, their associated confidence was also quite low. This group did not seem to exhibit meta-ignorance about their responses as Cluster 1 and 3 did, because their low confidence matched with their poor performance. While these students were not meta-ignorant, the items on the ROXCI do encompass basic redox concepts (Brandriet and Bretz, 2014), and the students in Cluster 1 did not have a strong conceptual grasp of these concepts. Because this effect was also observed in the GC2 sample, it is likely that such students carry this deficiency forth from GC1 to GC2 while trying to learn electrochemistry concepts in second-semester general chemistry (GC2).
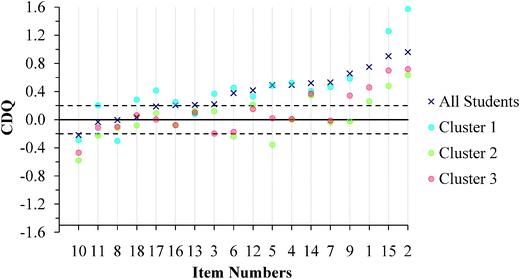 | ||
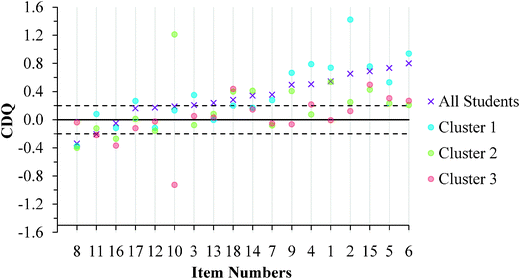
| Fig. 10 GC1 students' CDQ values ordered by results for the aggregated sample. (No CDQ value exists for Item 1 in Cluster 1 because all students responded correctly.) | ||
One difficulty with interpreting CDQ values, however, is that no benchmarks exist for interpreting the magnitude of the CDQ. Just because a CDQ value is negative is not sufficient evidence to claim that a meaningful difference exists between the average confidence of correct and incorrect students. Because the CDQ is equivalent to a standardized mean difference effect size statistic (Ferguson, 2009), this study used Cohen's (1988) benchmarks for standardized mean differences to signify the degree of the differences. Therefore, the magnitude of the difference was identified as small (0.20), medium (0.50), or large (0.80). Positive values of 0.20 or greater indicate the correct students were more confident than the incorrect students, negative values of −0.20 or less indicate the incorrect students were more confident than the correct students, and values between −0.20 and 0.20 indicate that the difference between the correct and incorrect students was trivial (near zero). Therefore, benchmark values of 0.20, 0.00, and −0.20 are included in Fig. 10 and 11 to aid with interpretation of the CDQ values for each cluster of students.
Cluster 3. For the GC1 students in Fig. 10, a total of 12 items had CDQ values that indicate that the correct and incorrect students' average confidence were similar (CDQ value between −0.20 and 0.20), while 1 item had a small negative difference to suggest that the incorrect students were more confident than their correct peers. Similar results were also found with the GC2 students (Fig. 11) with 10 items having trivial differences in confidence, and 3 items indicating the incorrect students were more confident than the correct students. Because the students in Cluster 3 were also fairly confident in their responses (Fig. 8 and 9), these students were confident independent of whether they chose correct responses or redox misconceptions.
Cluster 1. Similar to Cluster 3, the students in Cluster 1 also exhibited instances of the Dunning–Kruger effect; however, there were fewer instances in Cluster 1 than in Cluster 3. For the GC1 students there was 1 item where the difference between correct and incorrect students was trivial and 2 instances where the incorrect students were more confident than the correct students. Interestingly, this effect was not just invariant across the GC1 to GC2 students, but rather the effect seemed to increase. There were 6 instances where the CDQ was trivial and 1 instance where the CDQ was negative but small. Since the students in Cluster 1 had the highest scores on the ROXCI and they were highly confident about their responses, Fig. 10 and 11 suggest that even the strong students can hold robust misconceptions about redox concepts. However, for a majority of the items the CDQ values were larger for Cluster 1 than for Cluster 3, which suggests that students in Cluster 1 were better aware when their responses were incorrect.
Cluster 2. The students in Cluster 2 responded with low average confidence across the ROXCI items. Caution should be taken when interpreting the CDQ results because a higher probability of guessing is inferred from the students' reported low confidence. Higher probability of guessing suggests that students may not be accurately placed into correct and incorrect student groups, as is necessary for the CDQ. For the GC1 students, there were 9 instances of a trivial difference between correct and incorrect students and 4 instances where incorrect students were more confident than the correct students. For the GC2 students, there were 7 instances of a trivial difference between correct and incorrect students and 2 instances where incorrect students were more confident than the correct students.
The CDQ results provide further support for the argument that students' confidence about their understandings of redox is often independent of whether or not their understandings are correct, and therefore, students hold robust redox misconceptions. Since the students who chose the ROXCI distractors were often just as confident or more so than their correct peers, these results further confirm the response process validity of the ROXCI distractors (Brandriet and Bretz, 2014).
Students' misconceptions
The previous analyses clearly show that not only do students have incorrect understandings about redox concepts, but also that they are often unaware of their misconceptions. However, investigating students' meta-ignorance is more than just exploring whether students were correct or incorrect. Concept inventory questions like those on the ROXCI can provide some of the richest data by carefully examining students' responses to individual items. Students' misconceptions regarding oxidation numbers, charge, and electron transfer are discussed below in the context of confidence data. As a reminder, the data below reflect students' ideas after classroom instruction and testing about redox concepts at their local institutions.Table 3 summarizes student response data for these two misconceptions. For question 13, 31.4% of GC1 and 28.2% of GC2 students chose response D, and they did so with 53.7% and 56.3% average confidence, respectively. For question 7, 34.2% of GC1 and 28.0% of GC2 students chose response D, with 54.0% and 53.0% average confidence, respectively. These results indicate that students not only incorrectly applied oxidation numbers, but they also failed to differentiate them from charges. Once again, when partitioning these results by the cluster solution a pattern emerged in which Cluster 1 and 3 held misconceptions with high confidence (with a greater percentage of Cluster 3 than Cluster 1 choosing the misconceptions described), and Cluster 2 choosing distractors but with correspondingly low confidence.
| In CuSO4(aq), sulfur and sulfate have both oxidation numbers and charges [question 13, response D] | In the reaction shown in Fig. 2, NO3− is oxidized and H+ is reduced [question 7, response D] | ||||
|---|---|---|---|---|---|
| GC1 | GC2 | GC1 | GC2 | ||
| a N GC1 = 264, NGC2 = 158. b N GC1 = 334, NGC2 = 148. c N GC1 = 485, NGC2 = 204. | |||||
| Cluster 1a | Number of students (% of cluster) | 53 (20.1%) | 34 (21.5%) | 36 (13.6%) | 22 (13.9%) |
| Mean confidence (%) | 70.4% | 70.0% | 73.9% | 69.3% | |
| Cluster 2b | Number of students (% of cluster) | 116 (34.7%) | 41 (27.7%) | 147 (44.0%) | 53 (35.8%) |
| Mean confidence (%) | 33.4% | 27.9% | 34.1% | 27.4% | |
| Cluster 3c | Number of students (% of cluster) | 171 (35.3%) | 69 (33.8%) | 187 (38.6%) | 68 (33.3%) |
| Mean confidence (%) | 62.2% | 66.3% | 65.7% | 67.7% | |
| Electrons transfer from iron to cadmiumd [question 9, response B] | Electrons transfer as the bond between cadmium and sulfate breaks, and as iron bonds with sulfate [question 10, response A] | ||||
|---|---|---|---|---|---|
| GC1 | GC2 | GC1 | GC2 | ||
| a N GC1 = 264, NGC2 = 158. b N GC1 = 334, NGC2 = 148. c N GC1 = 485, NGC2 = 204. d Correct response. | |||||
| Cluster 1a | Number of students (% of cluster) | 186 (70.5%) | 88 (55.7%) | 176 (66.7%) | 115 (72.8%) |
| Mean confidence (%) | 80.1% | 82.0% | 64.4% | 67.6% | |
| Cluster 2b | Number of students (% of cluster) | 60 (18.0%) | 37 (25.0%) | 219 (65.6%) | 90 (60.8%) |
| Mean confidence (%) | 28.5% | 34.5% | 35.3% | 32.2% | |
| Cluster 3c | Number of students (% of cluster) | 114 (23.5%) | 34 (16.7%) | 360 (74.2%) | 145 (71.1%) |
| Mean confidence (%) | 65.3% | 61.5% | 61.8% | 71.3% | |
Conclusions
The results of this study demonstrate that not only do students hold misconceptions about redox concepts, but also that they are often unaware that they hold such misconceptions. However, asking students to identify deficiencies in their own knowledge by themselves is an intrinsically difficult task that will likely be unproductive (Carter and Dunning, 2008; Dunning, 2011). Without proper intervention, students may continue with this thinking and reasoning during the learning process. This is especially problematic with redox concepts because they are fundamental to so many chemical and biological processes. The ROXCI assesses both students' understandings and confidence about symbolic and particulate redox concepts. Through the use of cluster analysis, groups of students were identified based on their responses to the ROXCI, resulting in an in-depth understanding of the student sample that would not have otherwise been accessible with an analysis of only the aggregate sample. A 3 cluster solution was identified in which Cluster 1 had moderate total scores and high average confidence, Cluster 2 had low total scores and low average confidence, while Cluster 3 had low total scores, but high average confidence. While Cluster 3 exhibited the most instances of meta-ignorance, both Clusters 1 and 3 displayed instances of meta-ignorance based on the results of the analyses of students' average confidence, item difficulty, and CDQ values.One similarity that existed across the 3 clusters was that the students held deficiencies in their understandings of redox concepts, despite having been taught and tested by their instructor on redox concepts prior to taking the ROXCI. This study specifically describes students' misconceptions involving oxidation numbers and electron transfer concepts including students' inabilities to distinguish between oxidation numbers and charges, changes in charges on polyatomic ions and molecules can be used to identify oxidized and reduced species, and electron transfer occurs as the bond between cation and spectator ion breaks/forms. These misconceptions are not unique to one specific pedagogy or curriculum. The data in this study were obtained from approximately 1600 first year university chemistry students from a variety of colleges/universities as well as different classroom environments. Redox misconceptions are clearly ubiquitous in the first year university chemistry classrooms and were prevalent in both the GC1 and GC2 samples. This suggests that students may carry these misconceptions from GC1 to GC2 and use them as prior knowledge upon which they may build electrochemistry concepts.
While the term misconception was specifically used to describe students' incorrect ideas for the purposes of this study, it is difficult to truly identify whether a students' incorrect understanding is a misconception, naïve idea, alternate conception, etc. This is especially true since there are many competing views of what constitutes a misconceptions (Strike and Posner, 1992; diSessa, 1993; Chi et al., 1994; Chi and Roscoe, 2002). However, the addition of the confidence tier provides an additional piece of evidence that students robustly hold their incorrect ideas. Future research should continue to evaluate the relationship between students' misconceptions and their confidence, such as identifying specific confidence cutoffs for determining what constitutes a robustly held misconception. Future studies should also continue to investigate students' misconceptions in additional samples of GC1 and GC2 students, as well as students beyond first year university chemistry.
Implications for teaching
Instructors need to help students gauge the effectiveness of their understandings so that students do not erroneously use redox misconceptions as a foundation for building future knowledge structures. The ROXCI can be used to assess students' understandings and confidence of symbolic and particulate redox concepts. (Colleagues who are interested in using the ROXCI in their classroom should contact the corresponding author to obtain a copy.) In order to help shed light on students' meta-ignorance, instructors could use the questions on the ROXCI in tandem with clickers to help students not only evaluate the accuracy of their own understanding, but also evaluate their confidence. Techniques such as think-pair-share may help students uncover potential flaws in reasoning through discussion with their classmates. Lastly, instructors should attempt to align their pedagogical goals (e.g., conceptual understanding) with their local assessments. If the instructors do not assess deep conceptual understandings, the students will be less motivated learn the concepts.A deep understanding of redox requires more than the rote memorization and application of oxidation numbers. Instructors should focus on emphasizing the concepts involved in redox reactions. This includes what substances collide, how the electrons transfer, what makes an oxidation number different from that of charge, and how oxidation numbers and electron transfer relate to one another. In order to facilitate students' conceptual understanding, a variety of representations should be used by instructors. Representations that depict redox reactions often contain implicit features that may be obvious to the experts, but students struggle to decode such information (Stains and Talanquer, 2008). In this study, some students believed that the electrons transfer through bond breaking/forming between the cation and spectator ion because they saw the spectator ion direct adjacent to the aqueous cation in the chemical equation. This suggested to some students that a physical bond exists between these two entities, despite the phase indication of (aq). Instructors should help students encode the information shown in representations and challenge them to make connections across the symbolic, macroscopic, and particulate domains.
While this study did not collect empirical evidence for what specific strategies will and will not work to remediate the misconception presented in this study, the authors speculate that students who are highly confident in their misconceptions may require different strategies for conceptual change than students who are aware that their knowledge is flawed. It is possible that students who are aware their knowledge is flawed, may be receptive to conceptual change merely by having the correct conception described to them. However, students with robust misconceptions may require significant instructional intervention such as the learning cycle, discrepant events, etc. Instructors may find that inducing cognitive dissonance in students' mental models may help the students see the limitations of their own understandings. For example, the students who believed that the electrons transfer through bond breaking/forming between the cation and spectator ion could examine the conductivity of aqueous solutions versus just ionic solids. This may help students begin to realize that cations and anions are not physically bonded in aqueous solutions, and therefore, electrons could not possibly transfer in this manner.
Implications for research
The use of the confidence tier for concept inventory design and development is a novel and newly emerging research practice within chemistry education (Caleon and Subramaniam, 2010a, 2010b; McClary and Bretz, 2012; Brandriet and Bretz, 2014). The confidence tier helps identify whether students' multiple-choice responses are a result of genuine understandings or guessing (Caleon and Subramaniam, 2010a). This may help the researcher provide additional evidence for the response process validity of concept inventory data. However, with the development of any assessment tool, many decisions have to be made regarding how to collect students' data. The ROXCI uses an interval confidence tier originally published by McClary and Bretz (2012), in order to reduce the potential limitations created by ordinal scales (Stevens, 1946; Knapp, 1990). Additionally, the authors believe that the 0% to 100% scale may be more meaningful to students since colloquially it is not uncommon for individuals to describe their confidence in terms of a percentage (e.g. I am 70% confident that…). However, there are limitations to the interval confidence measurement. The authors do not presume to claim that students' confidence ratings are different when measured to ±1% confidence. Certainly, the ones' place is the uncertain digit for the measurements made in this study. However, the authors believe that the 0–100% scale is an improvement upon previously used Likert scales when measuring confidence. Future studies could further investigate the methods used to measure students' confidence.This study makes an important contribution to both the concept inventory and the chemistry education research literature by not only identifying students' redox misconceptions and their associated confidence, but also by using cluster analysis to distinguish patterns in students' responses in order to identify meta-ignorance. Because cluster analysis provides a tool to partition the students into groups based upon patterns in their responses to ROXCI items – and their confidence – a different and more detailed analysis can be achieved about students' understandings than can be generated by simply examining the sample in aggregate. When developing pedagogy to target students' misconceptions, creating a “one-size-fits-all” pedagogical strategy will not likely be optimal for a classroom with varying levels of meta-ignorance (e.g., Clusters 1, 2, and 3). However, tailoring pedagogy to each individual student is also not plausible, especially in a large lecture classroom. Therefore, the results of the cluster analysis suggest a more manageable estimation of the meaningful differences amongst the students that likely exist within a general chemistry classroom. Cluster analysis is a tool that could be used to examine a variety of research questions in chemistry education, and future studies should consider using it to help further recognize the natural groupings in student data. Future studies should continue to expand upon the best practices for using cluster analysis and for determining the validity, reliability, and stability of the cluster solutions.
Appendix
Stability of the cluster solution
The observations (i.e. students) in both the GC1 and GC2 datasets were reordered based on a random number generator in order to evaluate the stability of the cluster solution. The data was reordered 9 times beyond that of the initial solution for a total of 10 cluster solutions. For the GC1 students, a 3 cluster solution was identified in 7 out of 10 of the replicate solutions, and for the GC2 students, a 3 cluster solution was identified in 8 out of 10 of the replication solutions. Because the 3 cluster solution was identified as the most common solution, this was the solution accepted for the manuscript. Furthermore, the replicate solutions produced scores and confidence results very similar to that of the primary solution described in the body of the manuscript (Tables 5 and 6).| Solution | N | Average total score | Average confidence (%) | ||||||
|---|---|---|---|---|---|---|---|---|---|
| 1 | 2 | 3 | 1 | 2 | 3 | 1 | 2 | 3 | |
| a 3 cluster solution. | |||||||||
| Primarya | 264 | 334 | 485 | 10.0 | 4.2 | 4.4 | 73.0 | 32.7 | 62.7 |
| 2a | 249 | 411 | 423 | 10.1 | 3.7 | 5.1 | 73.9 | 36.8 | 64.0 |
| 3a | 272 | 334 | 477 | 9.9 | 4.2 | 4.3 | 73.5 | 32.7 | 62.3 |
| 4a | 227 | 423 | 433 | 10.4 | 4.0 | 4.9 | 73.4 | 36.4 | 65.9 |
| 5a | 250 | 292 | 541 | 10.0 | 3.7 | 4.8 | 74.9 | 31.4 | 60.4 |
| 6a | 262 | 404 | 417 | 10.1 | 4.1 | 4.5 | 72.9 | 35.6 | 65.0 |
| 7a | 267 | 339 | 477 | 10.0 | 4.2 | 4.4 | 73.0 | 32.9 | 62.8 |
| 8 | 413 | 670 | — | 8.5 | 4.0 | — | 72.8 | 45.5 | — |
| 9 | 402 | 681 | — | 8.4 | 4.1 | — | 73.9 | 45.3 | — |
| 10 | 541 | 542 | — | 7.4 | 4.0 | — | 71.3 | 40.6 | — |
| Solution | N | Average total score | Average confidence (%) | |||||||||
|---|---|---|---|---|---|---|---|---|---|---|---|---|
| 1 | 2 | 3 | 4 | 1 | 2 | 3 | 4 | 1 | 2 | 3 | 4 | |
| a 3 cluster solution. | ||||||||||||
| Primarya | 158 | 148 | 204 | — | 9.6 | 4.9 | 4.5 | — | 72.2 | 30.0 | 66.0 | — |
| 2a | 159 | 148 | 203 | — | 9.6 | 4.9 | 4.5 | — | 72.2 | 30.0 | 66.0 | — |
| 3a | 159 | 148 | 203 | — | 9.6 | 4.9 | 4.5 | — | 72.2 | 30.0 | 66.0 | — |
| 4a | 185 | 143 | 182 | — | 9.2 | 5.0 | 4.1 | — | 71.5 | 29.6 | 65.2 | — |
| 5a | 158 | 148 | 204 | — | 9.6 | 4.9 | 4.5 | — | 72.2 | 30.0 | 66.0 | — |
| 6a | 158 | 148 | 204 | — | 9.6 | 4.9 | 4.5 | — | 72.2 | 30.0 | 66.0 | — |
| 7a | 159 | 148 | 203 | — | 9.6 | 4.9 | 4.5 | — | 72.2 | 30.0 | 66.0 | — |
| 8a | 158 | 148 | 204 | — | 9.6 | 4.9 | 4.5 | — | 72.2 | 30.0 | 66.0 | — |
| 9 | 214 | 296 | — | — | 8.9 | 4.3 | — | — | 70.5 | 48.1 | — | — |
| 10 | 106 | 212 | 111 | 81 | 10.2 | 4.7 | 4.0 | 8.0 | 77.9 | 67.3 | 28.4 | 45.0 |
Item difficulty and confidence
Fig. 12–17 provide the individual item numbers for the GC1 and GC2 students' average confidence vs. item difficulty shown in Fig. 8 and 9.Confidence Discrimination Quotient
The Confidence Discrimination Quotient (CDQ) is calculated by taking the difference between the average confidence of the correct students (CFC) and incorrect students (CFW), and dividing it by the standard deviation (SD) of the students' confidence (Caleon and Subramaniam, 2010b). The CFC, CFW, SD, and CDQ values for the GC1 and GC2 students can be found in Tables 7 and 8.| Items | Cluster 1a | Cluster 2 | Cluster 3 | All students | ||||||||||||
|---|---|---|---|---|---|---|---|---|---|---|---|---|---|---|---|---|
| CFC | CFW | SD | CDQ | CFC | CFW | SD | CDQ | CFC | CFW | SD | CDQ | CFC | CFW | SD | CDQ | |
| a All of the students responded correctly to question 1, and therefore, a CDQ value cannot be calculated. | ||||||||||||||||
| 1 | 92.0 | — | 12.6 | — | 54.5 | 47.4 | 27.1 | 0.260 | 79.4 | 70.9 | 18.4 | 0.460 | 78.0 | 58.8 | 25.6 | 0.748 |
| 2 | 92.1 | 71.9 | 12.8 | 1.574 | 57.0 | 40.0 | 26.8 | 0.637 | 82.0 | 67.0 | 20.8 | 0.719 | 81.2 | 55.0 | 27.3 | 0.959 |
| 3 | 86.3 | 80.2 | 16.6 | 0.369 | 49.8 | 47.0 | 24.0 | 0.120 | 71.9 | 75.6 | 19.0 | −0.196 | 72.0 | 66.5 | 24.8 | 0.220 |
| 4 | 83.1 | 72.5 | 20.2 | 0.524 | 40.2 | 40.1 | 23.2 | 0.003 | 69.7 | 69.5 | 20.6 | 0.009 | 72.4 | 59.3 | 26.6 | 0.493 |
| 5 | 76.5 | 64.9 | 23.8 | 0.487 | 25.6 | 33.4 | 21.8 | −0.354 | 60.1 | 59.6 | 22.9 | 0.021 | 64.8 | 51.4 | 27.3 | 0.491 |
| 6 | 77.7 | 66.2 | 25.5 | 0.455 | 23.2 | 28.3 | 21.5 | −0.239 | 52.4 | 56.9 | 26.3 | −0.173 | 59.8 | 48.4 | 30.2 | 0.377 |
| 7 | 78.9 | 68.3 | 22.8 | 0.465 | 31.4 | 32.1 | 22.9 | −0.033 | 63.4 | 63.7 | 23.2 | −0.012 | 67.9 | 52.8 | 28.6 | 0.530 |
| 8 | 66.2 | 72.5 | 21.0 | −0.300 | 27.8 | 30.4 | 23.1 | −0.115 | 59.4 | 61.7 | 23.1 | −0.099 | 53.8 | 53.9 | 27.9 | −0.005 |
| 9 | 80.1 | 66.4 | 23.6 | 0.582 | 28.5 | 29.0 | 22.8 | −0.023 | 65.3 | 57.4 | 23.1 | 0.343 | 66.8 | 47.6 | 29.3 | 0.656 |
| 10 | 54.2 | 61.9 | 26.5 | −0.291 | 17.6 | 30.3 | 22.0 | −0.576 | 48.4 | 59.2 | 23.1 | −0.468 | 44.8 | 50.8 | 27.4 | −0.218 |
| 11 | 63.9 | 58.8 | 24.9 | 0.203 | 25.7 | 30.9 | 23.1 | −0.225 | 58.6 | 61.1 | 22.5 | −0.114 | 50.2 | 51.1 | 27.4 | −0.034 |
| 12 | 71.4 | 63.6 | 23.5 | 0.332 | 38.9 | 33.9 | 23.7 | 0.212 | 65.8 | 62.5 | 21.9 | 0.151 | 63.5 | 52.3 | 26.8 | 0.417 |
| 13 | 72.0 | 70.3 | 21.6 | 0.082 | 32.6 | 29.6 | 24.3 | 0.126 | 62.6 | 60.1 | 25.0 | 0.103 | 58.3 | 52.3 | 29.0 | 0.209 |
| 14 | 82.5 | 74.3 | 20.2 | 0.407 | 38.7 | 29.5 | 26.6 | 0.345 | 74.3 | 64.8 | 25.7 | 0.369 | 70.4 | 54.2 | 31.1 | 0.519 |
| 15 | 91.2 | 71.3 | 15.8 | 1.260 | 43.7 | 29.4 | 29.9 | 0.480 | 79.4 | 61.3 | 25.9 | 0.699 | 76.9 | 47.3 | 32.9 | 0.902 |
| 16 | 62.6 | 55.9 | 26.6 | 0.251 | 21.0 | 22.7 | 20.6 | −0.080 | 52.3 | 54.1 | 24.2 | −0.076 | 50.3 | 44.5 | 28.2 | 0.206 |
| 17 | 59.3 | 48.1 | 26.9 | 0.415 | 20.7 | 18.9 | 19.0 | 0.091 | 48.3 | 48.3 | 24.0 | 0.002 | 44.0 | 38.9 | 27.3 | 0.187 |
| 18 | 66.3 | 58.4 | 27.7 | 0.285 | 18.9 | 20.6 | 21.5 | −0.081 | 51.4 | 49.8 | 25.8 | 0.063 | 44.1 | 43.2 | 29.8 | 0.031 |
| Items | Cluster 1 | Cluster 2 | Cluster 3 | All Students | ||||||||||||
|---|---|---|---|---|---|---|---|---|---|---|---|---|---|---|---|---|
| CFC | CFW | SD | CDQ | CFC | CFW | SD | CDQ | CFC | CFW | SD | CDQ | CFC | CFW | SD | CDQ | |
| 1 | 90.1 | 79.4 | 14.4 | 0.740 | 47.8 | 34.8 | 24.1 | 0.540 | 76.2 | 76.3 | 17.1 | −0.007 | 74.3 | 60.0 | 26.2 | 0.545 |
| 2 | 90.5 | 68.1 | 15.8 | 1.422 | 47.4 | 40.8 | 26.4 | 0.250 | 78.3 | 76.2 | 17.3 | 0.123 | 77.8 | 60.2 | 27.0 | 0.654 |
| 3 | 84.8 | 78.9 | 16.9 | 0.350 | 39.7 | 41.4 | 22.8 | −0.076 | 74.5 | 73.6 | 18.0 | 0.053 | 69.8 | 64.4 | 26.0 | 0.208 |
| 4 | 85.0 | 71.2 | 17.4 | 0.791 | 37.4 | 35.7 | 23.2 | 0.076 | 72.7 | 68.5 | 19.2 | 0.217 | 71.4 | 57.9 | 26.9 | 0.504 |
| 5 | 71.5 | 56.1 | 28.9 | 0.532 | 26.3 | 21.6 | 20.0 | 0.232 | 65.4 | 57.0 | 27.3 | 0.306 | 67.2 | 44.0 | 31.5 | 0.735 |
| 6 | 79.3 | 50.5 | 30.6 | 0.941 | 24.7 | 20.4 | 20.8 | 0.209 | 61.9 | 54.2 | 28.4 | 0.269 | 68.0 | 41.7 | 32.9 | 0.800 |
| 7 | 75.2 | 69.3 | 21.2 | 0.278 | 26.7 | 28.4 | 20.2 | −0.081 | 64.2 | 65.3 | 21.9 | −0.052 | 63.6 | 53.6 | 28.2 | 0.355 |
| 8 | 63.5 | 71.4 | 21.3 | −0.373 | 23.8 | 32.1 | 20.9 | −0.400 | 67.0 | 67.8 | 21.5 | −0.037 | 49.8 | 59.1 | 27.5 | −0.339 |
| 9 | 82.0 | 67.6 | 21.6 | 0.668 | 34.5 | 26.1 | 20.6 | 0.407 | 61.5 | 62.9 | 22.8 | −0.063 | 66.5 | 52.2 | 28.9 | 0.496 |
| 10 | 69.2 | 66.5 | 19.9 | 0.133 | 52.5 | 28.3 | 20.0 | 1.213 | 51.7 | 69.2 | 18.9 | −0.926 | 61.4 | 56.4 | 26.5 | 0.188 |
| 11 | 61.6 | 59.6 | 24.5 | 0.082 | 27.1 | 29.6 | 20.0 | −0.122 | 60.3 | 64.9 | 20.9 | −0.218 | 48.7 | 54.2 | 26.7 | −0.207 |
| 12 | 66.3 | 68.8 | 21.6 | −0.115 | 26.1 | 29.4 | 21.2 | −0.157 | 64.3 | 64.8 | 20.7 | −0.025 | 58.1 | 53.5 | 27.1 | 0.172 |
| 13 | 71.0 | 71.1 | 21.6 | −0.003 | 30.0 | 28.3 | 20.8 | 0.083 | 67.0 | 66.3 | 21.3 | 0.030 | 61.7 | 55.0 | 27.9 | 0.239 |
| 14 | 76.7 | 72.9 | 22.4 | 0.170 | 38.0 | 28.2 | 23.8 | 0.412 | 74.9 | 71.7 | 21.5 | 0.146 | 67.6 | 57.4 | 29.7 | 0.342 |
| 15 | 87.8 | 74.7 | 17.3 | 0.758 | 44.1 | 32.8 | 26.3 | 0.427 | 79.2 | 68.9 | 20.6 | 0.498 | 75.2 | 55.3 | 29.0 | 0.688 |
| 16 | 56.0 | 59.0 | 25.4 | −0.118 | 17.7 | 23.4 | 20.9 | −0.270 | 51.3 | 60.1 | 24.0 | −0.367 | 47.4 | 48.8 | 28.7 | −0.049 |
| 17 | 61.1 | 54.7 | 24.2 | 0.266 | 20.3 | 20.1 | 17.3 | 0.012 | 52.4 | 55.1 | 22.8 | −0.120 | 48.6 | 44.2 | 27.1 | 0.162 |
| 18 | 67.6 | 62.7 | 24.2 | 0.200 | 26.1 | 19.1 | 17.5 | 0.400 | 66.5 | 55.9 | 24.1 | 0.438 | 55.1 | 47.0 | 28.9 | 0.283 |
Acknowledgements
This material is based upon work supported by the National Science Foundation under the Graduate Research Fellowship Program (NSF-GRFP) and the NSF DRK-12 Grant No. 0733642. Any opinions, findings, and conclusions or recommendations expressed in this material are those of the authors and do not necessarily reflect the views of the National Science Foundation.References
- Adams W. K. and Wieman C. E., (2011), Development and validation of instruments to measure learning of expert-like thinking, Int. J. Sci. Educ., 33(9), 1289–1312.
- Allsop R. T. and George N. H., (1982), Redox in Nuffield advanced chemistry, Educ. Chem., 19, 57–59.
- American Chemical Society, (2008), ACS Guidelines & Supplements, from http://www.acs.org/content/acs/en/about/governance/committees/training/acs-guidelines-supplements.html.
- Bell P. and Volckmann D., (2011), Knowledge surveys in general chemistry: confidence, overconfidence, and performance, J. Chem. Educ., 88(11), 1469–1476.
- Bodner G. M., (1986), Constructivism: a theory of knowledge, J. Chem. Educ., 63(10), 873–878.
- Brandriet A. R. and Bretz S. L., (2014), The development of the Redox Concept Inventory as a measure of students' symbolic and particulate redox understanding and confidence, J. Chem. Educ., 91(8), 1132–1144.
- Bretz S. L. and Linenberger K. J., (2012), Development of the enzyme-substrate interactions concept inventory, Biochem. Mol. Biol. Educ., 40(4), 229–233.
- Burton R. F., (2001), Quantifying the effects of chance in multiple choice and true/false tests: question selection and guessing of answers, Asess. Eval. High. Educ., 26(1), 41–50.
- Butts B. and Smith R., (1987), What do students perceive as difficult in H.S.C. chemistry? Aust. Sci. Teach. J., 32(4), 45–51.
- Caleon I. and Subramaniam R., (2010a), Development and application of a three-tier diagnostic test to assess secondary students' understanding of waves, Int. J. Sci. Educ., 32(7), 939–961.
- Caleon I. and Subramaniam R., (2010b), Do students know what they know and what they don't know? Using a four-tier diagnostic test to assess the nature of students' alternative conceptions, Res. Sci. Educ., 40(3), 313–337.
- Carter T. J. and Dunning D., (2008), Faulty self-assessment: why evaluating one's own competence is an intrinsically difficult task, Soc. Personal. Psychol. Compass, 2(1), 346–360.
- Chandrasegaran A. L., Treagust D. F. and Mocerino M., (2007), The development of a two-tier multiple-choice diagnostic instrument for evaluating secondary school students' ability to describe and explain chemical reactions using multiple levels of representation, Chem. Educ. Res. Pract., 8(3), 293–307.
- Chi M. T. H. and Roscoe R. D., (2002), The processes and challenges of conceptual change, in Limón M. and Mason L. (ed.), Reconsidering conceptual change: issues in theory and practice, New York, NY: Kluwer Academic Publishers, pp. 3–27.
- Chi M. T. H., Slotta J. D. and De Leeuw N., (1994), From things to processes: a theory of conceptual change for learning science concepts, Learn. Instr., 4(1), 27–43.
- Chiu T., Fang D., Chen J., Wang Y. and Jeris C., (2001), A robust and scalable clustering algorithm for mixed type attributes in large database environment, Proceedings of the 7th ACM SIGKDD International Conference on Knowledge Discovery and Data Mining, San Francisco, CA.
- Clement J., Brown D. E. and Zietsman A., (1989), Not all preconceptions are misconceptions: finding ‘anchoring conceptions' for grounding instruction on students' intuitions, Int. J. Sci. Educ., 11(5), 554–565.
- Cohen J., (1988), Statistical power analysis for the behavioral sciences, 2nd edn, Hillsdale, NJ: Lawrence Erlbaum Associates, Inc.
- Cronbach L. J., (1951), Coefficient alpha and the internal structure of tests, Psychometrika, 16(3), 297–334.
- Cruz-Ramirez de Arellano D. and Towns M., (2014), Students' understanding of alkyl halide reactions in undergraduate organic chemistry, Chem. Educ. Res. Pract., DOI: 10.1039/C3RP00089C.
- Davidowitz B., Chittleborough G. and Murray E., (2010), Student-generated submicro diagrams: a useful tool for teaching and learning chemical equations and stoichiometry, Chem. Educ. Res. Pract., 11(3), 154–164.
- De Jong O., Acampo J. and Verdonk A., (1995), Problems in teaching the topic of redox reactions: actions and conceptions of chemistry teachers, J. Res. Sci. Teach., 32(10), 1097–1110.
- Ding L. and Beichner R., (2009), Approaches to data analysis of multiple-choice questions, Phys. Rev. ST Phys. Educ. Res., 5, 1–17.
- diSessa A. A., (1993), Toward an epistemology of physics, Cognition Instruct., 10(2–3), 105–225.
- Dunning D., (2011), The Dunning-Kruger effect: on being ignorant of one's own ignorance, in Olson J. M. and Zanna M. P. (ed.), Advances in Experimental Social Psychology, San Diego, CA: Elsevier Academic Press, 44, pp. 247–296.
- Everitt B. S., Landau S., Leese M. and Stahl D., (2011), Cluster analysis, 5th edn, Chichester, UK: John Wiley & Sons, Ltd.
- Ferguson G. A., (1949), On the theory of test discrimination, Psychometrika, 14(1), 61–68.
- Ferguson C. J., (2009), An effect size primer: a guide for clinicians and researchers, Prof. Psychol. Res. Pract., 40(5), 532–538.
- Garnett P. J. and Treagust D. F., (1992), Conceptual difficulties experienced by senior high school students of electrochemistry: electric circuits and oxidation-reduction equations, J. Res. Sci. Teach., 29(2), 121–142.
- Hasan S., Bagayoko D. and Kelley E. L., (1999), Misconceptions and the certainty of response index (CRI), Phys. Educ., 34(5), 294–299.
- IBM SPSS Statistics, (2011), TwoStep Cluster Analysis, retrieved from Statistics Base Options website: http://pic.dhe.ibm.com/infocenter/spssstat/v20r0m0/index.jsp?topic=%2Fcom.ibm.spss.statistics.help%2Fidh_twostep_main.htm.
- IBM SPSS Statistics, (2012a), IBM SPSS Statistics 21 Algorithms, retrieved from IBM SPSS Statistics 21 Documentation website: http://ftp://public.dhe.ibm.com/software/analytics/spss/documentation/statistics/21.0/en/client/Manuals/IBM_SPSS_Statistics_Algorithms.pdf.
- IBM SPSS Statistics, (2012b), IBM SPSS Statistics Base 21, retrieved from IBM SPSS Statistics 21 Documentation website: http://ftp://public.dhe.ibm.com/software/analytics/spss/documentation/statistics/21.0/en/client/Manuals/IBM_SPSS_Statistics_Base.pdf.
- Jaber L. Z. and BouJaoude S., (2012), A macro-micro-symbolic teaching to promote relational understanding of chemical reactions, Int. J. Sci. Educ., 34(7), 973–998.
- Johnstone A. H., (1982), Macro-and micro-chemistry, Sch. Sci. Rev., 64(227), 377–379.
- Johnstone A. H., (1991), Why is science difficult to learn? Things are seldom what they seem, J. Comput. Assist. Learn., 7(2), 75–83.
- Johnstone A. H., (1993), The development of chemistry teaching: a changing response to changing demand, J. Chem. Educ., 70(9), 701–705.
- Johnstone A. H., (2006), Chemical education research in Glasgow in perspective, Chem. Educ. Res. Pract., 7(2), 49–63.
- Johnstone A. H., (2010), You can't get there from here, J. Chem. Educ., 87(1), 22–29.
- Johnstone A. H., Morrison T. I. and Sharp D. W. A., (1971), Topic difficulties in chemistry, Educ. Chem., 8, 212, 213, 218.
- Karatjas A. G., (2013), Comparing college students' self-assessment of knowledge in organic chemistry to their actual performance, J. Chem. Educ., 90(8), 1096–1099.
- Kaufman L. and Rousseeuw P. J., (1990), Finding groups in data: an introduction to cluster analysis, New York, NY: Wiley.
- Kelly R. M., Barrera J. H. and Mohamed S. C., (2010), An analysis of undergraduate general chemistry students' misconceptions of the submicroscopic level of precipitation reactions, J. Chem. Educ., 87(1), 113–118.
- Kern A. L., Wood N. B., Roehrig G. H. and Nyachwaya J., (2010), A qualitative report of the ways high school chemistry students attempt to represent a chemical reaction at the atomic/molecular level, Chem. Educ. Res. Pract., 11(3), 165–172.
- Kline P., (1986), A handbook of test construction: introduction to psychometric design, New York, NY: Methuen.
- Knapp T. R., (1990), Treating ordinal scales as interval scales: an attempt to resolve the controversy, Nurs. Res., 39(2), 121–123.
- Kruger J. and Dunning D., (1999), Unskilled and unaware of it: how difficulties in recognizing one's own incompetence lead to inflated self-assessments, J. Pers. Soc. Psychol., 77(6), 1121–1134.
- Linenberger K. J. and Bretz S. L., (2012), Generating cognitive dissonance in student interviews through multiple representations, Chem. Educ. Res. Pract., 13(3), 172–178.
- Linenberger K. J. and Bretz S. L., (2014), Biochemistry students' ideas about shape and charge in enzyme–substrate interactions, Biochem. Mol. Biol. Educ., 42(3), 203–212.
- Luxford C. J. and Bretz S. L., (2013), Moving beyond definitions: what student-generated models reveal about their understanding of covalent bonding and ionic bonding, Chem. Educ. Res. Pract., 14(2), 214–222.
- Luxford C. J. and Bretz S. L., (2014), Development of the Bonding Representations Inventory to identify student misconceptions about covalent and ionic bonding representations, J. Chem. Educ., 91(3), 312–320.
- McClary L. M. and Bretz S. L., (2012), Development and assessment of a diagnostic tool to identify organic chemistry students' alternative conceptions related to acid strength, Int. J. Sci. Educ., 34(15), 2317–2341.
- Mirkin B. G., (2005), Clustering for data mining: a data recovery approach, Boca Raton, FL: Taylor and Francis Group.
- Mooi E. and Sarstedt M., (2011), Cluster Analysis, in A concise guide to market research: the process, data, and methods using IBM SPSS statistics, New York, NY: Springer, pp. 237–284.
- Mulford D. R. and Robinson W. R., (2002), An inventory for alternate conceptions among first-semester general chemistry students, J. Chem. Educ., 79(6), 739–744.
- Naah B. M. and Sanger M. J., (2012), Student misconceptions in writing balanced equations for dissolving ionic compounds in water, Chem. Educ. Res. Pract., 13(3), 186–194.
- Nakhleh M. B., (1992), Why some students don't learn chemistry: chemical misconceptions, J. Chem. Educ., 69(3), 191–196.
- National Research Council, (2012), Discipline-based education research: understanding and improving learning in undergraduate science and engineering, in Singer S. R., Nielsen N. R. and Schweingruber H. A. (ed.), Committee on the Status, Contributions, and Future Directions of Discipline-Based Education Research. Board on Science Education, Division of Behavioral and Social Sciences and Education, Washington, DC: The National Academies Press.
- Norušis M. J., (2012), Cluster Analysis, in IBM SPSS Statistics 19 statistical procedures companion, Upper Saddle River, NJ: Prentice Hall, pp. 375–404.
- Novak J. D., (2010), Learning, creating, and using knowledge: concept maps as facilitative tools in schools and corporations, New York, NY: Routledge Taylor & Francis Group.
- Nyachwaya J. M., Warfa A. M., Roehrig G. H. and Schneider J. L., (2014), College chemistry students' use of memorized algorithms in chemical reactions, Chem. Educ. Res. Pract., 15(1), 81–93.
- Österlund L. and Ekborg M., (2009), Students' understanding of redox reactions in three situations, Nordic Stud. Sci. Educ., 5(2), 115–127.
- Österlund L., Berg A. and Ekborg M., (2010), Redox models in chemistry textbooks for the upper secondary school: friend or foe? Chem. Educ. Res. Pract., 11(3), 182–192.
- Øyehaug A. B. and Holt A., (2013), Students' understanding of the nature of matter and chemical reactions – a longitudinal study of conceptual restructuring, Chem. Educ. Res. Pract., 14(4), 450–467.
- Pazicni S. and Bauer C. F., (2014), Characterizing illusions of competence in introductory chemistry students, Chem. Educ. Res. Pract., 15(1), 24–34.
- Peterson R. F. and Treagust D. F., (1989), Grade-12 students' misconceptions of covalent bonding and structure, J. Chem. Educ., 66(6), 459–460.
- Roediger H. L. and Marsh E. J., (2005), The positive and negative consequences of multiple-choice testing, J. Exp. Psychol. Learn., 31(5), 1155–1159.
- Rosenthal D. P. and Sanger M. J., (2012), Student misinterpretations and misconceptions based on their explanations of two computer animations of varying complexity depicting the same oxidation-reduction reaction, Chem. Educ. Res. Pract., 13, 471–483.
- Rust J. and Golombok S., (2009), Modern psychometrics: the science of psychological assessment, Hove, East Sussex: Routledge.
- Sanger M. J. and Greenbowe T. J., (2000), Addressing student misconceptions concerning electron flow in aqueous solutions with instruction including computer animations and conceptual change strategies, Int. J. Sci. Educ., 22(5), 521–537.
- Schmidt H. J. and Volke D., (2003), Shift of meaning and students' alternative concepts, Int. J. Sci. Educ., 25(11), 1409–1424.
- Schwarz G., (1978), Estimating the dimension of a model, Ann. Stat., 6(2), 461–464.
- Smith K. C. and Nakhleh M. B., (2011), University students' conceptions of bonding in melting and dissolving phenomena, Chem. Educ. Res. Pract., 12(4), 398–408.
- SPSS Inc., (2001), The SPSS TwoStep cluster component: A scalable component to segment your customers more effectively, White Paper – Technical Report, Chicago, IL, pp. 1–9.
- Sreenivasulu B. and Subramaniam R., (2014), Exploring undergraduates' understanding of transition metals chemistry with the use of cognitive and confidence measures, Res. Sci. Educ., DOI: http://10.1007/s11165-014-9400-7.
- Stains M. and Talanquer V., (2008), Classification of chemical reactions: stages of expertise, J. Res. Sci. Teach., 45(7), 771–793.
- Stevens S. S., (1946), On the theory of scales of measurement, Science, 103, 677–680.
- Strike K. A. and Posner G. J., (1992), A revisionist theory of conceptual change, in Duschl R. A. and Hamilton R. J., (ed.), Philosophy of Science Cognitive Psychology, and Educational Theory and Practice, Albany, NY: State University of New York Press, pp. 147–176.
- Taber K. S., (2002), Conceptualizing quanta: illuminating the ground state of student understanding of atomic orbitals, Chem. Educ. Res. Pract., 3(2), 145–158.
- Treagust D. F., (1988), Development and use of diagnostic tests to evaluate students' misconceptions in science, Int. J. Sci. Educ., 10(2), 159–169.
- Villafañe S. M., Bailey C. P., Loertscher J., Minderhout V. and Lewis J. E., (2011), Development and analysis of an instrument to assess student understanding of foundational concepts before biochemistry coursework, Biochem. Mol. Biol. Educ., 39(2), 102–109.
- von Glasersfeld E., (1984), An introduction to radical constructivism, in Watzlawick P. (ed.) The Invented Reality: How Do We Know What We Believe We Know? New York: Norton & Company, Inc.
- von Glasersfeld E., (1995), A constructivist approach to teaching, in Steffe L. P. and Gale J. E. (ed.), Constructivism in Education, Hillsdale, NJ: Lawrence Erlbaum Associates.
- Voska K. W. and Heikkinen H. W., (2000), Identification and analysis of student conceptions used to solve chemical equilibrium problems, J. Res. Sci. Teach., 37(2), 160–176.
- Wren D. and Barbera J., (2014), Psychometric analysis of the Thermochemistry Concept Inventory, Chem. Educ. Res. Pract., 15, 380–390.
| This journal is © The Royal Society of Chemistry 2014 |

