DOI:
10.1039/C4RA13355B
(Communication)
RSC Adv., 2015,
5, 4026-4029
Synthesis high specific surface area nanotube g-C3N4 with two-step condensation treatment of melamine to enhance photocatalysis properties†
Received
29th October 2014
, Accepted 5th December 2014
First published on 5th December 2014
Abstract
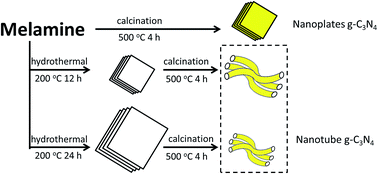
High specific surface area nanotube g-C3N4 was fabricated by a simple two-step condensation method. Photocatalytic activity was evaluated by decomposition of Rhodamine B (Rh B) under visible light. Nanotube g-C3N4 showed 12 times higher photocatalytic activity than bulk g-C3N4. The improvement of photocatalytic activity was mainly due to the higher surface area, the unique morphology and the number of defects.
Introduction
Photocatalysts have been studied for many years since the report by Fujishima and Honda showing that TiO2 can be used to catalytically decompose H2O to produce hydrogen under light irradiation.1 Meanwhile, graphitic carbon nitride (g-C3N4), which is an organic semiconductor with visible-light absorption, high reduction ability and high chemical stability,2 has recently received much attention as a metal free photocatalyst. Although the rates of degradation of harmful organic materials by g-C3N4 were generally smaller than those by TiO2-based photocatalysts under UV light, g-C3N4 has a great advantage in that it works under visible light, absorbing blue light along with UV light.
In past years, g-C3N4 was widely used in composite photocatalysts such as g-C3N4/WO3, g-C3N4/sulfur-doped TiO2 and g-C3N4/TaON.3–5 Although the activities of composite photocatalysts have been enhanced, the results have not been as good as expected. This is because original g-C3N4, which was obtained by high temperature condensation of melamine, dicyandiamide or cyandiamide, has suffered from the problem of having a low specific surface area. The specific surface area of original g-C3N4, which is normally below 10 m2 g−1, has become a bottleneck for further enhancement of photocatalytic activity.
Many methods for improving the specific surface area of g-C3N4 have therefore been proposed. These methods include the twice heating method,6 exfoliation g-C3N4 by ultrasonic treatment method,7 and nanocasting with a hard template method.8
Among the various methods, morphology control is considered to be an effective means for increasing specific surface area and photocatalytic activity. There have been a few reports on fabrication of g-C3N4-like nanofibers, nanobelts, nanorods, nanotubes and nanowires;9,10 however, the XRD pattern of g-C3N4 was changed by morphology control: low-angle reflection peak at 13.1° disappeared.
In this study, we developed a facile method for synthesizing g-C3N4 with a high specific surface area, which has nanotube morphology, by two-step condensation of melamine. In the first step, melamine was hydrothermally treated in water, and as-condensed melamine was heated by a high temperature in the second step. The two-step condensation process controls morphology to increase the specific surface area and the photocatalytic activity of g-C3N4. The enhanced activity of g-C3N4 was evaluated by photodegradation of Rhodamine B (Rh B).
Characterization of melamine and HM-x
Fig. 1(a) shows XRD patterns of original melamine and hydrothermally treated melamine. With the hydrothermal reaction, the appearance of new peaks and disappearance of old peaks are assertive evidence for the creation of a new arrangement. A very well-developed lamellar stacking peak,11 (002), is observed at around 29° after hydrothermal reaction, supporting the observed sheet-like structure. Original melamine and hydrothermally treated melamine were also confirmed by FT-IR spectroscopy. As shown in Fig. 1(b), with the hydrothermal treatment, some new peaks appeared in the 1750–1850 cm−1 region in both HM-12 and HM-24 that were attributed to C
O stretching vibration,12 which means that polymerization was carried out and cyanuric acid was formed. It can be expected that the solution will be changed to an alkaline solution by hydrothermal treatment because of the ammonia generated from melamine condensation. Therefore, hydrothermal treatment with an alkaline solution made the melamine portion change into cyanuric acid.13,14
 |
| Fig. 1 (a) XRD patterns and (b) FT-IR spectroscopy of melamine and hydrothermally treated melamine. SEM images of (c) melamine, (d) HM-12 and (e) HM-24. | |
Fig. 1(c)–(e) show SEM images of original melamine and the melamine processed at 200 °C in water for 12 h and 24 h, respectively. Fig. 1(c) shows that the morphology of original melamine is granular with a particle size of 10–50 μm. When the hydrothermal treatment time was increased to 12 hours, the morphology of products became sheet-like (Fig. 1(d)), being composed of melamine–cyanuric acid. When the treatment time was increased to 24 hours, the morphology of the products was still a sheet-like structure, and the size of particles became large.
Characterization of Hx-C3N4
Fig. 2(a) shows XRD patterns of g-C3N4 obtained after heat treatment. All of the samples gave two peaks consistent with bulk g-C3N4, suggesting that the samples basically have the same crystal structure as that of g-C3N4 (JCPDS 87-1526). The low-angle reflection peak is presumably related to an in-plane structural packing motif at 13.1° (indexed as (100)) of bulk g-C3N4. The low-angle reflection peaks of H12–C3N4 and H24–C3N4 were shifted to 12.9° and 12.8°, respectively. It was confirmed that, compared with bulk g-C3N4, H12–C3N4 and H24–C3N4 have chains that adopt a “zigzag-type” geometry to increase the distance of neighboring tri-s-triazine units.15 The low-angle reflection peak also becomes less pronounced. This is mainly caused by the simultaneously decreased planar size of the layers during two-step condensation. With respect to bulk g-C3N4, the strong inter-planar stacking peak of aromatic systems around 27.6° (indexed as (002)) is shifted to a higher degree (27.8° and 27.7°, respectively), indicating a decreased gallery distance between the basic sheets in g-C3N4.16 The (002) peak also becomes broader and gradually less intense with increase the time of hydrothermal treatment, indicating disturbance of the graphitic structure by two-step condensation.
 |
| Fig. 2 (a) XRD, (b) FT-IR, (c) UV-vis DRS and (d) photoluminescence spectroscopy of the samples obtained by two-step condensation. | |
Functional groups of bulk g-C3N4, H12–C3N4 and H24–C3N4 were confirmed by FT-IR spectroscopy. As shown in Fig. 2(b), the characteristic IR spectrum of Hx-C3N4 was similar to that of bulk g-C3N4. A peak at about 810 cm−1 originating from the heptazine ring system and peaks in the region from 900 to 1800 cm−1 attributed to either trigonal C–N(–C)–C or bridging C–NH–C units were observed in all samples.17,18 These peaks obviously become sharper, probably due to more ordered packing of bands. The peaks in the 1750–1850 cm−1 region disappeared after the second step of condensation, indicating that a more “zigzag-type” geometry arrangement formation may be due to the appearance and disappearance of acid anhydride bonds. Elemental analysis revealed a C/N molar ratio of 0.66 and less than 2 wt% of hydrogen for bulk g-C3N4, and this ratio was almost unchanged with increase the time of hydrothermal treatment (Table 1).
Table 1 BET specific surface area and elemental analysis of obtained samples
|
Specific surface area (m2 g−1) |
C (wt%) |
H (wt%) |
N (wt%) |
C/N (mol/mol) |
Bulk g-C3N4 |
15 |
34.71 |
1.89 |
61.47 |
0.659 |
H12–C3N4 |
43.6 |
34.16 |
1.8 |
60.49 |
0.659 |
H24–C3N4 |
71.7 |
34.33 |
1.77 |
60.71 |
0.660 |
Fig. 2(c) shows UV-vis diffuse reflectance spectra (DRS) of the samples. As shown in Fig. 2(c), compared with the spectrum of bulk g-C3N4, the spectrum of Hx-C3N4 was blue shifted, probably due to the well-known quantum confinement effect. These results are presumably attributed to decrease in particle size. Actually, the SBET of g-C3N4 was enlarged by two step condensation that H12–C3N4 and H24–C3N4 showed almost 3 times and 5 times higher specific surface areas than that of bulk g-C3N4 (Table 1), respectively.
Fig. 2(d) shows photoluminescence spectra of the samples. The excitation wavelength of the photoluminescence spectra is set at 365 nm. With increase in hydrothermal treatment time, a blue shift of the peak wavelength was observed in the fluorescence emission spectra, in accordance with the results of UV-vis DRS. Since photoluminescence properties would be influenced by defects that can reduce the strength of fluorescence peaks, photoluminescence spectra were also used to determine the number of defects.19 In Fig. 2(d), it can be seen that the number of defects decreased with hydrothermal treatment for 12 hours. After that the number of defects increased when the first-step reaction was up to 24 hours. The increased number of defects is attributed to the appearance and disappearance of more cyanuric acid via the two-step condensation process in H24–C3N4.
A scanning electron microscope (SEM) and a transmission electron microscopy (TEM) were used to investigate the textural structure and morphology as shown in Fig. 3(a), (c) and (e) and (b), (d) and (f), respectively. Bulk g-C3N4 showed a sheet-like morphology as expected, but with two-step condensation, H12–C3N4 and H24–C3N4 both showed nanotube morphology. The diameter of nanotube decreased from around 108 nm to 80 nm over time with hydrothermal treatment. What's more the wall thickness of the H12–C3N4 and H24–C3N4 nanotube also decreased from 23 nm to 12 nm. These results were attributed to the appearance and disappearance of cyanuric acid via the two-step condensation process can control the morphology of g-C3N4. Therefore, the improved specific surface area was probably due to the change in sheet-like morphology to nanotube structure and decreased sheet thickness of g-C3N4 (Table 1).
 |
| Fig. 3 SEM images of (a) bulk g-C3N4, (c) H12–C3N4 and (e) H24–C3N4. TEM images of (b) bulk g-C3N4, (d) H12–C3N4 and (f) H24–C3N4. | |
Photocatalytic activity for photodegradation of Rh B
The photocatalytic activities of the prepared samples were evaluated by photodegradation of Rh B. Details of the photocatalytic measurement and the UV-vis spectroscopic changes of Rh B over catalysts are shown in ESI, (Fig. S1†). Fig. 4(a) shows photocatalytic activities of the samples (C is the remained concentration of Rh B, and C0 is the initial concentration of Rh B). As a comparison, without photocatalyst or without light irradiation was carried out, and almost none of Rh B was photodegradation at all. Bulk g-C3N4 shows poor activity, since only 24% of the Rh B was degraded when the irradiation time lasted for 60 min. On the other hand, the photocatalytic activity of H24–C3N4 was much higher than that of bulk g-C3N4. Furthermore H12–C3N4 shows the highest photocatalytic activity, the Rh B was completely degraded when the irradiation time lasted for 40 min. Fig. 4(b) presented the linear relationship between ln(C0/C) and the irradiation time for Rh B degradation. Rate constant k gives an indication of the activity of the photocatalyst. The Rh B photodegradation rate constants for bulk-g-C3N4, H12–C3N4 and H24–C3N4 displayed as 0.005 min−1, 0.06 min−1 and 0.03 min−1, respectively. Although H12–C3N4 has a much lower specific surface area than that of H24–C3N4, it showed the highest photocatalytic activity, being almost 12 times higher than that of bulk g-C3N4. Then the photocatalytic activity decreased with increase in hydrothermal treatment time up to 24 hours. Interestingly, H24–C3N4 has an almost 10 times higher specific surface area than that of bulk g-C3N4 and 2 times than that of H12–C3N4, but its photocatalytic activity was 5 times higher than that of bulk g-C3N4 and lower than that of H12–C3N4. It can be attributed to two aspects: (i) the blue shift in the light absorption region resulted in reduction of visible light into the reaction system and (ii) as mentioned above, since the defects can act as recombination centers for photogenerated electron–holes,20 the increase in the number of defects lowered the photocatalytic performance.
 |
| Fig. 4 (a) Photocatalytic activities for Rh B photodegradation over bulk g-C3N4 and Hx-C3N4 samples prepared by two-step condensation. (b) Relationship between Rh B degradation efficiency and the light irradiation time for the bulk g-C3N4 and Hx-C3N4 photocatalysis system. | |
To evaluate the stability of nanotube g-C3N4, the sample of H12–C3N4 was chosen to perform cyclic test. The results are shown in Fig. S2.† There was no decrease observed in repeating the reaction three times under the same condition, indicating the good stability of the catalyst during the photocatalytic reaction. In addition, the same results can be seen by XRD analyses (Fig. S3†).
Conclusions
In this study, nanotube g-C3N4 was fabricated from melamine by a simple two-step condensation process. The specific surface area was enlarged by morphology control, and the photocatalytic activity for decomposition of Rh B under visible light irradiation was enhanced. H12–C3N4 shows the highest photocatalytic activity which was almost 12 times higher than bulk g-C3N4. Since H24–C3N4 contained more defects than H12–C3N4, result in lower photocatalytic activity than H12–C3N4, but still 5 times higher than bulk g-C3N4. The results reported may provide a good reference for developing more superior photocatalyst g-C3N4 and also provides a new sight to enhance photocatalytic activity of g-C3N4 without using template for morphology control and increase specific surface area.
Acknowledgements
This work was supported by the JST PRESTO program and the JST ACT-C program.
Notes and references
- A. Fujishima and K. Honda, Nature, 1972, 238, 37–38 CrossRef CAS.
- X. C. Wang, K. Maeda, A. Thomas, K. Takanabe, G. Xin, J. M. Carlsson, K. Domen and M. Antonietti, Nat. Mater., 2009, 8, 76–80 CrossRef CAS PubMed.
- Z. Jin, N. Murakami, T. Tsubota and T. Ohno, Appl. Catal., B, 2014, 150-151, 479–485 CrossRef CAS PubMed.
- S. C. Yan, S. B. Lv, Z. S. Li and Z. G. Zou, Dalton Trans., 2010, 1488–1491 RSC.
- K. Kondo, N. Murakami, C. Ye, T. Tsubota and T. Ohno, Appl. Catal., B, 2013, 142, 362–367 CrossRef PubMed.
- P. Niu, L. L. Zhang, G. Liu and H. M. Cheng, Adv. Funct. Mater., 2012, 22, 4763–4770 CrossRef CAS.
- S. Yang, Y. Gong, J. Zhang, L. Zhan, L. Ma, Z. Fang, R. Vajtai, X. Wang and P. M. Ajayan, Adv. Mater., 2013, 25, 2452–2456 CrossRef CAS PubMed.
- A. Thomas, A. Fischer, F. Goettmann, M. Antonietti, J.-O. Muller, R. Schlogl and J. M. Carlsson, J. Mater. Chem., 2008, 18, 4893–4908 RSC.
- M. Tahir, C. Cao, N. Mahmood, F. K. Butt, A. Mahmood, F. Idrees, S. Hussain, M. Tanveer, Z. Ali and I. Aslam, ACS Appl. Mater. Interfaces, 2013, 6, 1258–1265 Search PubMed.
- W. B.-N. Zhao Peng, C. Xiang-Ying and Q. Yi-Tai, Chem. Res. Chin. Univ., 2009, 25, 412–416 Search PubMed.
- M. Shalom, S. Inal, C. Fettkenhauer, D. Neher and M. Antonietti, J. Am. Chem. Soc., 2013, 135, 7118–7121 CrossRef CAS PubMed.
- Y.-S. Jun, E. Z. Lee, X. Wang, W. H. Hong, G. D. Stucky and A. Thomas, Adv. Funct. Mater., 2013, 23, 3661–3667 CrossRef CAS.
- E. Kroke, M. Schwarz, E. Horath-Bordon, P. Kroll, B. Noll and A. D. Norman, New J. Chem., 2002, 26, 508–512 RSC.
- E. Horvath-Bordon, E. Kroke, I. Svoboda, H. Fueß, R. Riedel, S. Neeraj and A. K. Cheetham, Dalton Trans., 2004, 3900–3908 RSC.
- T. Sano, S. Tsutsui, K. Koike, T. Hirakawa, Y. Teramoto, N. Negishi and K. Takeuchi, J. Mater. Chem. A, 2013, 1, 6489–6496 CAS.
- G. Dong, Y. Zhang, Q. Pan and J. Qiu, J. Photochem. Photobiol., C, 2014, 20, 33–50 CrossRef CAS PubMed.
- S. C. Yan, Z. S. Li and Z. G. Zou, Langmuir, 2009, 25, 10397–10401 CrossRef CAS PubMed.
- Y. Meng, G. Xin and D. Chen, Optoelectron. Adv. Mater., Rapid Commun., 2011, 5, 648–650 CAS.
- Y. Zang, L. Li, Y. Zuo, H. Lin, G. Li and X. Guan, RSC Adv., 2013, 3, 13646–13650 RSC.
- V. K. Mahajan, M. Misra, K. S. Raja and S. K. Mohapatra, J. Phys. D: Appl. Phys., 2008, 41, 125307 CrossRef.
Footnote |
† Electronic supplementary information (ESI) available. See DOI: 10.1039/c4ra13355b |
|
This journal is © The Royal Society of Chemistry 2015 |
Click here to see how this site uses Cookies. View our privacy policy here.