 Open Access Article
Creative Commons Attribution 3.0 Unported Licence
Remarkable acid strength of ammonium ions in zeolites: FTIR study of low-temperature CO adsorption on NH4FER†
Danio Perraa,
Nikola Drenchevb,
Kristina Chakarovab,
Maria Giorgia Cutrufelloa and
Konstantin Hadjiivanov*b
aUniversità di Cagliari, Dipartimento di Scienze Chimiche e Geologiche, Complesso Universitario Monserrato, s.s. 554 Bivio Sestu, 09042 Monserrato (CA), Italy
bInstitute of General and Inorganic Chemistry, Bulgarian Academy of Sciences, Sofia 1113, Bulgaria. E-mail: kih@svr.igic.bas.bg; Fax: +359 2 8705024; Tel: +359 2 979 3598
First published on 24th October 2014
Abstract
FTIR spectra of CO adsorbed at 100 K reveal remarkable acid strength of the free NH groups of tridentate ammonium ions in NH4FER zeolite.
Obtaining information on surface acidity is a central problem in catalysis and surface chemistry. Two types of acid sites, Lewis and Brønsted, can exist on surfaces. Typical Brønsted acid sites are the bridging hydroxyl groups in zeolites1,2 and it is well established that they are active sites in many catalytic reactions.3,4
Exchange of the protons from the bridging hydroxyls in zeolites with cations leads to neutralization of the Brønsted acidity and creation, at its expense, of Lewis acidity. This acidity strongly depends on the nature of the exchanged cation. For instance, Cs-exchanged samples are rather basic and characterized by very weak Lewis acid sites of electrostatic nature.5 Another way to eliminate the protonic acid sites is to neutralize them with basic molecules. For instance, adsorption of ammonia on H-zeolites leads to its protonation and appearance of NH4+ ions.6–12 The latter can be also introduced in zeolites by cation-exchange from ammonium nitrate solutions. Ammonium forms of zeolites are generally used for storage and their heating leads to conversion of zeolite in the H-form.
Surface characterization of different catalysts is usually performed with their initial (pure) forms. However, during the catalytic reactions the surfaces are usually modified. In particular, it is established that the selective catalytic reduction of NOx with ammonia has a low reaction order towards NH3,13 i.e. the catalyst surface is largely covered by ammonia during the process. This is true for many catalytic reactions involving NH3 as a reactant, e.g. selective ammonia oxidation, ammoxidation processes, etc. That is why characterization of ammonia covered samples is important not only from theoretical point of view but is also of definite practical interest.
One of the most informative ways for spectroscopic measuring of Brønsted acidity is the so-called H-bond method: it is considered that acidity strength correlates with the value of the red shift of the OH modes induced by adsorption of weak bases.14,15 Different probes have been applied for this purpose and CO seems to be the most preferred one.15–28 Another technique for assessing surface acidity is the so-called ion-pair method based on protonation of different strong bases, such as ammonia, trimethylamine, pyridine and substituted pyridines.14
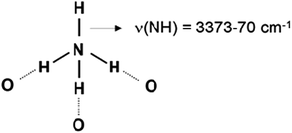
Low-temperature CO adsorption revealed no acidity of NH groups of ammonia coordinated to Lewis acid sites on titania surface.29 However, when ammonia is protonated it is converted to its conjugated acid, NH4+. Normally, the four hydrogen atoms from the ammonium ion formed tend to be H-bonded, for instance to H2O molecules in water solutions. However, the situation with the sorbed NH4+ is different because of steric reasons. For instance, ammonium ion in zeolites can be coordinated to two, three or four oxygen atoms from the zeolite framework.6 In the former two cases one or two isolated NH bonds, respectively, should exist. These moieties could manifest protonic acidity and thus could play important role in some catalytic reactions.
An indication of the acidity of NH4+ in zeolites is the formation of protonated ammonia dimers, usually at high ammonia coverage.6–8 However, to the best of our knowledge, no studies on the acidity of NH4+ ions on surfaces are available.
It is generally considered that the higher the OH acidity, the higher the stability of the corresponding ammonium ion.30 However, this statement is not always correct. Because of its small size, protons in the H-forms of zeolites are connected to one oxygen atom each in order to form OH group. It could be connected to other oxygen(s) only weakly through an H-bond. However, as already stated, ammonium ion is normally coordinated to more than one oxygen atoms from the zeolite framework6 and its stability depends on the number of these oxygens and on their basic properties. The importance of the coordination geometry for the stability of the conjugated acids can be illustrated by the following example: It has been pointed out31,32 that the two scales for basicity, proton affinity (PA) and pKa, do not coincide when comparing pyridine and ammonia: pyridine is characterized by a lower pKa and a higher PA than ammonia. This means that ammonia is more basic than pyridine in water, but less basic in the gas phase. This phenomenon has been explained by the possibility of solvation of the ammonium ion in H2O: it can form four H-bonds with water molecules, which additionally stabilizes the ion. In contrast, pyridinium cation can form only one H-bond.
The aim of the present investigation is to assess the protonic acidity of ammonium form of zeolites. We have studied several materials and have chosen NH4FER as a model system because in this zeolite ammonia is essentially present as tridentate species having one free N–H bond (see below). The acidity was measured by low temperature CO adsorption followed by FTIR spectroscopy.
The NH4FER zeolite (Si/Al = 8.6) used in this study was supplied by the Research Institute of Inorganic Chemistry, Usti nad Labem (Czech Republic). The IR investigations were carried out using a Nicolet Avatar 360 spectrometer at a spectral resolution of 2 cm−1 and accumulating 64 scans. Self-supporting pellet (≈10 mg cm−2) was prepared by pressing the sample at 104 kPa and was directly treated in the IR cell. Prior to the adsorption measurements, the sample was activated by evacuation for 1 h at 373 K in order to remove weakly adsorbed species. Carbon monoxide (>99.5% purity) was supplied by Merck.
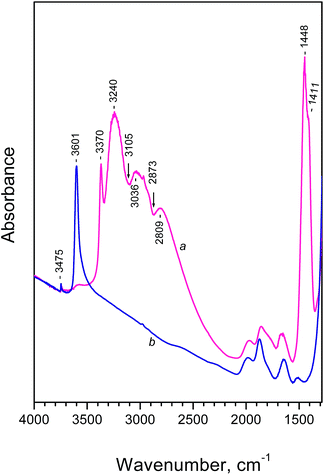
The FTIR spectrum of the NH4FER sample is shown in Fig. 1 (spectrum a). For comparison, the spectrum registered after evacuation of the sample at 673 K (when all ammonia leaves the system) is also presented (Fig. 1, spectrum b). The spectrum of NH4FER shows typical features of ammonium ions. The exact interpretation of these spectra was subjected to a debate during the years.6–12 A detailed study of the vibration modes of ammonium ions in zeolites, based on theoretical calculations and FTIR spectra, was published by Zecchina et al.6 According to these authors, the main features in our spectra can be interpreted as follows:
- The doublet at 1448 and 1411 cm−1 characterizes bending modes of ammonium ions. The appearance of two bands is consistent with C3ν symmetry indicating that tridentate species are predominant in the zeolite (Scheme 1).
- The sharp band at 3370 cm−1 characterizes N–H stretching modes of free NH groups.
- The three bands at 3240, 3036 and 2809 cm−1 are components of one broad band (characterizing H-bonded N–H groups and centered around 3050 cm−1) that is split as a result of Fermi resonance with overtones and combinations of the bending modes. Indeed, two Evans windows are observed at 3105 and 2873 cm−1.
Evacuation of the sample at 673 K leads to destruction of all NH4+ species and appearance, at their expense, of bridging zeolite hydroxyls. The latter produce an intense OH band at 3601 cm−1 (Fig. 1, spectrum b). For more details on the thermal stability of NH4+ in the sample see Fig. S1.†
It is essential to note that at low temperature the bands characterizing NH4+ ions are slightly shifted. In particular, the band due to isolated N–H bond is observed at 3373 cm−1.
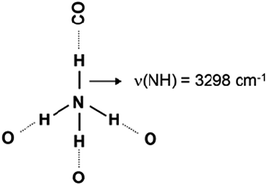
Introduction of CO at 100 K leads to drastic changes in the N–H stretching region of the spectra (Fig. 2, spectrum a). At first, the band at 3373 cm−1 almost disappears and a new band, at 3298 cm−1, emerges instead. Similar phenomena are well known and evidence the formation of H-bond between the H-atom from the free N–H group and CO. As a result, the N–H bond order decreases and ν(NH) is shifted to lower frequencies (see Scheme 2).
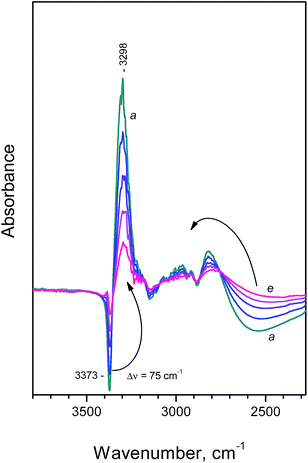 | ||
| Fig. 2 Difference FTIR spectra (NH region) registered after adsorption of CO at 100 K on NH4FER. Equilibrium CO pressure of 200 Pa (a) and development of the spectra during evacuation at 100 K (b–e). | ||
Another effect that is seen in Fig. 2 is that the broad band characterizing H-bonded NH groups is eroded from the low-frequency side (broad negative peak around 2550 cm−1) and a component at higher frequencies develops. This means that the formation of NH⋯CO adducts also leads to a strengthening of the remaining three N–H bonds and a consecutive weakening of the H-bonds with the surface. As a result, the broad N–H band is sharpened and shifted to higher frequencies.
The changes described are gradually suppressed with decrease in the CO coverage and the initial spectrum is finally restored after prolonged evacuation at 100 K.
There are hundreds of studies reporting the CO-induced shift of the OH stretching modes of various hydroxyl groups.15–28 It is generally considered that the observed shift correlates with the acidity of the hydroxyl groups. Makarova et al.23 also reported good correlations between the shift of the OH modes (ΔνOH) and the broadening and increase in intensity of the OH band.
A drawback of using CO as a probe for measuring acidity of strongly acidic hydroxyl groups was recently reported, and is associated with the possibility Fermi resonance to occur.25–27 However, the effect is not observed with less acidic hydroxyls (i.e. when the shifted ν(OH) band is at frequencies higher than ca. 3300 cm−1). Very recently,28 some deviations between the ν(OH) shifts induced by adsorption of weak bases and the enthalpy of adsorption were reported. Nevertheless, ranking acid strength of protonic zeolites by the adsorbate-induced shift of the O–H frequency is still the usual practice, although it should be taken with care.
Comparing the results of this work with data on OH groups is of interest. The normalized CO-induced shift of the NH modes (Δν/ν0) is 2.22 × 10⁻², i.e. similar to the normalized shift of the SiOH groups (2.35 × 10⁻²)24 and is lower than the shift observed with bridging hydroxyls (8.65 × 10⁻²). Also, the increase of the ν(NH) band intensity after interaction with CO (ca. 4 times) is similar to that observed with SiOH groups and lower than the increase found with bridging hydroxyls (6.7 times). Therefore, these observations could suggest that the acid strength of the NH groups in our sample is similar to that of silanol groups.
However, direct comparison between the CO-induced shifts of OH and NH stretching modes is not correct because the two bonds are different in nature. In order to verify whether the acidity of the NH groups is comparable with the acidity of silanols, we have studied the stability of the complexes. Analysis of the IR spectra (see Fig. S2†) indicates that a much smaller fraction of silanol groups are affected under the same CO equilibrium pressures as compared to NH groups. This implies a lower acidity of silanols. In addition, silanols are not able to protonate ammonia while NH4+ can do it forming positively charged dimers.6–8
Another criterion that is independent of the nature of the atom to which the proton is bound is the stretching frequency of the adsorbed CO. When CO is bound to surface site as a result of electrostatic interaction the CO stretching frequency increases and this increase, ΔνCO, correlates with the strength of the electrostatic field.16 Consequently, a correlation between ΔνCO and ΔνOH was reported for CO interaction with hydroxyl groups.33,34 In fact, ΔνCO is not widely used for estimating protonic acidity because is much less sensitive than the shift of the OH modes. However, in our case the value of ν(CO) could give additional valuable information.
The spectra of CO adsorbed on NH4FER are presented in Fig. 3. Surprisingly, three bands, at 2166, 2157 and 2143 cm−1 , with comparable stabilities are registered (the exact band positions were obtained from the second derivatives of the spectra). Analysis of intensities indicates that the most stable band is at 2157 cm−1 followed by the bands at 2166 and 2143 cm−1. This is demonstrated by the comparison between spectra b and f (normalized spectrum e): it is evident that the band most resistant to evacuation is that at 2157 cm−1. In the absence of any back π-donation similar behaviour could only be explained by dual interaction (bonding of CO via both its ends). Similar interaction have been reported for a number of cases when CO is adsorbed in cation-exchanged zeolites and interacts with two cations via the two (C and O) atoms.35,36 Let us compare the bands at 2166 and 2157 cm−1. Assuming that the former band corresponds to linear CO complexes, the band at 2157 cm−1 could be attributed to CO interacting weakly also by its O-end. Indeed, this interaction is well known to shift the CO stretching mode towards lower wavenumbers.16 Another phenomenon supporting the proposed interpretation is the fact that the 2157 cm−1 band is ca. 2 times wider than the band at 2166 cm−1, which indicates a complex interaction (FWHM2155 = 5.4 cm−1 and FWHM2157 = 10.5 cm−1).
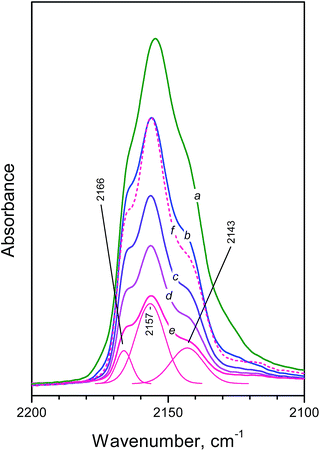 | ||
| Fig. 3 Difference FTIR spectra (carbonyl region) registered after adsorption of CO at 100 K on NH4FER. Equilibrium CO pressure of 200 Pa (a) and development of the spectra during evacuation at 100 K (b–e). Spectrum “f” is spectrum “e” normalized according to the intensity of the 2157 cm−1 band in spectrum “b”. The spectra “a–e” correspond to the spectra presented in Fig. 2. | ||
It seems that similar situation is realized by the band at 2143 cm−1 (FWHM = 11.2 cm−1) and the observed slightly lower stability (as compared to the band at 2157 cm−1) is possibly due to superimposition of this band with a band arising from physically adsorbed CO. Indeed, the latter is well discernible in spectrum “a”.
In any case, the appearance of a band at 2166 cm−1 in absence of any OH–CO interaction evidences the existence of relatively strong Brønsted acid sites. For comparison, this is the frequency of CO polarized by Al–OH groups from EFAL species in zeolites.16 Thus, analysis of the spectra in the carbonyl region unambiguously proves the high acidity of the isolated NH groups.
The above observations indicate that direct comparison between the acid strength of OH and NH groups based on the shift of the OH/NH modes after interaction with weak bases is not correct. The same is valid for the changes in the band extinction coefficient.
In conclusion, we report for the first time on the essential acidity of ammonium ions in zeolites. The results presented here concern a NH4FER sample but preliminary experiments have indicated that similar phenomena are also observed with other zeolites. A separate spectroscopic scale should be elaborated for the acidity of NH groups as well as criteria for comparison with the acidity of OH groups.
Notes and references
- A. Zecchina and C. Otero Areán, Chem. Soc. Rev., 1996, 25, 187 RSC.
- H. G. Karge and E. Geidel, Mol. Sieves, 2004, 4, 1 CAS.
- W. O. Haag, R. M. Lago and P. B. Weisz, Nature, 1984, 309, 589 CrossRef CAS.
- E. G. Derouane, J. C. Védrine, R. Ramos Pinto, P. M. Borges, L. Costa, M. A. N. D. A. Lemos, F. Lemos and F. Ramôa Ribeiro, Catal. Rev.: Sci. Eng., 2013, 55, 454 CAS.
- K. Hadjiivanov, P. Massiani and H. Knözinger, Phys. Chem. Chem. Phys., 1999, 1, 3831 RSC.
- A. Zecchina, L. Marchese, S. Bordiga, C. Paze and E. Gianotti, J. Phys. Chem., 1997, 101, 10128 CrossRef CAS.
- J. Datka and K. Góra-Marek, Catal. Today, 2006, 114, 205 CrossRef CAS PubMed.
- F. Lónyi and J. Valyon, Thermochim. Acta, 2001, 373, 53 CrossRef.
- B. De Ménorval, P. Ayrault, N. S. Gnep and M. Guisnet, J. Catal., 2005, 230, 38 CrossRef PubMed.
- C. Bisio, G. Martra, S. Coluccia and P. Massiani, J. Phys. Chem. C, 2008, 112, 10520 CAS.
- B. Onida, L. Borello, B. Bonelli, F. Geobaldo and E. Garrone, J. Catal., 2003, 214, 191 CrossRef CAS.
- Z. Sobalik, A. A. Belhekar, Z. Tvaružková and B. Wichterlová, Appl. Catal., A, 1999, 188, 175 CrossRef CAS.
- N. Y. Tøpsoe, H. Tøpsoe and J. A. Dumesic, J. Catal., 1995, 151, 226 CrossRef.
- E. A. Paukshtis and E. Yurtchenko, Russ. Chem. Rev., 1983, 52, 426 Search PubMed.
- H. Knözinger and S. Huber, J. Chem. Soc., Faraday Trans., 1998, 94, 2047 RSC.
- K. Hadjiivanov and G. Vayssilov, Adv. Catal., 2002, 47, 307 CAS.
- B. Onida, Z. Gabelica, J. P. Lourencüo, M. F. Ribeiro and E. Garrone, J. Phys. Chem. B, 1997, 101, 9244 CrossRef CAS.
- L. M. Kustov, V. B. Kazansky, S. Beran, L. Kubelkova and P. Jiru, J. Phys. Chem., 1987, 91, 5247 CrossRef CAS.
- I. Mirsojew, S. Ernst, J. Weitkamp and H. Knözinger, Catal. Lett., 1994, 24, 235 CrossRef CAS.
- J. Szanyi and M. T. Paffett, Microporous Mater., 1996, 7, 201 CrossRef CAS.
- J. Datka, B. Gil, M. Kawałek and B. Staudte, J. Mol. Struct., 1999, 511–512, 133 CrossRef CAS.
- M. S. Holm, S. Svelle, F. Joensen, P. Beato, C. H. Christensen, S. Bordiga and M. Bjørgen, Appl. Catal., 2009, 356, 23 CrossRef CAS PubMed.
- M. A. Makarova, A. F. Ojo, K. Karim, M. Hunger and J. Dwyer, J. Phys. Chem., 1994, 98, 3619 CrossRef CAS.
- K. Chakarova, N. Drenchev, M. Mihaylov, P. Nikolov and K. Hadjiivanov, J. Phys. Chem. C, 2013, 117, 5242 CAS.
- K. Chakarova and K. Hadjiivanov, Chem. Commun., 2011, 47, 1878 RSC.
- K. Chakarova and K. Hadjiivanov, J. Phys. Chem. C, 2011, 115, 4806 CAS.
- K. Chakarova and K. Hadjiivanov, Microporous Mesoporous Mater., 2013, 177, 59 CrossRef CAS PubMed.
- C. O. Arean, M. R. Delgado, P. Nachtigall, H. V. Thang, M. Rubeš, R. Bulánek and P. Chlubná-Eliášová, Phys. Chem. Chem. Phys., 2014, 16, 10129 RSC.
- K. Hadjiivanov, K. Lamotte and J. C. Lavalley, Langmuir, 1997, 13, 3374 CrossRef CAS.
- M. Niwa and N. Katada, Catal. Surv. Jpn., 1997, 1, 215 CrossRef CAS.
- A. A. Davydov, Molecular Spectroscopy of Oxide Catalyst Surfaces, John Wiley & Sons, Chichester, England, 2003 Search PubMed.
- G. Busca, Phys. Chem. Chem. Phys., 1999, 1, 723 RSC.
- O. Cairon, T. Chevreau and J.-C. Lavalley, J. Chem. Soc., Faraday Trans., 1998, 94, 3039 RSC.
- G. Crépeau, V. Montouillout, A. Vimont, L. Mariey, T. Cseri and F. Mauge, J. Phys. Chem. B, 2006, 110, 15172 CrossRef PubMed.
- P. Nachtigall, M. R. Delgado, D. Nachtigallova and C. O. Areán, Phys. Chem. Chem. Phys., 2012, 14, 1552 RSC.
- R. Bulánek and E. Koudelková, Microporous Mesoporous Mater., 2012, 151, 149 CrossRef PubMed.
Footnote |
| † Electronic supplementary information (ESI) available: Supplementary Fig. S1 and S2. See DOI: 10.1039/c4ra12504e |
| This journal is © The Royal Society of Chemistry 2014 |

