Yanting Feng†
ab,
Lingyan Meng†b,
Jinfeng Zhaoac,
Yongqing Li*ac,
Mengtao Sun*b and
Jianing Chen*b
aDepartment of Physics, Liaoning University, Shenyang, China. E-mail: yqli@lnu.edu.cn
bInstitution of Physics, Chinese Academy of Sciences, Beijing, China. E-mail: mtsun@iphy.ac.cn; jnchen@iphy.an.cn
cState Key Laboratory of Molecular Reaction Dynamics, Institution of Chemical Physics, Chinese Academy of Sciences, Dalian, China
First published on 6th November 2014
The isolated carotenoid and pheophytin a, the complex of carotenoid–pheophytin a and a carotenoid–pheophytin a–TiO2 film have been investigated using the time-dependent density functional theory. Charge transfer mechanisms were revealed by the three-dimensional visualization technology. The photoinduced electron transfer, energy transfer and photoelectric conversion efficiency were systematically investigated in the above systems. Furthermore, the charge transfer mechanism and the energy transfer mechanism were studied when the investigated systems were optically excited in electronic transitions.
Dye-sensitized solar cells (DSSC) have a number of attractive features: they can be easily prepared using conventional roll-printing techniques, they are semi-flexible and semi-transparent, which offers a variety of uses that are not applicable to glass-based systems, and most of the materials used in dye-sensitized solar cells are low-cost.13 For bioorganic systems, no pollution occurred after the cell was destructed, and the low-cost make them better active materials for the organic solar cell. In photosynthesis, the role of pheophytin a is to absorb and transfer solar radiation. Because of the structural characteristics of porphyrins, pheophytin a has a long life in excited states that can ensure effective charge separation. Due to the special π system in the porphyrin molecule, pheophytin a can introduce some functional groups into the molecule system, which can broaden the spectrum response range, and then improve the photoelectric conversion efficiency. The spectral response of carotenoids is particularly important to external solar radiation because carotenoids serve as the electron donor to absorb photons in the carotenoid–pheophytin a molecule system. However, the spectral response of carotenoids is around 400 nm, which can directly affect the photoelectric conversion efficiency. Wu and co-workers found that a red-shift phenomenon of the absorption of the S band can be induced while introducing an electronic group into the middle position of the porphyrin, which lowers the HOMO–LUMO energy levels of the molecule.14
TiO2 is a low-cost, non-toxic semiconductor material with high stability and excellent corrosion resistance. Because of its high roughness, solar radiation can be reflected several times by its surface and repeatedly absorbed by a donor, which largely improves the utilization rate of solar radiation. However, the spectral response range of TiO2 is mainly in the ultraviolet region and the forbidden band is very broad, which significantly limits the absorption of visible light. However, TiO2 can be linked to an acceptor by chemical bonds. Ma and co-workers studied the influence of the connection of TiO2 to an acceptor on the properties of solar cells.15 Their results show that the photoelectric conversion efficiency of solar cells with chemical bond connections is 9 and 60 times than that for weak interaction connections. Under specific conditions, a carotenoid and pheophytin a can link to the surface of TiO2 to form a supermolecule, which not only improves the light absorption, but also broadens the spectral response region. Based on this supermolecule, electrons can directly transfer to the surface or interior of TiO2. It can efficiently increase the charge injection efficiency and even realize an instantaneous charge transfer. The photoinduced electron transfer between a carotenoid and TiO2 nanoparticles has been experimentally reported.16 Furthermore, the self-assembly and photoinduced electron transfer for the system of a carotenoid and pheophytin on a TiO2 semiconductor surface have also been reported.17
In this paper, appropriate bioorganic molecules of carotenoid, pheophytin a and TiO2 were selected to study the photoinduced charge transfer and energy transfer mechanism, while they are optically excited in electronic transitions. The three-dimensional (3D) visualization technology18–20 was adopted to reveal the process of photoinduced charge transfer. Visualization of the charge transfer process directly demonstrates that the electrons transfer from the carotenoid to TiO2 for the carotenoid–pheophytin a–TiO2 film in a wider spectroscopy response, which is the key factor to a high efficiency bioorganic (DSSC) solar cell. Furthermore, our results show that the method of the chemical bond connection is more suitable for the organic solar cell.
The carotenoid is a common nature pigment and the molecule structure is shown in Fig. 1(a). The carotenoids mainly absorb blue-violet light and transfer the energy to pheophytin a in photosynthesis. Because of the long conjugate CC bond, the carotenoid has strong absorption peaks in the visible spectral region. Fig. 1(b) shows the structure of pheophytin a, which consists of a tetrapyrrole ring and four methylene groups. In order to broaden the pheophytin a spectrum response to the visible light region, the carotenoid molecule was linked to the pheophytin a based on coulombic interactions.
![]() | ||
Fig. 1 The optimized chemical structure of (a) carotenoid, (b) pheophytin a, and (c) carotenoid–pheophytin a. |
The excited states of the isolated carotenoid, pheophytin a and the complex system of carotenoid–pheophytin a were also calculated (see Table 1). Fig. 2(a) shows that the strong absorption peak of the carotenoid, which is located at 456.85 nm, in which the oscillator strength reaches the maximum intensity. In general, the oscillator strength can be used to reflect the ability to absorb light, as well as the transition probability, which reveals that the electric transition of molecules occur in the strong absorption region, and thus improve the photoelectric conversion efficiency. Fig. 2(b) shows that the absorption spectra of pheophytin a are mainly located in range from 250 nm to 450 nm. Fifteen excited states were calculated for pheophytin a, and the oscillator strength of the third and fourth excited state reached to the maximum intensities of f = 0.79 and 1.00, respectively (see Table 1). This reveals that the third and fourth excited state have a larger electronic transition probability compared to other excited states. Furthermore, pheophytin a has a strong absorption, at which there is maximum oscillator strength, and thus the electronic transition can occur. Fig. 2(c) shows that there are two absorption peaks for the complex of carotenoid–pheophytin a. The absorption peak located at 385.07 nm arises from the spectral response of pheophytin a, whereas the peak located at 473.58 nm arises from the spectral response of carotenoid. Interestingly, the spectral response region is largely broadened while the carotenoid and pheophytin a formed a complex molecule. The largest oscillator strength in Fig. 2(c) reveals that the S4 excited state has strong electron transition ability and light absorption. On the basis of the above results, pheophytin a and carotenoid were selected as the electron donors in this work.
States | Ea (eV) | fb | CIc | |
---|---|---|---|---|
a The numbers in parentheses are the transition energy in wavelength.b Oscillator strength.c H stands for HOMO and L stands for LUMO, CI coefficients are in absolute values. | ||||
Carotenoid | S1 | 2.7139 | 3.5762 | 0.68439(H → L) |
S2 | 3.8593 | 0.0793 | 0.67021(H-1 → L) | |
S3 | 4.0016 | 0.0541 | 0.67042(H → L + 1) | |
Pheophytin a | S1 | 2.0943 | 0.0231 | 0.39267(H → L) |
S2 | 2.3112 | 0.0027 | 0.37604(H → L) | |
S3 | 3.2415 | 0.7904 | 0.24173(H → L) | |
S4 | 3.3997 | 1.0063 | 0.36101(H → L) | |
S5 | 3.6079 | 0.1600 | 0.61475(H-2 → L + 1) | |
S6 | 3.7711 | 0.0117 | 0.51434(H-6 → L) | |
S7 | 3.8336 | 0.3109 | 0.55229(H-2 → L) | |
S8 | 3.9926 | 0.0170 | 0.59530(H-3 → L) | |
S9 | 4.0317 | 0.4418 | 0.44364(H-3 → L + 1) | |
S10 | 4.1161 | 0.0723 | 0.21271(H-4 → L) | |
S11 | 4.2727 | 0.1671 | 0.60836(H → L + 2) | |
S12 | 4.3025 | 0.0688 | 0.67389(H-1 → L + 2) | |
S13 | 4.3699 | 0.0011 | 0.33489(H-8 → L + 1) | |
S14 | 4.4958 | 0.0009 | 0.38301(H-10 → L) | |
S15 | 4.5826 | 0.1316 | 0.64125(H-7 → L) |
![]() | ||
Fig. 2 The optical electronic state absorption spectra of (a) carotenoid, (b) pheophytin a, and (c) carotenoid–pheophytin a. |
To better understand the excited-state properties of the isolated carotenoid and pheophytin a, a theory analysis was performed using the three-dimensional (3D) real space analysis method and the two-dimensional (2D) sit representation. Fig. 3 shows the 3D charge difference densities of carotenoid. Charge difference densities, defined as the difference between the charge density after bonding and the charge density of the corresponding point, is the charge redistribution after the atoms form a system.18–20 The direction of the charge transfer in the bonding electron coupling process can be seen clearly. As is shown in Fig. 3, electrons and holes are localized at the spine of carotenoid, which reveals that S1, S2 and S3 are localized excited states, and the electrons transfer to the sides of the spine whereas the holes gradually transfer to the central chains.
![]() | ||
Fig. 3 Charge difference densities for different electronic excited states of carotenoid, where green and red stand for the holes and electrons, respectively. |
The charge difference density of pheophytin a is shown in Fig. 4. S3 and S4 are strong absorptions located at 382.49 nm and 364.69 nm, respectively. The electrons and holes localized on the entire porphyrin reveal a strong charge localization in pheophytin a. S13 and S14 are weak absorptions for which electrons and holes are also localized in the entire porphyrin, which further proved the charge localization in pheophytin a. Once the carotenoid is placed parallel close to the pheophytin a, electrons will rapidly transfer between the carotenoid and the pheophytin a.
![]() | ||
Fig. 4 Charge difference densities of pheophytin a, in which green and red stand for the holes and electrons, respectively. |
In the transition process of electrons, the binding state is created by the coulombic force between the electrons in the conduction band and the holes in the valence band. The separation of excitons is to generate electrons and holes by overcoming the coulombic force. The exciton binding energy is one of the key factors directly determining the separation of electrons and holes in the organic solar cell. The exciton binding energy is mainly from the coulombic force between donor cations and acceptor anions.
![]() | (1) |
States | Transition energya (eV) | fb | Δrc (Å) | Excited-state propertyd |
---|---|---|---|---|
a The numbers in parentheses are the transition energy in wavelength.b Oscillator strength.c Δr index is a quantitative indicator of the electron excitation mode, which is a measure of the CT length.d PC61BM and BT in parentheses present that the density are localized on the fullerene and polymer, respectively. | ||||
S1 | 2.0850 (594.65 nm) | 0.0127 | 0.279202 | LE |
S2 | 2.3051 (537.88 nm) | 0.0036 | 0.426212 | LE |
S3 | 2.4014 (516.31 nm) | 0.0012 | 4.449655 | ICT |
S4 | 2.6180 (473.58 nm) | 1.9146 | 2.981704 | ICT |
S5 | 2.7042 (458.49 nm) | 0.3422 | 4.000988 | ICT |
S6 | 3.2198 (385.07 nm) | 1.0314 | 0.316830 | ICT |
S7 | 3.3606 (368.94 nm) | 1.2517 | 0.380151 | ICT |
S8 | 3.4436 (360.04 nm) | 0.0791 | 4.042327 | ICT |
S9 | 3.5201 (352.22 nm) | 0.0236 | 4.071160 | ICT |
S10 | 3.5928 (345.09 nm) | 0.1652 | 0.525675 | LE |
S11 | 3.6468 (339.98 nm) | 0.0012 | 4.923839 | ICT |
S12 | 3.7996 (326.31 nm) | 0.0595 | 4.314745 | ICT |
S13 | 3.8029 (326.03 nm) | 0.1976 | 1.611009 | ICT |
S14 | 3.8732 (320.11 nm) | 0.0988 | 3.367877 | ICT |
S15 | 3.9024 (317.72 nm) | 0.0223 | 0.232065 | LE |
S16 | 3.9406 (314.63 nm) | 0.0851 | 4.283794 | ICT |
S17 | 3.9752 (311.89 nm) | 0.0458 | 0.707571 | ICT |
S18 | 4.0259 (307.97 nm) | 0.3523 | 1.388938 | ICT |
S19 | 4.1096 (301.69 nm) | 0.0719 | 3.029693 | ICT |
S20 | 4.2026 (295.02 nm) | 0.1199 | 3.456301 | ICT |
Fig. 5 shows the charge difference density of the complex of carotenoid–pheophytin a. Two types of excited states exist in the absorption band of the complex of carotenoid–pheophytin a: one is the strong resonance charge transfer (CT) excited state, in which electrons transfer takes place from the main chain of the carotenoid to the pheophytin a. For the S7, Δr is 0.380 Å, which indirectly reveals a large binding energy, and the electrons are located in both the carotenoid and pheophytin a. For the S8, Δr is 4.042 Å, which indirectly reveals a small binding energy in which the electrons and holes are easy to separate, and then the electrons completely transfer to the carotenoid. The other is the weak resonance charge transfer process, which shows that electrons transfer from the pheophytin a to the main chain of the carotenoid. S10 is not a pure intermolecular charge transfer excited state because electrons and holes are localized on pheophytin a. S11 is a pure intermolecular charge transfer excited state because electrons and holes are localized on pheophytin a and carotenoid, respectively.
![]() | ||
Fig. 5 Charge difference densities of carotenoid–pheophytin a, where green and red stand for the holes and electrons, respectively. |
The 3D visualization technology can clearly reveal the transfer direction of the electric charge in the coupling process of bonding and bonding electrons, but cannot provide the information of electronic coherence and the source of electrons and holes. As a result, the 2D site representation is introduced to analyze the electronic coherence. Note that, the larger value along the off-diagonal element in the 2D site representation demonstrates a stronger electronic coherence where it reveals the higher transfer probability of electric transfer. The diagonal elements reveal a small transfer region of electronic transfer, whereas the points far away from the diagonal reveal a wider transfer region of electronic transfer. These points with large values, which are close to the diagonal, demonstrate a strong electronic coherence between an atom with the adjacent atom.
As shown in Fig. 6, the observed S1, S15 are the localized excited states. For S1, both electrons and holes are localized on the pheophytin a molecule and the electron–hole coherence is strong at the left bottom of pheophytin a. For S15, both electrons and holes are localized on the carotenoid molecule. The electron–hole coherence is strong at the top right corner of the carotenoid. S8 is an intermolecular electric charge transfer state, in which electrons and holes cohere between carotenoid and pheophytin a.
TiO2 was linked to the complex of carotenoid–pheophytin a based on chemical bonds and coulombic interactions, which were used to study their excited state properties. Simply, the carotenoid–pheophytin a–TiO2 was renamed C–P–T. Fig. 7(a) shows the connection by coulombic interactions (C–P–T-1), which is a π–π connection. The strong absorption peaks (S3, S17) are located in the UV-vis region, and S1, S2, are located in the visible region. The strongest oscillator strength is f = 2.7349, which is located at 505.58 nm whereas the weakest oscillator strength is f = 0.0001, which is located at 337.63 nm. Fig. 7(b) shows the connection by chemical bonds (C–P–T-2). The strong absorption peaks (S11, S38, S41) are located in the UV-vis region, and S1, S2, S3, S4 are located in the visible region. The strongest oscillator strength is f = 2.7349, which is located at 506 nm, whereas the weakest oscillator strength is f = 0.0001, located at 338 nm. Compared to Fig. 6(a) and (b), the spectral response range for C–P–T-2 is broader than that for C–P–T-1, in which the former is in the range from 300 nm to 750 nm while the latter is in the region between 300 nm and 650 nm.
![]() | ||
Fig. 7 The optimized chemical structure and the optical electronic state absorption spectra of carotenoid–pheophytin a–TiO2. |
The study of the excited states of carotenoid–pheophytin a–TiO2 shows that there are three types of charge transfer: one is the electrons transfer from carotenoid to TiO2; the second is the electrons transfer from carotenoid and pheophytin a to TiO2; the last is the electrons transfer form pheophytin a to TiO2. For S20, electrons and holes are localized in the TiO2 and carotenoid, in which the electron–hole coherence is strong at the crossing of TiO2 and carotenoid, as shown in Fig. 8(a). For S27, electrons and holes are localized in TiO2 and carotenoid–pheophytin a, respectively, in which the electron–hole coherence is strong at the crossing of TiO2 and carotenoid–pheophytin a. For S31, electrons and holes are localized on TiO2 and pheophytin a, respectively, in which the electron–hole coherence is strong at the crossing of TiO2 and pheophytin a. As shown in Fig. 8(b), for S36, electrons and holes are localized in TiO2 and carotenoid, respectively, in which the electron–hole coherence is strong at the center of TiO2. For S43, electrons and holes are localized in TiO2 and carotenoid–pheophytin a, respectively, in which the electron–hole coherence is strong at the center of TiO2. For S52, electrons and holes are localized in TiO2 and pheophytin a, respectively, in which the electron–hole coherence is strong at the left side of TiO2.
![]() | ||
Fig. 8 The 2D contour plots of the selected transition density matrix for C–P–T-1 and C–P–T-2. The color bars are shown at the right of the figure. |
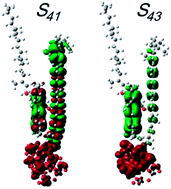
Fig. 9 shows the charge difference densities for P–C–T-1 and P–C–T-2. The electric charge transfer for C–P–T-1 in the strong resonance CT excited states occurs between the main chain of carotenoid and TiO2. S13 is the pure intermolecule electron transition excited state, in which the electrons are localized on the entire TiO2 and the holes are localized on the main chain of the carotenoid and pheophytin a. However, S10 and S12 are not pure intermolecular charge transfer excited states, in which the electrons transfer from pheophytin a to carotenoid, and then to TiO2. Fig. 9 (b) shows that the oscillator strengths of S11 (f = 2.6159) and S41 (f = 1.0594) in C–P–T-2, which are considered as strong absorbing states. In addition, S22 and S43 are pure intermolecule electronic transfer excited states, because the electronic for the C–P–T-2 is localized. For S8 and S41, electrons transfer first from pheophytin a to carotenoid, and then to TiO2. S11, is mainly formed by the electronic transfer from the HOMO to LUMO, which is the strongest absorption excited state, which was revealed by the maximum probability of electron transition. By comparing C–P–T-1 with C–P–T-2, the electronic absorption and injection can be directly affected by the manner in which carotenoid is linked to TiO2. For the chemical bond connection, electrons immediately inject into TiO2, which can effectively decrease the loss of electrons during the electric charge transfer process. The chemical bond connection can also help us to improve the light absorption and the photoelectric conversion efficiency.
![]() | ||
Fig. 9 Charge difference densities of carotenoid–pheophytin a–TiO2, where green and red stand for the holes and electrons, respectively. |
Footnote |
† Contributed equally. |
This journal is © The Royal Society of Chemistry 2014 |