Biogas upgrading through kinetic separation of carbon dioxide and methane over Rb- and Cs-ZK-5 zeolites

T. Remya, E. Gobechiyab, D. Danacic, S. A. Petera, P. Xiaoc, L. Van Tendeloob, S. Coucka, J. Shangc, C. E. A. Kirschhockb, R. K. Singhc, J. A. Martensb, G. V. Barona, P. A. Webleyc and J. F. M. Denayer*a
aDepartment of Chemical Engineering, Vrije Universiteit Brussel, Pleinlaan 2, 1050 Brussels, Belgium. E-mail: joeri.denayer@vub.ac.be
bCentre for Surface Chemistry and Catalysis, KU Leuven, Kasteelpark Arenberg 23, 3001 Leuven, Belgium
cDepartment of Chemical and Biomolecular Engineering, The University of Melbourne, 3010 Victoria, Australia

Received 15th October 2014 , Accepted 3rd November 2014

First published on 3rd November 2014


Abstract

Eight-membered ring (8 MR) zeolites hold large potential for industrial CO2 separations such as biogas separation. They offer large selectivity due to the constrained environment for adsorption, especially when large cations are present in the interconnecting windows. The Rb- and Cs-exchanged ZK-5 zeolites (8 MR KFI type zeolites) were studied for kinetic CO2/CH4 separation. First, Rb-ZK-5 and Cs-ZK-5 were thoroughly characterized via chemical analysis, argon porosimetry, X-ray diffraction and Rietveld refinements. Afterwards, the CO2/CH4 separation potential of both adsorbents was assessed via the measurement of kinetic and equilibrium data (T = 261.15 - 323 K), breakthrough measurements at 303 K (P = 1 - 8 bar), and simulations of their performance. The high occupation of the central 8 MR sites with large cations causes strong diffusional limitations for CH4 on Rb-ZK-5 and Cs-ZK-5. As a result, both zeolites effectively separate CH4 from CO2 with very high selectivities (α = 17 at 1 bar and 303 K). Despite their very large CO2 selectivities, the performance of Rb-ZK-5 and Cs-ZK-5 was still lower than for the benchmark 13X zeolite on a larger scale. Future research needs to further unravel the adsorption mechanism on low-silica 8 MR zeolites and their corresponding potential in separation processes such as biogas purification.

Introduction

During the last decade, it has become clear that the increased emissions of greenhouse gases (GHG) significantly contribute to global warming. CO2 forms the largest fraction of the emitted GHG (about 80% in developed countries).1 However, methane (CH4) that accounts for 10% of the GHG emissions in developed countries and 20% in developing countries represents a growing concern.1,2 Methane has a 56 times larger global warming potential than CO2 over 20 years after emission.3 Abatement of CH4 emissions thus also needs to be a key priority of governments in developed and developing countries that want a better future for their current and future citizens. About 25% of the present worldwide anthropogenic methane emissions could be reused as biogas.4 The main sources of biogas are anaerobic fermentation of organic matter in biogas plants, sewage plants (wastewater treatment) and landfills.5 In addition to the renewable source of the biogas, the low emission factor of methane (57.3 tons of CO2 per terrajoule of energy) compared with other hydrocarbons forms an additional benefit when upgrading the biogas to fuel. Given the stated advantages and the fact that the fraction of the CH4 emissions coming as biogas can be significantly higher than 25% (e.g. 37% in the US and about 90% in Portugal),6 several countries started to promote the upgrade of biogas.

Biogas is a multicomponent mixture, which is typically generated at atmospheric pressure and mainly comprises CH4 and CO2 (and N2 in the case of landfill gas). The molar fraction of CO2 in the biogas is between 0.3 and 0.65. The amount of other contaminants (H2S, O2, H2, sulfur, halogenated hydrocarbons, …) in the water saturated mixture is below 4% and highly dependent on the source.5,7–9

Therefore, in order to use the biogas as a clean renewable fuel, CH4 needs to be separated from CO2 and the other contaminants. Within this work, the focus will be on the separation of CO2 from CH4. Several technologies exist to efficiently remove CO2 from biogas: chemical absorption with amines or polyglycolether (Selexol), physical absorption with water, membrane-based separation processes or pressure swing adsorption (PSA) using porous solids.9 Different classes of porous solids display preferential adsorption of CO2 with respect to CH4 under the conditions of biogas production. A lot of recent work has mainly focused on metal–organic frameworks (MOFs) that possess large CO2 capacity, especially at high pressures due to their high surface area and tuneability of their pore structure. In addition, MOFs with coordinatively unsaturated metal sites (such as the MOF-74 family) interact strongly with CO2 at low pressures and therefore also have a high CO2 selectivity.10,11 However, large concerns still exist about their stability under real industrial conditions in the presence of water, oxygen, H2S, …12–14 On the contrary, zeolites are much more stable under such conditions. The combination of high stability, high CO2 selectivity at low pressures, low heat capacity, rather low production cost and homogeneity renders zeolites interesting materials for efficient adsorptive separation of CO2 from other gas molecules such as CH4 or N2.

Recently, several studies have been investigating the CO2 adsorption properties of cage-type zeolites with eight-membered ring (8 MR) oxygen windows.15–19 The relatively small cages and windows of these zeolites increase the interaction strength between the adsorbent and CO2 (kinetic diameter σ = 3.3 Å). At the same time, the diffusion of the slightly larger adsorbates CH4 (σ = 3.8 Å) and N2 (σ = 3.64 Å) through the 8 MR windows can be hindered. As a result, simulations predicted the highest CO2/CH4 selectivities in 8 MR structures among the different types of zeolites.20 Experimental studies have mainly focused on the RHO, LTA, CHA and KFI structures up to now.17,19,21–27 It has been shown that a low Si/Al ratio and/or a high occupation of central window sites between neighboring cages by extra-framework cations result in the highest CO2 selectivity for a given structure. Especially large univalent cations such as K+, Rb+ and Cs+ preferentially coordinate at the center of 8 MRs.28,29 Our recent study on KFI demonstrated that the low-silica K-KFI (Si/Al = 1.67) structure has an extremely high CO2/CH4 selectivity (α = 60) during dynamic breakthrough separation of equimolar CO2–CH4 mixtures at 1 bar and 308 K as a result of the strong kinetic limitations for CH4.16 CH4 remains almost unadsorbed under these conditions due to large intracrystalline diffusional limitations resulting from the presence of large potassium ions in the central 8 MR window sites.

However, selectivity is not the only metric when evaluating an adsorbent for an industrial pressure swing adsorption (PSA) process. Typically, the working capacity is the second evaluation criterion that is being used when comparing adsorbents for a given separation. The working capacity for a given adsorbate is the difference in the adsorbed amounts between the adsorption and desorption conditions. Although 8 MR zeolites with low Si/Al ratios have the strongest electrostatic interaction with CO2, they do not necessarily possess the highest working capacity. At low Si/Al ratios, the amount of extra-framework cations increases and the accessible pore volume for CO2 decreases. Therefore, the desired Si/Al ratio is the one yielding a strong interaction with CO2 while maintaining a high available pore space for CO2. At the same time, a sufficient amount of cations must be present in the structure to ensure a restrained CH4 diffusion in order to have a high selectivity. We have shown that ZK-5 zeolites (another KFI structure) with a slightly higher Si/Al ratio (Si/Al = 3.6) possess larger working capacities than our new low-silica KFI structure (Si/Al = 1.67). At the same time, these ZK-5 zeolites still have rather high CO2 selectivities.

KFI zeolites consist of a three-dimensional network of larger α-cages (11.6 Å in diameter) and smaller γ-cages (6.6 Å × 10.8 Å). The α- and γ-cages are connected through flat eight-membered rings with a diameter of 3.9 Å.30,31 A puckered eight-membered ring with a smallest diameter of 3.0 Å connects the γ-cages with each other. The KFI structure and the different possible cation sites are shown in Fig. 1.


image file: c4ra12460j-f1.tif
Fig. 1 KFI zeolite. (a) Framework view along [001] axis of the crystal, showing the two types of cages, which are linked via double six ring units. There is an α-cage (lta) at the front and back of the γ-cage (pau) in the middle of the picture; (b) cage structure of KFI showing the α-cage and γ-cage; (c) known cation sites in KFI.28 Site M1 (blue spheres) is located in the α-cage facing a six ring of the hexagonal prism, site M2 (black sphere) in the center of the hexagonal prism, site M3 (green spheres) in the center of the puckered eight ring of the γ-cage and site M4 (pink spheres) in the center of the flat eight ring of the α-cage. Site M2 is only indicated by one small black sphere for completeness, as it remains practically unoccupied when M1 sites are filled with cations.17,28

The potassium cations of K-ZK-5 preferentially reside in the puckered 8 MR sites of the γ-cages (site M3) and fill almost all these sites at 323 K (fractional occupation = 0.93).28 Since only few of the flat 8 MR sites interconnecting the α- and γ-cages are occupied at 323 K, K-ZK-5 still has a rather high working capacity but a much lower selectivity than the low-silica K-KFI.16 Therefore, a ZK-5 structure in which a much larger part of the interconnecting flat 8 MR sites are filled with cations seems a very interesting candidate for CO2/CH4 separation. According to Parise et al., the KRb-ZK-5 and KCs-ZK-5 zeolites have these features.29 Most of the puckered 8 MR sites (site M3) are still filled by potassium cations in KRb-ZK-5 and KCs-ZK-5 (fractional occupation ≈ 0.7). Contrarily to K-ZK-5, most of the flat 8 MR sites are now occupied by Rb+ or Cs+ cations (fractional occupation = 0.7–0.85).29 The apparent cut-offs at 50–60% exchange upon ion-exchange of ZK-5 with a Rb or Cs salt solution have been related to the restricted access for Rb+/Cs+ cations to the puckered 8 MRs once the preferred flat 8 MRs are filled with Rb+/Cs+ cations.29,32 Therefore, first instance, it does not seem possible to prepare a ZK-5 structure that is fully exchanged with Rb or Cs.29,32–34

The main goal and novelty of this study is to investigate whether ZK-5 structures in which most of the interconnecting central window sites are filled with large cations hold (large) potential for industrial CO2/CH4 separations such as biogas separations or not. As such, we want to contribute to the further exploration of the unexploited potential for 8 MR zeolites with large cations in central window sites within the context of gas separations. Biogas is considered here as a binary mixture of CO2 and CH4 with a mole fraction of CO2 equal to 0.4.35 Therefore, the CO2 separation potential of the Rb- and Cs-exchanged ZK-5 zeolites was studied under static and dynamic breakthrough conditions. In addition, their performance was simulated at the lab- and industrial scale through PSA modeling and compared with the benchmark 13X (NaX) zeolite. Finally, the performance of KFI zeolites in biogas separations is discussed in relation to their nanostructure (Si/Al ratio, cation type, separation mechanisms) and directions for further research are pointed out.

Experimental

Preparation of the zeolite samples

K-ZK-5 was prepared according to the method of Verduijn et al. (details are given in section S1).36 Rb-exchanged and Cs-exchanged ZK-5 samples were obtained upon repeated ion exchanges with the corresponding chloride salts. A typical operation involved adding 150 mL of a 0.1 M solution of the chloride salt to about 1.0 g of K-ZK-5. The solution was stirred for at least 8 hours. This was repeated at least 7 times. After the final exchange, the solution was vacuum-filtered and washed several times with de-ionized water. The resulting samples were dried in an oven at 353 K over night.

Characterization of the zeolite samples

The structure of the ion-exchanged samples was confirmed via X-Ray Diffraction (XRD). Samples for X-ray powder diffraction (XRPD) were prepared by activating 400 mg of Cs- and Rb-exchanged ZK-5 samples in a 20 mL glass vial at 623 K. After sealing the vials, the activated samples were transferred into a glove box under inert nitrogen atmosphere to load the 0.7 mm capillaries. XRPD patterns for Cs- and Rb- exchanged samples were recorded at room temperature on a STOE STADI MP diffractometer with focusing Ge(111) monochromator (Cu Kα1 radiation, λ = 1.54056 Å) in Debye–Scherrer geometry with a linear position sensitive detector (PSD) (6° 2θ window) from 3 to 90.50° 2θ, with a step width of 0.5°, internal PSD resolution of 0.01°, and a counting time of 400 s and 300 s per step respectively.

The chemical composition was determined via inductively coupled plasmaspectroscopy-mass spectroscopy (ICP-MS) by Nagrom (Perth, Australia).

The position of the cations in the zeolitic framework and the fractional occupation of the different sites were determined by Rietveld refinements. The XRD powder patterns of both materials were indexed in spacegroup Im[3 with combining macron]m. A few weak peaks, additional to the main phase peaks, were observed in the diffractograms of the Rb- and Cs-exchanged samples and assigned to chabazite.17,37 The crystal structure of Cs-chabazite was added as the second phase (starting model from Calligaris et al.)38 and was not refined due to its very small amount, i.e. less than 4% in each sample, and as a result of the very weak Bragg intensities. The XRD pattern of the Rb-exchanged ZK-5 sample also contains extremely small amounts of a third unknown phase represented by 2 very weak reflections at 2θ = 10.90° (d = 8.11 Å), 2θ = 12.42° (d = 7.12 Å).

Rietveld refinements of the crystal structures of the dehydrated Cs- and Rb-exchanged ZK-5 samples were performed with the GSAS/EXPGUI software package.39,40 The starting model for the dehydrated framework of both samples was taken from the structure of KCs-ZK-5 reported by Parise et al.29 with spacegroup Im[3 with combining macron]m and three sites for extra-framework cations (see also Fig. 1c):28 M1 (multiplicity and Wyckoff letter: 16f) – in the lta-cage (α-cage) facing a six-ring (6R) of the hexagonal prism (D6R), M3 (multiplicity and Wyckoff letter: 12d) – in the center of the puckered eight-membered ring (8R), and M4 (multiplicity and Wyckoff letter: 12e) – in the center of the flat eight-membered ring (8R). Cation distribution in the structures of both materials was based on the chemical analysis of the samples (vide supra) and on the starting model at the first steps of the refinement.

Scale factors, unit cell parameters, 0-shift of the detector, profile parameters, background coefficients, framework atom positions T and O and temperature factors were refined first. At that stage of the refinement it was clear that there were problems with the fit of the Bragg intensities as well as with the profile parameters due to the high absorption by the heavy Cs+ and Rb+ cations and their possibly wrong distribution in the Cs- and Rb-exchanged ZK-5 structures. Therefore, the absorption coefficient was refined with all the other parameters fixed. The XRD powder patterns were cut in two regions: low angle (3–19° 2θ) and high angle (19–90.5° 2θ) in order to improve the refinement of the profile parameters. Afterwards, the refinement of all instrumental, profile and structural parameters was redone. R-factors and goodness of fit were improved but fit of Bragg intensities pointed on problems with extra-framework cation distribution in the pores of both structures. Good agreement between experimental and simulated powder diffraction data was finally achieved after careful refinement of the coordinates, temperature factors, occupancy for extra-framework cations and analysis of the observed Fourier transformed electron density maps. The final results with the standard deviations were merged into one cif file for each structure, Cs-ZK-5.cif and Rb-ZK-5.cif respectively.

Pore volumes were determined via Ar (Air Liquide, 99.999%) porosimetry at 87 K using the Autosorb AS-1 (Quantachrome Instruments, USA) apparatus. Samples were degassed by slowly heating to 623 K and keeping this final temperature overnight.

Crystal sizes were determined by scanning electron microscopy on gold-plated samples using a Philips XL30 FEG instrument.

Gas adsorption analysis

CO2 (Air Liquide, 99.995%) and CH4 isotherms (Air Liquide, 99.995%) were determined at different temperatures with the Micromeritics ASAP 2050 system (Micromeritics, USA). The equilibration time was varied between 45 and 120 s. The criterion of the equilibration time at a given pressure point works as follows. After 10 times the equilibration time, the apparatus checks whether the derivative of pressure with respect to time is less than 0.001%. If this is case, it is considered that equilibrium is reached and the ASAP 2050 system moves on to the next pressure point. Otherwise, it will wait for another 10 times the equilibration time and check the equilibrium criterion again. The temperature was controlled via a Julabo thermostat (Julabo, Germany). Samples were activated by slowly heating to 623 K under vacuum. Isosteric enthalpies (−ΔH) were calculated as a function of loading on the different samples using adsorption data at 283 K, 303 K and 323 K via the Clapeyron–Clausius equation:41
 
image file: c4ra12460j-t1.tif(1)
here, Rg is the gas constant (8.314 J mol−1 K−1), T is the temperature (K), P is the pressure and q is the loading (mmol g−1).

Separation of gas mixtures

Breakthrough experiments were performed to study the separation of CO2 from CH4. The experimental setup has been described in previous work.42 A stainless steel column with a length of 10 cm and an internal diameter of 0.457 cm was filled with about 1 g of zeolite pellets. Zeolite powder was compressed into a solid disc by applying a pressure of about 500 bar. The resulting disc was then crushed and sieved into the desired pellet fraction of 500 to 650 μm. The experiments were carried out at 303 K and the total flow rate was 20 NmL min−1. The exit flow rate and gas composition was measured on-line by means of a mass flow meter and a mass spectrometer (MS).42 Before each measurement, the material was regenerated by heating it in a helium flow (20 NmL min−1) to 623 K and maintaining this temperature for at least half an hour. The calculation procedure for the adsorbed amounts and selectivities has been explained in previous work.42

Modeling

Parameter estimation

CO2 and CH4 isotherms on the different adsorbents were fitted to the dual-site Langmuir model with Athena Visual Studio v 14.0 using a non-linear least squares optimization procedure
 
image file: c4ra12460j-t2.tif(2)
where q*i is the equilibrium adsorbed amount (mol kg−1), q1sat and q2sat are the saturation loadings for sites 1 and 2 (mol kg−1), and b1 and b2 are the Langmuir parameters (Henry constants) for sites 1 and 2 (kPa−1). The dependency of the Langmuir parameters is given by eqn (3) and (4):
 
image file: c4ra12460j-t3.tif(3)
 
image file: c4ra12460j-t4.tif(4)
where b10 and b20 are the pre-exponential factors of the Henry constants (kPa−1) and Q1 and Q2 are the Langmuir adsorption heats (J mol−1).

The optimization procedure assumes uncorrelated, additive, zero mean residuals with a standard normal distribution.43 Starting values for the different parameters were taken from similar data for the benchmark 13X zeolite.

Adsorption column at lab-scale

The following assumptions were used to describe the dynamics of fixed-bed adsorption in a small column maintained in a thermostatted oven:

- Adsorption occurs under isothermal conditions

- The flow pattern can be described by the axially dispersed plug flow model

- The gas phase behaves as an ideal gas mixture

- Radial gradients are negligible (one-dimensional flow)

- No intrapellet gradients.

With these assumptions, the following total mass balance and component balances for the adsorbates can be written:41

 
image file: c4ra12460j-t5.tif(5)
 
image file: c4ra12460j-t6.tif(6)
where C is the concentration (mol m−3), t is the time (s), v is the interstitial velocity (m s−1), z is the position (m), εB the bed voidage (−), ρp the pellet density (kg m−3), y is the mole fraction (−), Dax is the axial dispersion coefficient (m2 s−1), and u is the superficial velocity (m s−1) which corresponds to the interfacial velocity multiplied by the bed voidage.

Initially, the bed is assumed to be completely regenerated and filled with helium (He). The mole fraction of He throughout the experiment is found from the continuity equation:

 
image file: c4ra12460j-t7.tif(7)

The total concentration C is given by the ideal gas law:

 
image file: c4ra12460j-t8.tif(8)

The velocity is calculated from the Ergun equation assuming spherical particles:44

 
image file: c4ra12460j-t9.tif(9)
where ρg is the gas density (kg m−3), dp is the pellet diameter (m), and μg is the gas viscosity (Pa s).

Mass transfer from the gas phase to the adsorbed phase is described via the linear driving force (LDF) model:

 
image file: c4ra12460j-t10.tif(10)
here, kLDF is the mass transfer coefficient (s−1).

The equilibrium loading is obtained from the isotherm equation. For adsorption in a bed of pelletized crystals, one has to account for the adsorbate retained in the macropores of the adsorbent. Therefore, the isotherm equation becomes as follows in the case of 2 adsorbates:

 
image file: c4ra12460j-t11.tif(11)
where εp is the pellet voidage (−).

In this study, the function f corresponds to the dual-site Langmuir equation (see eqn (2)).

Details on the derivation and assumptions for the different isotherm models can be found in Do's monograph.45 The second term in eqn (11) incorporates the gas in the macropores of the pellet and disappears when describing adsorption on crystals during static adsorption measurements. Details on the estimation or calculation of the parameters Dax,i, εB, εp, μg, ρp, ρg and the boundary conditions is presented in the ESI. The system of differential and algebraic equations was solved in Matlab R2012a with at least 30 spatial nodes. During simulations the kLDF coefficient was changed in order to have an optimum fit for the shape of the experimental breakthrough profiles.

Adsorption at industrial scale (PSA modeling with MINSA)

To predict the performance of the different investigated adsorbents in a pressure swing adsorption unit, the numerical adsorption simulator MINSA developed by Webley, He and Todd was used.46,47 The equations for the conservation of mass and energy were reported by Todd et al.47 Mass transfer from the gas to the adsorbed phase is described via the so-called Partial pressure form of the LDF model,47 where the LDF coefficients obtained from the breakthrough simulations (vide supra) are used as input parameters. Pressure drop calculations are performed via the Ergun equation (eqn (9)). Boundary conditions for all the different PSA steps are based on flow through a valve. Application of control loops within the simulation leads to a constrained CSS (cyclic steady state) solution satisfying the design specifications. Therefore, the dependent variables in the PSA system are forced to reach their target values at CSS by adjusting them with proportional integral derivative (PID) algorithms.

For comparative purposes a simple 6-step vacuum PSA process with 2 beds for separation of an equimolar CO2–CH4 mixture was used (Fig. S1). The cycle consists of a basic Skarstrom operation for 2 beds to which pressure equalization via the product ends has been added to improve the CH4 recovery. CH4 is collected at the product end in the raffinate stream and CO2 at the inlet side as the extract. The function of each step has been explained in former work.41 Although several modifications can be applied to this cycle in order to improve the process performance, the goal of the present study is to compare materials rather than to do detailed design and/or optimization of a PSA unit.

The different adsorbents were compared on the basis of purity (P), recovery (R) and CH4 productivity, which are defined as follows:

 
image file: c4ra12460j-t12.tif(12)
 
image file: c4ra12460j-t13.tif(13)
 
image file: c4ra12460j-t14.tif(14)
 
image file: c4ra12460j-t15.tif(15)
 
image file: c4ra12460j-t16.tif(16)
where FTOT,in is the total inlet flow (mol per day), mz is the zeolite mass in the column (kg) and the productivity is in mol CH4 per kg zeolite per day.

The main goal of the chosen PSA process is to produce fuel grade methane (methane purity ≥ 98%).6 It is however most probable that in the future more stringent specifications will apply to the methane recovery given its high greenhouse warming potential (vide supra).6

The cycle parameters and operating conditions for the reference process with 13X are given in Tables S1 and S2. They are based on previous experiments with zeolite 13X.48

Results and discussion

First, the results of the characterization study of the Rb- and Cs-exchanged ZK-5 zeolites are discussed. Afterwards, the pure component kinetic and equilibrium properties of CO2 and CH4 on both adsorbents are analyzed. These data are essential when choosing an adsorbent for industrial CO2/CH4 separations. Furthermore, the potential of both adsorbents under dynamic conditions is experimentally assessed via breakthrough experiments and compared to the benchmark 13X adsorbent. In the final sections, the experimental data are used to simulate the performance of both adsorbents on an industrial scale and to elucidate further on the adsorption mechanism(s).

Characterization of Rb-ZK-5 and Cs-ZK-5

XRD experiments confirmed that the KFI structure was retained after exchange with RbCl or CsCl solutions (see Fig. S2–S3). SEM measurements indicated that the particle size was about 1–2 μm (Fig. S4). The unit cell composition of the Rb- and Cs-exchanged zeolites is reported in Table 1.
Table 1 Molecular formulas and Si/Al ratio of investigated ZK-5 zeolites
Sample Cation radius (nm) (ref. 49) Unit cell formula Si/Al
Rb-ZK-5 0.147 K0.6Rb19.3[Si76.1Al19.9O192] 3.8
Cs-ZK-5 0.167 K0.6Cs19.4[Si76Al20O192] 3.8


Both K-ZK-5 batches are almost fully exchanged to the Rb or Cs form. Therefore, the Rb-exchanged and Cs-exchanged forms of K-ZK-5 are termed Rb-ZK-5 and Cs-ZK-5 in what follows. These results seem at first sight contradictory with the observed cut-offs during exchange with Rb or Cs salts in previous studies (vide infra).29,32 However, Dyer and Enamy used the original synthesis method from Kerr30 in which a large structure directing agent (1,4-dimethyl-1,4-diazonobicyclo[2.2.2]-octanedihydroxide) is employed. As a result, quaternary ammonium ions are present in the ZK-5 pores after synthesis. It has already been shown in previous studies that these ammonium cations are hard to remove from the KFI framework (especially at low Si/Al ratio).16,34 Therefore, they could have made full exchange with the large Rb+ or Cs+ ions in Kerr's study impossible. In addition, it has to be highlighted that their starting material for exchange was Na-ZK-5 whereas in this study it is K-ZK-5. Dyer and Enamy stated that if Na-ZK-5 is used as a starting material, the exchange with Rb+ or Cs+ ions could force Na+ ions into the double hexagonal prisms sites (M2 sites in Fig. 1) and thus making it unavailable for exchange anymore.32 Similar phenomena have been reported for zeolites A, X, Y upon exchanges with Rb+ or Cs+ ions starting from the sodium form of the zeolite.32 On the contrary, this would probably not be the case for K+ cations (in case of K-ZK-5 as a starting material) given their larger size making it energetically highly unfavorable to reside in a M2 site. We realize that the above statements are all tentative explanations and a further study would be required to completely clarify the underlying principles governing the exchange with large cations such as K+, Rb+ and Cs+ within KFI.

Rietveld refinements (see Fig. S5) have shown that Cs+ ions preferentially coordinate in 8 MR sites (the M3 and M4 sites), as shown in Table 2 and Fig. 2. The disordered M3 site, where a splitting of the Cs+ position is observed (see Fig. 2), contains 43.5% of the Cs+ cations (8.7 cations per unit cell) and the M4 site has 56.5% of them (11.3 Cs+ cations per unit cell). The slight preference for the M4 site is in line with previous work.28,29 Localization of K+ cations was not possible due to the very small amount of potassium in the structure of Cs-ZK-5 and the very strong scattering from Cs+ ions. As a result, 83% (20 out of 24) of the available 8 MR sites per unit cell are filled with Cs+ cations (12 available M3 sites and 12 available M4 sites per unit cell in KFI).

Table 2 Unit cell parameter, space group, and cation site occupancies in dehydrated Cs- and Rb-ZK-5. The location of the different sites is shown in Fig. 2 and 3
Sample Unit cell parameter (Å) Space group Site M1 Site M3 Site M4
Atoms/unit cell Atoms/unit cell Atoms/unit cell
Cs-ZK-5 18.6698(7) Im[3 with combining macron]m 8.70 11.30
Rb-ZK-5 18.6329(1) Im[3 with combining macron]m Rb+, 1.76, K+, 0.6 8.93 8.97


image file: c4ra12460j-f2.tif
Fig. 2 Different cation sites (left) with associated electron density maps (right) in Cs-ZK-5: (a) Cs1 or M3-site showing the splitting of this site; (b) Cs2 or M4-site.

According to the refinements (Fig. S6), Rb+ cations can be found in three extra framework sites (see Table 2 and Fig. 3). The M3 and M4 sites contain each 46% of the Rb+ cations (about 9 Rb+ cations on each site). The remaining 8% of the cations were found in the M1 site.


image file: c4ra12460j-f3.tif
Fig. 3 Different cation sites (left) with associated electron density maps (right) in Rb-ZK-5: (a) Rb1 or M3-site; (b) Rb2 or M4-site; (c) Rb3/K3 or M1 site (see also Fig. S7) in which Rb+ and K+ cations were found.

Earlier, Rb+ ions were localized in a similar site near the six-membered ring of the α-cage in the LTA zeolite.50,51 K+ cations were also localized in the M1 site (see also Fig. S7 for the exact location of the M1 site).28 The occupancy for potassium was fixed according to the chemical analysis. As for Cs-ZK-5, a large fraction of the central 8 MR sites, i.e. 75% or 18 out of 24 available sites per unit cell, is filled with cations in Rb-ZK-5.

The distances between the cations and the corresponding oxygen ring atoms are given in the cif files and are in line with previously reported values.29

In the following sections we will investigate the adsorption properties and separation performance of both materials. At the same time, we aim to explain trends and differences between both adsorbents based on the results of the characterization study presented above.

Pure component kinetic and equilibrium data

Fig. 4b shows the adsorbed amounts of CH4 on Rb-ZK-5 at 303 K up to 1 bar using equilibration times of 45 s and 120 s, respectively. It has to be noted that both equilibration intervals are already rather large, given that typical measurements are carried out with an equilibration time of 20 s.52 The same data are presented in Fig. 4a for CO2. Clearly, amounts adsorbed for CH4 increase with increasing equilibration times, showing that the adsorption of methane suffers from strong diffusional limitations (Fig. 4b). On the contrary, the adsorption of CO2 does not seem to be hindered since equal amounts adsorbed were recorded when changing the equilibration time from 45 to 120 s (Fig. 4a).
image file: c4ra12460j-f4.tif
Fig. 4 Adsorbed amounts at 303 K of CH4 and CO2 on Rb-ZK-5 and Cs-ZK-5 at different equilibration times (teq.): (a) CO2 on Rb-ZK-5; (b) CH4 on Rb-ZK-5; (c) CO2 on Cs-ZK-5; (d) CH4 on Cs-ZK-5.

A similar behavior is observed on Cs-ZK-5. The adsorption of CH4 on Cs-ZK-5 is even more restrained than on Rb-ZK-5. At an equilibration time of 45 s, almost no CH4 is being adsorbed up to 1 bar (Fig. 4d). Contrarily to Rb-ZK-5, the adsorption of CO2 seems kinetically limited (Fig. 4c). About 1.1 mmol g−1 CO2 is adsorbed at 303 K and 1 bar with an equilibration time of 45 s. The adsorbed amount increases to 2.2 mmol g−1 with an equilibration time of 120 s under the same conditions.

As expected, the presence of large cations in the central 8 MR sites of ZK-5, with high occupancies of these sites (see Table 2), clearly hinders the adsorption of methane. In the case of Cs-ZK-5, the larger size of the Cs+ cations also introduces kinetic limitations for CO2. However, since the adsorption of CO2 is much less impeded on both adsorbents and CO2 is preferentially adsorbed, Rb-ZK-5 and Cs-ZK-5 seem interesting candidates for CO2/CH4 separations.

In order to simulate the performance of the adsorbents on a lab- and industrial scale, equilibrium data at higher pressure are also needed.

Therefore, adsorbed amounts of CO2 and CH4 were measured up to 8 bar at different temperatures with an equilibration time of 120 s (Fig. 5). All isotherms of CO2 and CH4 on both zeolites exhibit a type I shape according to the Brunauer–Deming–Deming–Teller (BDDT) classification with increasing adsorbed amounts with increasing pressure and decreasing adsorbed amounts with increasing temperature.


image file: c4ra12460j-f5.tif
Fig. 5 Adsorption isotherms (full lines) of (a) CO2 on Rb-ZK-5; (b) CH4 on Rb-ZK-5; (c) CO2 on Cs-ZK-5; (d) CH4 on Cs-ZK-5 at an equilibration time of 120 s. Dashed lines correspond to dual-site Langmuir fits.

Afterwards, the isotherm data at the 3 different temperatures were fitted to a dual-site Langmuir model (see eqn (2)–(4)). The obtained parameters are given in Table S3. It has to be noted that here the dual-site Langmuir model is merely used as a simple mathematically fitting model that can easily be fed to the numerical PSA simulator. As a result, the different model parameters do not have a sound physical meaning.

Dynamic separation potential

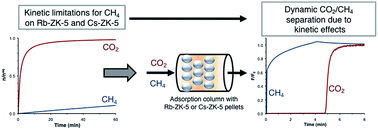
Dynamic capacity and kinetics. Fig. 6 depicts the CO2 and CH4 breakthrough profiles upon separation of a 40% CO2–60% CH4 mixture at 303 K and 1 bar on Rb-ZK-5 and Cs-ZK-5, respectively.
image file: c4ra12460j-f6.tif
Fig. 6 Breakthrough profiles for a 40% CO2–60% CH4 mixture at 303 K and different pressures showing the detected flow rate (F) divided by the feed flow rate F0 for a given component as a function of time (FTOT,in = 20 NmL min−1): (a) Rb-ZK-5, PTOT = 1 bar; (b) Cs-ZK-5, PTOT = 1 bar; (c) Rb-ZK-5, PTOT = 5 bar; (d) Cs-ZK-5, PTOT = 5 bar. Dotted lines correspond to simulated profiles.

CO2 is selectively adsorbed on both adsorbents, resulting in larger elution times. The CH4 elution profile on Rb-ZK-5 shows a small roll-up: the exit flow of methane temporarily exceeds the feed flow rate. The roll-up indicates the displacement of preadsorbed CH4 molecules by CO2 molecules. In addition to the competitive breakthrough experiment, a pure CH4 breakthrough experiment was also performed (Fig. S8). The broad pure component breakthrough profile of CH4 on Rb-ZK-5 further proves the diffusional limitations for CH4 under dynamic conditions on Rb-ZK-5 (Fig. S8). Although the diffusion of methane is thus clearly hindered on this adsorbent, the roll-up in Fig. 6a shows that CH4 still enters the cages in the presence of CO2 (competitive adsorption) under the given experimental conditions. Mass balance calculations result in adsorbed amounts of 0.20 mmol g−1 CH4 and 2.30 mmol g−1 CO2 at saturation with a corresponding selectivity of 17 (Table 3). The selectivity is high under dynamic conditions due to the low adsorbed amount of CH4, which is a result of most of the adsorbed CH4 molecules being pushed out of the adsorbent cages by CO2. For these calculations the selectivity was defined as:

 
image file: c4ra12460j-t17.tif(17)
where the adsorbed amounts are taken at saturation, i.e. when the detected flow rate (F) divided by the feed flow rate (F0) for a given component is equal to 1 (see also Fig. 6).

Table 3 Adsorbed amounts and selectivities at saturation for breakthrough separation of a 40% CO2–60% CH4 mixture at 303 K and different pressures on Rb-ZK-5, Cs-ZK-5, and 13X
Adsorbent qCH4 (mmol g−1) qCO2 (mmol g−1) α
PTOT = 1 bar
Rb-ZK-5 0.20 2.30 17
Cs-ZK-5 0.15 1.70 17
13X 0.07 4.13 89
[thin space (1/6-em)]
PTOT = 5 bar
Rb-ZK-5 0.55 3.00 8
Cs-ZK-5 0.38 2.37 9
13X 0.12 5.26 66
[thin space (1/6-em)]
PTOT = 8 bar
Rb-ZK-5 0.83 3.30 6
Cs-ZK-5 0.56 2.39 7


The simulations accurately catch the obtained breakthrough profiles and the predicted adsorbed amounts are thus very close to the experimentally ones (Fig. 6). Simulations predict adsorbed amounts of 0.29 mmol CH4 per g and 2.19 mmol CO2 per g respectively. The kLDF values, which fit best the shape of the elution profiles, are reported in Table 4. Since the mass transfer of CH4 from the gas to the adsorbed phase is much more hindered due to the presence of the cations in the central 8 MR sites, the kLDF value for CH4 is rather low (0.06 s−1) and much smaller than the one obtained for CO2 (1.0 s−1).

Table 4 kLDF values for CO2 and CH4 on Rb-ZK-5 and Cs-ZK-5 at 303 K and different pressures for a 40% CO2–60% CH4 mixture
Rb-ZK-5 PTOT = 1 bar PTOT = 5 bar
a The lower kLDF value for CO2 at higher pressures is most probably a result of the increased back mixing in the extra-column volume (the volume between the column and the detector). This effect causes the observed kLDF value to decrease at higher pressures for adsorbates that do not suffer from diffusional limitations. Further details can be found in the work of Rajendran et al.,57 Najafi Nobar et al.58 and Joss et al.59
kLDFCO2 (s−1) 1.0 0.75a
kLDFCH4 (s−1) 0.06 0.1

Cs-ZK-5 PTOT = 1 bar PTOT = 5 bar
kLDFCO2 (s−1) 0.06 0.1
kLDFCH4 (s−1) 0.005 0.03


The CH4 breakthrough profile on Cs-ZK-5 does not have a roll-up, but is extremely broad. This is indicative of severe diffusional limitations for CH4 on Cs-ZK-5, which are further confirmed by the very broad pure component CH4 breakthrough profile (Fig. S9). Therefore, the kLDF value for CH4 on Cs-ZK-5 (0.005 s−1) is much lower than on Rb-ZK-5 (0.06 s−1). Contrarily to Rb-ZK-5, diffusional limitations exist for CO2 on Cs-ZK-5 (see also Fig. 4c). Therefore, the mass transfer front of CO2 is much more dispersed than on Rb-ZK-5 yielding lower kLDF values for CO2 on Cs-ZK-5. Although adsorption of CH4 is strongly hindered, adsorbed amounts of CH4 are similar as for Rb-ZK-5 (Fig. 6 and Table 3). Mass balance calculations result in adsorbed amounts of 0.15 mmol g−1 CH4 and 1.70 mmol g−1 CO2 with a corresponding selectivity of 17 (Table 3). The profiles and adsorbed amounts are accurately predicted by the simulations, which yield adsorbed amounts of 0.16 mmol CH4 per g and 1.69 mmol CO2 per g respectively.

As a result, it can be concluded that CH4 enters the pores of the ZK-5 zeolite with the largest extra-framework cation under dynamic conditions despite the strong diffusional limitations. Given the slightly lower CH4 capacity and slightly lower CO2 capacity compared with Rb-ZK-5, the CO2/CH4 selectivity on Cs-ZK-5 (α = 17) is similar as for Rb-ZK-5 (α = 17). The breakthrough data are in line with the isotherm data (Fig. 4 and 5) and further confirm that 8 MR zeolites in which a large fraction of the central 8 MR sites are filled by large cations such as Rb+ or Cs+ (see Table 2) are able to separate CO2 from CH4 at low pressures. Since the adsorbed amounts of CH4 under dynamic conditions (see Table 3) are much lower than the equilibrium adsorbed amounts (Fig. 4) and the pure component CH4 profiles are extremely broad (Fig. S8 and S9), the separation of CO2 from CH4 on Rb-ZK-5 and Cs-ZK-5 can be termed as kinetic at low pressures.

At higher pressures, the diffusion of CH4 is enhanced and larger kLDF values are obtained for CH4, especially for Cs-ZK-5 (Table 4). As CH4 gains easier access to the adsorbent cages, higher adsorbed amounts of CH4 are obtained at higher pressures (Table 3). Since the CO2 capacity only rises moderately at higher pressures, the selectivity decreases with increasing pressure (Table 3). Therefore, it seems most interesting to carry out the CO2/CH4 separation at low pressures, i.e. P < 5 bar.

Desorption. Another important consideration when selecting an adsorbent for a given separation relates to its regeneration (desorption) characteristics. In conventional CO2 absorption units, the largest part of the cost is related to the thermal regeneration of the absorbent. It is therefore highly important that the adsorbed CO2 can easily be removed from the adsorbent in order to reuse the material for a following cycle during the upgrade of the biogas via PSA. In order to investigate the desorption performance of both zeolites, the desorption profiles for CO2 and CH4 on Rb-ZK-5 and Cs-ZK-5 were measured at 1 bar (Fig. 7).
image file: c4ra12460j-f7.tif
Fig. 7 Desorption profiles for CO2 and CH4 on (a) Rb-ZK-5 and (b) Cs-ZK-5. The temperature profile is shown on the secondary axis.

Therefore, after saturating the column with the CO2–CH4 mixture, the column is first flushed with He (20 NmL min−1) for about 33 min. Afterwards, the temperature is increased at a rate of 5 K min−1 up to 473 K (Fig. 7). Methane is easily desorbed from both adsorbents: after less than 2 minutes under He flow without heating, the whole adsorbed amount of CH4 is removed from the adsorbents under isothermal conditions. CO2 has a considerably wider desorption profile due to its larger adsorption enthalpy (Fig. 8). The adsorption enthalpy for CO2 varies between 25 and 40 kJ mol−1 in the loading range under investigation whereas the isosteric enthalpy for CH4 always remains lower than 25 kJ mol−1 on both adsorbents (Fig. 8).


image file: c4ra12460j-f8.tif
Fig. 8 Adsorption enthalpies of CO2 and CH4 on Rb-ZK-5 and Cs-ZK-5: (a) CO2; (b) CH4.

A considerable fraction of CO2 can only be desorbed upon heating as visualized by the hump in the CO2 desorption profiles after 35 minutes (Fig. 7).

Benchmarking at lab-scale. To evaluate the performance of Rb-ZK-5 and Cs-ZK-5 for CO2/CH4 separation at lab-scale, their adsorption and desorption characteristics were compared with the benchmark 13X zeolite. The adsorbed amounts for CO2 and CH4 and corresponding selectivities on 13X during the same breakthrough experiments are shown in Table 3. Values for 13X (NaX) were taken from Peter et al.42 Clearly, 13X has a higher CO2 capacity over the whole investigated pressure range due to the strong electrostatic interaction with CO2 and its larger pore volume.42 However in an industrial process, the working capacity rather than the capacity is one of the key design parameters. Because 13X already has a higher capacity under adsorption conditions, the working capacity of Rb-ZK-5 or Cs-ZK-5 could only be larger than for 13X if their CO2 capacity under desorption conditions is lower than for 13X. However, both ZK-5 adsorbents do not have a CO2 adsorption enthalpy that is considerably lower than for 13X.23,53 Therefore, their CO2 working capacity is also most probably lower than for 13X.

This can be further analyzed by comparing the desorption profiles and the ease of desorption. In former work, the fractional amount of CO2 desorbed under He purge at 3x the breakthrough time has been taken as a metric for the ease of desorption.42 At 1 bar and 303 K, 72% and 69% of CO2 are desorbed at 3× the breakthrough time on Rb-ZK-5 and Cs-ZK-5 respectively. For 13X, 65% of the adsorbed CO2 is being desorbed under these conditions. Clearly, it is easier to desorb CO2 from Rb-ZK-5 and Cs-ZK-5 but the difference in energy needed for regeneration with 13X will be (very) small. Therefore, similar amounts of energy are needed to regenerate these three adsorbents and the studied ZK-5 adsorbents do not seem to show a large advantage on the aspect of adsorbent regeneration.

To recap the benchmarking at lab-scale, we have found out that:

- Rb-ZK-5 and Cs-ZK-5 have slightly lower CO2 adsorption enthalpies than 13X. As a result, desorption is slightly less energy-intensive on the ZK-5 adsorbents (see Fig. 7 and 8).

- 13X has higher CO2 capacity and selectivity (see Table 3)

- 13X has a higher working capacity.

Therefore, 13X thus seems a better candidate for industrial CO2/CH4 separation. To verify this statement and finalize the performance comparison of this study, PSA simulations were performed.

Benchmarking at larger scale – PSA simulations

High CH4 recovery (83%), very high CO2 recovery (99%) and rather high CO2 purity (86%) were obtained for the reference PSA cycle with 13X (Table 5).
Table 5 Performance indicators for a dual-bed 6 step PSA process for biogas separation
Adsorbent CH4 purity (%) CO2 purity (%) RCH4 (%) RCO2 (%) CH4 productivity (mol CH4 per kg zeolite per day)
13X 98 86 83 99 18.1
Rb-ZK-5 98 57 27 99 1.8
Cs-ZK-5 98 52 8 99 0.2


In order to cope with the CH4 purity requirement (production of fuel grade CH4 with a 98% purity) on Rb-ZK-5 and Cs-ZK-5, the feed flow rate had to be reduced. The lower feed flow rate is due to the lower CO2 capacity and slower mass transfer characteristics on these ZK-5 adsorbents. The combination of a lower selectivity and increased mass transfer resistance on Rb-ZK-5 and Cs-ZK-5 results in much lower CH4 recoveries and correspondingly lower CO2 purities (see Table 5). Accordingly, the reduction in feed flow rate causes lower productivity of CH4 on both ZK-5 adsorbents. On Cs-ZK-5, one has to go to an even deeper vacuum of 0.05 bar in order to obtain fuel grade methane. Therefore, the CO2 purity and CH4 recovery are extremely low. In addition, much more energy would be required to achieve this vacuum level (5 kPa), compared to the vacuum level on 13X (10 kPa). Even though the cycle configuration and cycle parameters could still be optimized, the above initial results show that Rb-ZK-5 and Cs-ZK-5 have a much lower performance than 13X for biogas separation.

Performance of KFI zeolites in relation to their structure

As stated previously, a large fraction of the central 8 MR sites are filled with Rb+ or Cs+ cations in Rb-ZK-5 or Cs-ZK-5. Therefore, adsorption of Ar at 87 K is negligible on both adsorbents (Fig. 9).
image file: c4ra12460j-f9.tif
Fig. 9 Ar isotherms at 87 K on different ZK-5 adsorbents. Ar isotherms for Rb-ZK-5 and Cs-ZK-5 coincide with negligible adsorbed amounts on both adsorbents.

Contrarily, K-ZK-5 has a much larger pore volume of 0.10 mL g−1 under these conditions since now only the interconnected γ-cages are completely blocked.16 It has been demonstrated before by Lievens et al. that K+ cations preferentially fill M3-sites.28 Other univalent cations such as Li+ and Na+ do not preferentially occupy 8 MR sites and therefore create large Ar pore volumes at 87 K (0.21–0.24 mL g−1).16

At higher temperatures, significant adsorption of CO2 occurs on Rb-ZK-5 and Cs-ZK-5, showing that the internal voids are accessible under these conditions. Therefore, at least part of the cations in the central 8 MR sites permanently or temporarily move away from their original positions upon CO2 adsorption.15,54 Further studies involving Density Functional Theory (DFT) calculations, in situ powder X-ray diffraction of gas adsorption at different temperatures with refinement of the unit cell structure and cation positions and nuclear magnetic resonance (NMR) would be needed to unravel the motion of cations in these ZK-5 adsorbents upon heating and adsorption of CO2.

One could also think that adsorption and separation of CO2 on ZK-5 occurs via a so-called “trapdoor” mechanism as recently observed by Shang et al. on low-silica CHA structures with large cations.15 They showed that CO2 separation on K-CHA and Cs-CHA (Si/Al = 1–2) does not dominantly rely on the size of the adsorbate but on the interaction of the adsorbate with the cation in the central 8 MR site (called door-keeping cation). The term “trapdoor” refers to the fact that the interaction between the adsorbate and the door-keeping cation must be strong enough such that the energy barrier for cation migration is lowered and thus the cation is temporarily moved away from the pore aperture allowing the adsorbate to enter the zeolite cage. “Strong” adsorbates such as CO2 and CO are able to “open the door” (induce the door-keeping cation to deviate from its initial position), whereas “weaker” adsorbates such as CH4 and N2 are not. In order to assure the trapdoor mechanism to occur, all the central 8 MR sites within the unit cell have to be occupied by cations.15,52 For KFI, this would require a total of 24 cations per unit cell to fill all the “door-keeping” 8 MR window sites. The unit cell formula for KFI is image file: c4ra12460j-t18.tif, where n is the valence of the metal cation and i the number of aluminum atoms per unit cell. Therefore, at least 24 aluminum atoms would be required to achieve a trapdoor effect in KFI, if all cations are univalent. This corresponds to a critical Si/Al ratio of 3 ((96 − 24 = 72)/24) for KFI. A priori, the “trapdoor” mechanism would therefore not be expected on the Rb-ZK-5 and Cs-ZK-5 zeolites since their Si/Al ratio (3.8) is larger than the critical one (3.0). Shang et al. stated that the trapdoor mechanism could also prevail in zeolites for which the Si/Al ratio is close to the critical Si/Al ratio due to the percolation theory. The negligible adsorption of Ar on Rb-ZK-5 and Cs-ZK-5 is in accordance with this observation.

However, if the trapdoor mechanism would occur in Rb-ZK-5 or Cs-ZK-5 zeolites, a maximum, corresponding to the critical admission temperature,15 would appear in the CH4 isobar at e.g. 1 bar. Adsorbed amounts of CH4 increase monotonically even when the temperature is decreased to 261.15 K (Fig. 10).


image file: c4ra12460j-f10.tif
Fig. 10 Adsorption isotherms of CH4 at different temperatures on (a) Rb-ZK-5; (b) Cs-ZK-5.

Therefore, it is clear that the trapdoor effect could only be of significant importance at very low temperatures on Rb-ZK-5 and Cs-ZK-5, say T < 261 K, which is typically impractical for real process applications during biogas upgrading. Therefore, the admission of CO2 is most probably due to thermal effects. Hereby, we mean that the effective window size (available window space for adsorbates) can increase due to thermal vibration of oxygen atoms surrounding the window and the cations in the window sites. In combination with the increased thermal energy of the adsorbates, this most probably leads to increasing adsorbed amounts of CO2 and CH4 with increasing temperatures on Rb-ZK-5 and Cs-ZK-5 within the investigated temperature range.

Turning back to the adsorption of CH4, kinetic limitations for CH4 on Rb-ZK-5 and Cs-ZK-5 clearly form a benefit for industrial CO2/CH4 separations by yielding a high selectivity. Unfortunately, the interaction with CO2 on Rb-ZK-5 is not strong enough to remove (almost) all the preadsorbed CH4 molecules during binary breakthrough experiments (see Table 3). Subsequently, the selectivity on Rb-ZK-5 is lower than for 13X (Table 3). The lower selectivity in combination with the lower working capacity results in a lower process performance for Rb-ZK-5 in comparison with 13X (see Table 5).

Another problem arises on Cs-ZK-5 where kinetic limitations are present for CO2 too. Mass transfer limitations for CO2 cause a broad mass transfer zone for CO2. Concomitantly, a large fraction of the adsorbent bed becomes unavailable for separation. Therefore, the simulated CH4 recovery and CO2 purity are extremely low on Cs-ZK-5 (Table 5).

A similar situation occurs for other very low-silica 8 MR zeolites with large cations and thus also for trapdoor materials where mass transfer limitations for CO2 are often encountered. Although CH4 is practically unadsorbed on such materials,15,16 the kinetic limitations for CO2 will result in a large fraction of the bed being unused for separation due to the very broad mass transfer zone for CO2. The only way to get around this is by decreasing the feed flow rate. Initial experiments indicate that with a lower feed flow rate, very high CH4 purities can be obtained at reasonable CH4 recoveries and CO2 purities. The price to pay is the corresponding much lower productivity. Therefore, further research with respect to cycle configuration is needed before industrial implementation in CO2/CH4 separation processes of such trapdoor zeolites will be achieved.

The “ideal” 8 MR zeolitic adsorbent for kinetic biogas separation should thus have very high mass transfer resistance for CH4, (almost) no diffusional limitations for CO2 and an at least moderate CO2 capacity. Simulations for such an “ideal” adsorbent, with the CO2 and CH4 adsorption parameters of Cs-ZK-5 (see Table S3) and no mass transfer limitations for CO2 (kLDFCH4 = 10−4 s−1, kLDFCO2 = 1.0 s−1), have shown that CH4 recoveries of at least 75% are possible at a CH4 purity of at least 98% in our 6-step process. This is in line with former results by Cavenati et al. who obtained CH4 recoveries between 64 and 83% on Takeda Carbon Molecular Sieve 3K at CH4 purities between 93.5 and 98.7%.55 However, a low Si/Al ratio zeolite of the CHA, KFI or LTA type with these characteristics has not yet been found or synthesized to the best of our knowledge.

Conclusions

Recent work has demonstrated that 8 MR zeolites, in which the central sites of the interconnecting windows are filled with large cations, could hold large potential for industrial biogas separations.15,17,56 Therefore, in line with our recent work, the potential of the KFI type zeolites Rb-ZK-5 and Cs-ZK-5 was investigated for industrial CO2/CH4 separations.

Rietveld refinements showed that about 80% of the central 8 MR sites were filled by large univalent cations in Rb-ZK-5 and Cs-ZK-5. Further breakthrough experiments demonstrated that the large fraction of filled 8 MR sites in Rb-ZK-5 and Cs-ZK-5 allowed kinetic separation of CO2 from CH4. Dynamic selectivities at 1 bar are very high for both materials (α = 17). Both adsorbents have such a high selectivity due to the strong diffusional limitations present for CH4 (see Table 4). A disadvantage for Cs-ZK-5 is the occurrence of mass transfer limitations for CO2, yielding lower mass transfer coefficients on Cs-ZK-5 compared to Rb-ZK-5 (see Table 4) and a large part of the bed being unused for separation.

Upon comparison with the benchmark adsorbent 13X at lab-scale and larger scale, 13X still seems to be a better option. During breakthrough 13X has larger CO2 capacity, selectivity and no mass transfer limitations for CO2. As a result, 13X has higher CH4 recoveries and CO2 purity in the chosen reference PSA process.

Although Rb-ZK-5 and Cs-ZK-5 do not adsorb Ar at 87 K, they selectively adsorb large amounts of CO2 at 303 K. Since their Si/Al ratio is larger than the critical trapdoor ratio for KFI zeolites (Si/Al = 3.0) and CH4 adsorption increases with decreasing temperature (T = 323–261.15 K), it is highly probable that the admission of adsorbates in the studied temperature region is due to thermal effects.

Further research will focus on the position and motion of large cations within 8 MR sites in ZK-5 and other low-silica KFI structures as a function of temperature. In addition, the PSA cycle configuration for such materials needs to be studied in further detail. This will shed further light on the potential of low-silica KFI and other zeolitic structures in CO2/CH4 separations or other separations in which high purity of the raffinate is required.

Acknowledgements

Tom Rémy and Leen Van Tendeloo acknowledge FWO-Vlaanderen for financial support. Joeri F.M. Denayer acknowledges FWO-Vlaanderen for the 1.5.280.11N research grant. Elena Gobechiya and Christine E.A. Kirschhock acknowledge the Belgian Prodex Office and ESA for financial support. Johan A. Martens and Christine E.A. Kirschhock acknowledge the Flemish Government for long-term structural funding, Methusalem.

Notes and references

  1. Climate Change Secretariat (UNFCCC), National greenhouse gas inventory data for the period 1990–2011, United Nations Framework Convention on Climate Change, Warsaw, Poland, 2013 Search PubMed .
  2. Climate Change Secretariat (UNFCCC), Key GHG Data, United Nations Framework Convention on Climate Change, Bonn, Germany, 2005 Search PubMed .
  3. http://unfccc.int/ghg_data/items/3825.php.
  4. http://www.globalmethane.org.
  5. M. Hagen, E. Polman, J. K. Jensen, A. Myken, O. Jönsson and A. Dahl, Report SGC 118-Adding gas from biomass to the gas grid, Swedish Gas Center, Malmö, Sweden, 2001 Search PubMed .
  6. C. A. Grande and A. E. Rodrigues, Ind. Eng. Chem. Res., 2007, 46, 4595–4605 CrossRef CAS .
  7. M. Persson, O. Jönsson and A. Wellinger, IEA Bioenergy – Biogas Upgrading to Vehicle Fuel Standards and Grid Injection, IEA, 2006 Search PubMed .
  8. W. H. Zhou, J. P. Guo and H. Y. Tan, Adv. Mater. Res., 2011, 236, 268–271 CrossRef PubMed .
  9. M. Persson, Report SGC 142-Evaluation of upgrading techniques for biogas, Swedish Gas Center, Malmö, Sweden, 2003 Search PubMed .
  10. P. D. C. Dietzel, V. Besikiotis and R. Blom, J. Mater. Chem., 2009, 19, 7362–7370 RSC .
  11. S. R. Caskey, A. G. Wong-Foy and A. J. Matzger, J. Am. Chem. Soc., 2008, 130, 10870–10871 CrossRef CAS PubMed .
  12. T. Remy, S. A. Peter, S. Van der Perre, P. Valvekens, D. E. De Vos, G. V. Baron and J. F. Denayer, J. Phys. Chem. C, 2013, 117, 9301–9310 CAS .
  13. J. Liu, A. I. Benin, A. M. B. Furtado, P. Jakubczak, R. R. Willis and M. D. LeVan, Langmuir, 2011, 27, 11451–11456 CrossRef CAS PubMed .
  14. P. M. Schoenecker, C. G. Carson, H. Jasuja, C. J. J. Flemming and K. S. Walton, Ind. Eng. Chem. Res., 2012, 51, 6513–6519 CrossRef CAS .
  15. J. Shang, G. Li, R. Singh, Q. Gu, K. M. Nairn, T. J. Bastow, N. Medhekar, C. M. Doherty, A. J. Hill, J. Z. Liu and P. A. Webley, J. Am. Chem. Soc., 2012, 134, 19246–19253 CrossRef CAS PubMed .
  16. T. Remy, S. A. Peter, L. Van Tendeloo, S. Van der Perre, Y. Lorgouilloux, C. E. Kirschhock, G. V. Baron and J. F. Denayer, Langmuir, 2013, 29, 4998–5012 CrossRef CAS PubMed .
  17. M. M. Lozinska, E. Mangano, J. P. S. Mowat, A. M. Shepherd, R. F. Howe, S. P. Thompson, J. E. Parker, S. Brandani and P. A. Wright, J. Am. Chem. Soc., 2012, 134, 17628–17642 CrossRef CAS PubMed .
  18. T.-H. Bae, M. R. Hudson, J. A. Mason, W. L. Queen, J. J. Dutton, K. Sumida, K. J. Micklash, S. S. Kaye, C. M. Brown and J. R. Long, Energy Environ. Sci., 2013, 6, 128–138 CAS .
  19. Q. Liu, T. Pham, M. D. Porosoff and R. F. Lobo, ChemSusChem, 2012, 5, 2237–2242 CrossRef CAS PubMed .
  20. R. Krishna and J. M. van Baten, J. Membr. Sci., 2010, 360, 323–333 CrossRef CAS PubMed .
  21. M. Palomino, A. Corma, J. L. Jorda, F. Rey and S. Valencia, Chem. Commun., 2012, 48, 215–217 RSC .
  22. M. Palomino, A. Corma, F. Rey and S. Valencia, Langmuir, 2010, 26, 1910–1917 CrossRef CAS PubMed .
  23. J. Zhang, R. Singh and P. A. Webley, Microporous Mesoporous Mat., 2008, 111, 478–487 CrossRef CAS PubMed .
  24. F. N. Ridha and P. A. Webley, Sep. Purif. Technol., 2009, 67, 336–343 CrossRef CAS PubMed .
  25. J. Yang, Q. Zhao, H. Xu, L. Li, J. Dong and J. Li, J. Chem. Eng. Data, 2012, 57, 3701–3709 CrossRef CAS .
  26. J. Yang, R. Krishna, J. Li and J. Li, Microporous Mesoporous Mat., 2014, 184, 21–27 CrossRef CAS PubMed .
  27. M. M. Lozinska, J. P. Mowat, P. A. Wright, S. P. Thompson, J. L. Jorda, M. Palomino, S. Valencia and F. Rey, Chem. Mater., 2014, 17628–17642 Search PubMed .
  28. J. L. Lievens, J. P. Verduijn and W. J. Mortier, Zeolites, 1992, 12, 690–697 CrossRef CAS .
  29. J. B. Parise, R. D. Shannon, E. Prince and D. E. Cox, Z. Kristallogr., 1983, 165, 175–190 CrossRef CAS PubMed .
  30. G. T. Kerr, Science, 1965, 140, 1412 Search PubMed .
  31. W. M. Meier and G. T. Kokotailo, Z. Kristallogr., 1965, 121, 211–219 CrossRef CAS PubMed .
  32. A. Dyer and H. Enamy, Zeolites, 1981, 1, 66–68 CrossRef CAS .
  33. R. X. Fischer and W. H. Baur, Zeolites, 1986, 6, 378–387 CrossRef CAS .
  34. R. M. Barrer and W. Sieber, J. Chem. Soc., Dalton Trans., 1977, 10, 1020–1026 RSC .
  35. S. Sircar, Sep. Sci. Technol., 1988, 23, 519–529 CrossRef .
  36. J. P. Verduijn, U.S. Pat., 4,994,249, 1991 .
  37. S. Cartlidge and W. Meier, Zeolites, 1984, 4, 218–225 CrossRef CAS .
  38. M. Calligaris, A. Mezzetti, G. Nardin and L. Randaccio, Zeolites, 1986, 6, 137–141 CrossRef CAS .
  39. A. C. Larson and R. B. Von Dreele, in General Structure Analysis System (GSAS), Los Alamos National Laboratory, Los Alamos, 1994 Search PubMed .
  40. B. H. Toby, J. Appl. Crystallogr., 2001, 34, 210–213 CrossRef CAS .
  41. D. M. Ruthven, S. Farooq and K. S. Knaebel, in Pressure Swing Adsorption, VCH Publishers, Inc., New York, 1994 Search PubMed .
  42. S. A. Peter, G. V. Baron, J. Gascon, F. Kapteijn and J. F. Denayer, Adsorption, 2013, 1–10 Search PubMed .
  43. J. V. Beck and K. J. Arnold, in Parameter estimation in engineering and science, Wiley, New York, 1977 Search PubMed .
  44. R. S. Todd and P. A. Webley, Ind. Eng. Chem. Res., 2005, 44, 7234–7241 CrossRef CAS .
  45. D. D. Do, in Adsorption Analysis: Equilibria and Kinetics, Imperial College Press, London, 1998 Search PubMed .
  46. P. A. Webley and J. He, Comput. Chem. Eng., 2000, 23, 1701–1712 CrossRef CAS .
  47. R. S. Todd, G. B. Ferraris, D. Manca and P. A. Webley, Comput. Chem. Eng., 2003, 27, 883–899 CrossRef CAS .
  48. P. Xiao, J. Zhang, P. Webley, G. Li, R. Singh and R. Todd, Adsorption, 2008, 14, 575–582 CrossRef CAS .
  49. R. T. Yang, in Adsorbents: Fundamentals and applications, John Wiley & Sons, Inc., Hoboken, New Jersey, 2003 Search PubMed .
  50. S. H. Song, U. S. Kim, Y. Kim and K. Seff, J. Phys. Chem., 1992, 96, 10937–10941 CrossRef CAS .
  51. T. Ikeda and T. Kodaira, Stud. Surf. Sci. Catal., 2001, 135, 300 CrossRef .
  52. J. Shang, G. Li, R. Singh, P. Xiao, J. Z. Liu and P. A. Webley, J. Phys. Chem. C, 2013, 12841–12847 CAS .
  53. J. A. Dunne, M. Rao, S. Sircar, R. J. Gorte and A. L. Myers, Langmuir, 1996, 12, 5896–5904 CrossRef CAS .
  54. D. W. Breck, in Zeolite Molecular Sieves: Structure, Chemistry, and Use, John Wiley & Sons, New York, 1974 Search PubMed .
  55. S. Cavenati, C. A. Grande and A. E. Rodrigues, Energy Fuels, 2005, 19, 2545–2555 CrossRef CAS .
  56. Q. Liu, A. Mace, Z. Bacsik, J. Sun, A. Laaksonen and N. Hedin, Chem. Commun., 2010, 46, 4502–4504 RSC .
  57. A. Rajendran, V. Kariwala and S. Farooq, Chem. Eng. Sci., 2008, 63, 2696–2706 CrossRef CAS PubMed .
  58. S. Najafi Nobar and S. Farooq, Chem. Eng. Sci., 2012, 84, 801–813 CrossRef CAS PubMed .
  59. L. Joss and M. Mazzotti, Adsorption, 2012, 18, 381–393 CrossRef CAS .

Footnote

Electronic supplementary information (ESI) available: Additional info about breakthrough and PSA simulations, characterization and Rietveld refinement details, and dual-site Langmuir fitting parameters. See DOI: 10.1039/c4ra12460j

This journal is © The Royal Society of Chemistry 2014
Click here to see how this site uses Cookies. View our privacy policy here.