 Open Access Article
Creative Commons Attribution 3.0 Unported Licence
Tomography based screening of flow field / current collector combinations for PEM water electrolysis
L.
Zielke
a,
A.
Fallisch
b,
N.
Paust
ac,
R.
Zengerle
ac and
S.
Thiele
*ad
aLaboratory for MEMS Applications, IMTEK, Department of Microsystems Engineering, University of Freiburg, Georges-Koehler-Allee 103, 79110 Freiburg, Germany. E-mail: lukas.zielke@imtek.de; zengerle@imtek.uni-freiburg.de
bFraunhofer Institute for Solar Energy Systems ISE, Division Energy Technologies, Heidenhofstr. 2, 79110 Freiburg, Germany. E-mail: Arne.Fallisch@ise.fraunhofer.de
cHSG-IMIT Institut für Mikro- und Informationstechnik der Hahn-Schickard-Gesellschaft e.V., Georges-Koehler-Allee 103, 79110 Freiburg, Germany. E-mail: nils.paust@hsg-imit.de
dFIT, University of Freiburg, Stefan-Meier-Straße 21, 79104 Freiburg, Germany. E-mail: simon.thiele@imtek.de
First published on 31st October 2014
Abstract
Current collectors in PEM water electrolysis perform several functions that influence overall performance. These include conducting heat and electrons, as well as transporting water and gas. X-ray tomography, standardized reconstruction, and calculation methods are used to compare the morphological and transport parameters of eight different current collectors functioning as flow fields for PEM water electrolysis. We find simple exponential relations between through-plane thermal conductivity λ and porosity p (λ20°C(p) = 1749p−1.306 − 4.420), as well as between through-plane electrical conductivity σ and water permeability K (σ(K) = 10−6 × K−0.6376). In addition, we use both local and global concepts to investigate the pore space of current collectors. We hereby investigate homogeneity and characteristic sizes, like mean pore diameter or mean distance between solid parts at the catalytic interface. Moreover, we find that the local concept of mean chord lengths can be used to explain electrical and thermal conductivity anisotropies. These chords can be used to predict the direction of the largest conductivity for fibrous current collectors.
Introduction
As the share of renewable energy sources is steadily growing worldwide, the storage of fluctuating renewables becomes an important issue. Depending on the time scale of the storage, different solutions are possible. Hydrogen, as a secondary energy carrier, is suitable to store energy chemically bound over a long period of time. This can be in the GWh or even TWh range. The energy needed for the splitting of water can be easily provided by renewable energy sources like wind or solar. Thus, water electrolysis is suitable for generating hydrogen.Proton exchange membrane (PEM) electrolysis is highly suited for production of molecular hydrogen of nearly 100% purity.1 To generate hydrogen in a PEM electrolysis cell, a thermoneutral voltage of 1.48 V at room temperature must be exceeded. III–V tandem solar cells, under concentration, are able to generate voltages above 2 V and are therefore suitable for the production of hydrogen.
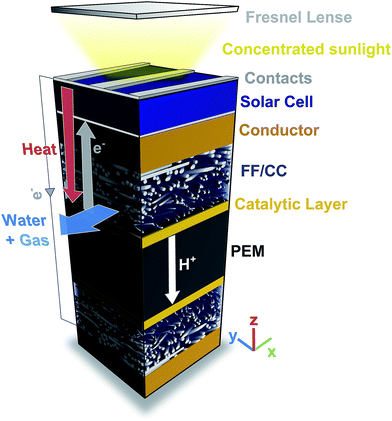
In the HyCon concept,2,3 these tandem solar cells are directly coupled to PEM electrolysis cells. This concept has the advantage that an electrical interconnection of the solar cells is spared and a failure of a single cell only leads to a small reduction in hydrogen production. Additionally, a DC-DC converter is spared, which also reduces the costs. A schematic drawing of the HyCon module is shown in Fig. 1.
The current generated by the solar cell is directly fed to the catalytic layers (CL) of the PEM electrolysis cell, via a conductor and a current collector. Moreover, heat is also transported to the area where the reaction takes place, decreasing the voltage needed for the reaction.
Concerning mass (water and gas) transport, the current collectors must also be able to function as a flow field. As a recently published study shows, PEM electrolysis devices without flow channels, but instead porous current collectors, do not decrease performance in HyCon cells. In these devices, the porous current collector acts both as the mass transport flow channel and current collector, thereby decreases costs.2
In this publication, we focus on various flow field current collector combinations (FF/CCs). To investigate the porous current collectors, 3D X-ray tomography reconstructions are used. X-ray tomography is highly suited for metal current collectors on this scale, as it provides sufficient resolution and excellent contrast. Surprisingly, this technique has hardly been used to explore the transport and morphology of metallic current collectors and the current collector flow field combinations in the past.
The present study shows that morphologically different samples, like fibrous and sintered structures, can be imaged whilst neither segmentation nor representativeness is problematic. The investigated structures in this paper are possible candidates for anodic and cathodic FF/CCs in a PEM electrolysis cell.
Regarding the HyCon module or related energy devices for PEM water electrolysis, the FF/CCs must:
(i) Have homogeneous current distribution in all directions, with a special focus on the direction from CL to separator plates.
(ii) Constantly supply water to the CL.
(iii) Transport gas bubbles out of the system.
(iv) Facilitate sufficient heat transport.
(v) Reduce ohmic losses at the FF/CC-CL interface.1,4–7
For each requirement, characteristic transport parameters were chosen, calculated, and compared for eight different FF/CC candidates. The corresponding transport parameters chosen are:
(i) Electrical conductivity in x, y and z direction.
(ii) + (iii) Water permeability.
(iv) Thermal conductivity in x, y and z.
(v) Distances of contact points between solid and CL and contact area of solid and CL.
In this paper, a comprehensive overview of calculated morphological and performance relevant transport parameters is provided, which can be used in macroscopic models of PEM water electrolysis or related works.4,8
Since all parameters in this work are calculated using the same standardized reconstruction and calculation tools, the parameters can be compared easily. In addition, we find two important relations. First, we find an exponential relation between porosity and two phase thermal conductivity from the solar cell to the CL. Secondly, another exponential relation between electrical conductivity from the CL to the solar cell, and in-plane water permeability of the FF/CC itself. These two relations hold true even for morphologically different materials, such as fibrous and sintered titanium FF/CCs. They can consequently be used to predict thermal conductivity from porosity, water permeability from electrical conductivity, or the other way around. Thereby, degrees of freedom in macroscopic simulations can be strongly reduced.
Experimental section
X-ray reconstruction
X-ray tomography was performed using a Skyscan system and source voltages of 90–100 kV. For all samples, except the sinter sample, a pixel size of 1 μm was chosen, resulting in a voxel volume of 1 μm3. To resolve the smaller features of the sintered sample, a pixel size of 0.75 μm was chosen. To crop out representative subvolumes, to rotate, and to coarse grain the images, the Fiji software was used.9 After these steps, the images were segmented using Otsu's method, implemented in Matlab.10 The Otsu threshold was then compared to visual judgment thresholds and found to be very reasonable. This was expected, since the contrast of pore space and metal is very high in all X-ray tomography images. To ensure that the 3D geometrical configurations are as realistic as possible, floating solid parts not connected to a wall were removed using standard Matlab functions.Calculations
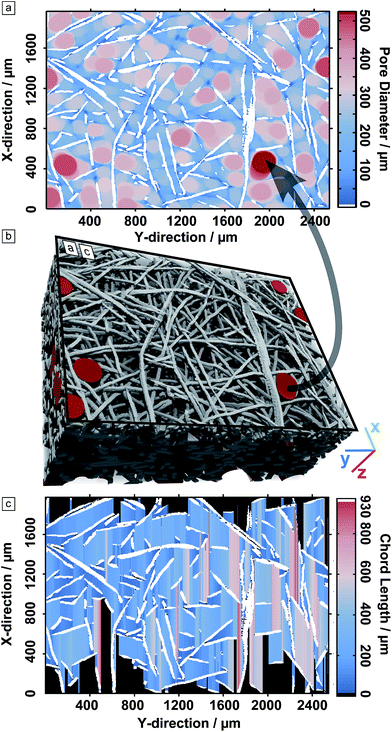
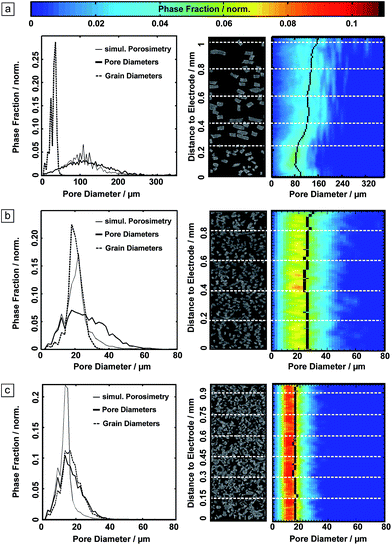
Electrical conductivity, thermal conductivity, water permeability, and global pore size distributions were calculated using the software GeoDict.11 For electrical conductivity, we solved for Ohm's law with titanium being the only conducting phase. As the conductivity is given as percent of the intrinsic conductivity, explicit values can be found by multiplying the presented relative conductivity with bulk values from the literature. However, one has to note, that contact resistances cannot be calculated. These values therefore represent the influence of the microstructure on the ohmic transport. Thermal conductivity was found by solving for Fourier's law, where the water filled pore space and the titanium solid parts both conduct heat. The used bulk thermal conductivity values are 0.6 Wm−1 K−1 and 21.9 Wm−1 K−1 at 20 °C, and 0.67 Wm−1 K−1 and 21 Wm−1 K−1 at 80 °C.12,13 The flow was assumed to be laminar, requiring Darcy's law to be solved. All other calculations were performed using Matlab.14 To determine local pore size distributions, the Delerue method was used for the whole volume.15,16 Subsequently, single slices containing information on local pore diameters can be investigated. An exemplary slice is shown in Fig. 2a. By creating a histogram of the occurring sphere diameters in this slice, we obtain one vertical line in the 2D colour plots, shown on the right of Fig. 4. To determine distances between solid material, chord length distributions were used.17 The only constraint is that a chord between a boundary and solid is forbidden (shown in black). This is shown in Fig. 2c. We propose these two methods for local investigation, since they run within a few minutes on standard desktop computers.Results and discussion
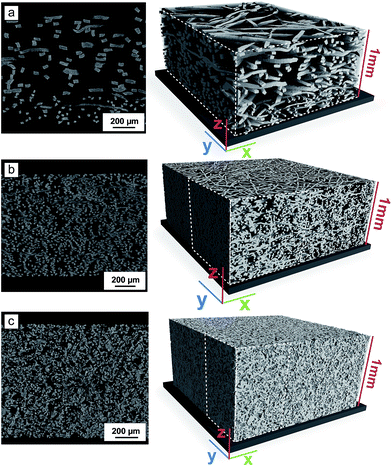
The bases of all calculations are 3D geometrical configurations, resulting from aligned and segmented X-ray tomography images. The three base case FF/CCs investigated in this work are shown in Fig. 3.As shown in Fig. 1, the direction from the CL to the solar cell is the z-direction (through-plane) and the directions parallel to the CL are x and y (in-plane). The local calculations in Fig. 4 are made in through-plane direction.
In the following, morphology and transport parameters are presented, compared and linked to each other when possible.
Morphology
Pore morphology investigation tools, like global and local pore size distributions (PSD), solid size distribution (SSD), and chord length distributions, are used to determine performance relevant parameters. These include the distance between contact points of FF/CC and CL, mean pore sizes and contact area to the CL.15–17It was found that mean chord lengths are a fast and reliable tool to predict thermal and electrical conduction anisotropies.
PSD/SSD
In Fig. 4, pore size distributions (PSDs) of the three FF/CCs are shown. On the left hand side, the PSD for the whole volume is shown (global). On the right hand side, it is shown for each plane parallel to the CL (locally). It is necessary to use both concepts to fully describe the pore spaces. Gradients cannot be detected using only global concepts, and total mean pore diameters cannot be found using the PSD only locally. This can be seen in Fig. 4a. Here, the FF/CC consists of two differently woven fibrous mats, each having different PSDs and SSDs. Local analysis yields that the upper mat has a mean pore diameter of 136 ± 16 μm, and 89 ± 7 μm for the lower part (last 200 μm thickness). This information is not visible by looking only at global PSD/SSDs (Fig. 4, left hand side). The other two investigated FF/CCs, the sintered material and the mat without a gradient, have homogeneously distributed pore sizes along the z-axis. The variance of their mean pore size in z direction is below 4%. The mean pore sizes m for all FF/CCs are shown in Table 1, among other morphological parameters.| FF/CC | p [%] | m [μm] | d [μm] | A [%] | Δm [%] |
|---|---|---|---|---|---|
| g82 (1 mm) | 82 | 120 | 195 ± 6 | 13.3 ± 0.7 | 11 |
| m70 (0.5 mm) | 70 | 41 | 71 ± 2 | 27.3 ± 0.5 | 14 |
| m69 (0.95 mm) | 69 | 43 | 69 ± 0.3 | 28.4 ± 0.4 | 15 |
| m62 (0.3 mm) | 62 | 35 | 48 ± 2 | 36.1 ± 0.4 | 12 |
| m54 (1.5 mm) | 54 | 27 | 42 ± 0.3 | 42.0 ± 0.2 | 20 |
| m52 (1 mm) | 52 | 26 | 39 ± 1 | 45.3 ± 0.04 | 21 |
| m51 (1 mm) | 51 | 26 | 38 ± 1 | 50.1 ± 0.5 | 21 |
| s46 (1 mm) | 46 | 17 | 21 ± 0.5 | 52.9 ± 0.2 | 20 |
Looking at the global size distributions, one can see that the gradient mat sample (Fig. 4a) shows two sharp peaks in the SSD, which can be assigned to the two different fibre diameters. The PSD of the gradient mat is very broad and contains diameters of up to 350 μm. For the sintered sample (Fig. 4c), the pore and solid size distribution are very similar; whereas the fibrous structure in Fig. 4b shows a narrow peak in the SSD which again is typical for fibrous mats.
In addition, we simulated standard mercury intrusion porosimetry to quantify the errors made by this technique. We find a systematically underestimation of large pores, which results in smaller mean pore diameters by porosimetry of up to 21%. The difference in mean pore diameters Δm is shown in Table 1.
We find that for the structures having larger porosities than 60%, Δm is between 11% and 15%. For structures having porosities of below 60%, Δm is between 20% and 21%.
Distance between contact points and contact area
In order to determine distances between solids at the interface of CL and FF/CC, chord length distributions can be used. Here, a chord represents the direct distance from one solid voxel to the next in a specific direction. The mean distance d, between the solid parts, and the contact area A, between the solid phase and the CL, were calculated in the vicinity of the CL. The values are shown in Table 1. They result from averaging distances and areas in both in-plane directions of the last three slices.From Table 1, it is visible that if the porosity p increases, the mean pore diameters m and the mean distance d also increase. However, the mean area A consequently decreases. One can also see that porosity is not a direct sign of mean pore sizes or mean distance quantitatively. However, by comparing various FF/CCs, porosity can be used to estimate trends in these parameters. In order to conclude how these morphological parameters affect transport parameters, thermal conductivity, electrical conductivity, and water permeability are calculated in all microstructures.
Transport parameters
All calculated transport parameters are presented in Table 2. In the following, they will be presented, discussed, and linked to each other. If possible, we show phenomenological equations to decrease the degrees of freedom for future macroscopic model based investigations.| FF/CC | L [10−5 m] | σ [%] | λ@20 °C [W mK−1] | λ@80 °C [W mK−1] | K [10−11 m2] |
|---|---|---|---|---|---|
| Directions | x, y, z | x, y, z | x, y, z | x, y, z | x, y |
| g82 (1 mm) | 4.3, 4.4, 2.9 | 7.3, 7.6, 0.3 | 2.4, 2.5, 1.1 | 2.4, 2.5, 1.2 | 30.6, 29.5 |
| m70 (0.5 mm) | 3.0, 2.4, 2.0 | 16.3, 12.4, 5.5 | 4.3, 3.6, 2.4 | 4.3, 3.6, 2.4 | 2.48, 1.93 |
| m69 (0.95 mm) | 2.6, 3.0, 2.0 | 13.8, 16.6, 5.6 | 3.9, 4.4, 2.4 | 3.8, 4.3, 2.5 | 2.13, 2.41 |
| m62 (0.3 mm) | 2.6, 3.0, 2.1 | 17.8, 21.2, 11.7 | 4.8, 5.4, 3.7 | 4.7, 5.3, 3.7 | 0.93, 1.15 |
| m54 (1.5 mm) | 3.3, 2.6, 2.4 | 28.8, 21.3, 17.0 | 7.0, 5.6, 5.0 | 6.9, 5.5, 4.9 | 0.64, 0.42 |
| m52 (1 mm) | 2.7, 3.4, 2.4 | 23.9, 30.1, 19.8 | 6.1, 7.3, 5.5 | 6.0, 7.1, 5.4 | 0.37, 0.52 |
| m51 (1 mm) | 3.4, 2.9, 2.6 | 30.4, 25.7, 21.5 | 7.4, 6.5, 5.8 | 7.2, 6.4, 5.7 | 0.46, 0.38 |
| s46 (1 mm) | 2.1, 2.5, 2.0 | 26.5, 29.2, 29.0 | 6.9, 7.5, 7.3 | 6.8, 7.3, 7.2 | 0.19, 0.19 |
First, electrical conductivity will be discussed and linked to mean chord length for the solid phase. Then, thermal conductivity will be discussed and linked to porosity. Finally, a relation between electrical conductivity and water permeability will be presented.
Electrical conductivity
Electrical conductivity is highly anisotropic in the three main directions of the FF/CCs, except for the s46 sample. This uniform impression was also concluded from the global and local PSD/SSDs, and is now confirmed by the resulting transport parameters.However, since the remaining samples are woven mats, one would only expect anisotropy in-plane and through-plane. But, in-plane conductivities strongly differ up to 25% for m54. The most reasonable explanation for this anisotropy is that the fibers have a main direction coming from the production process. This was checked using the concept of chord length distribution globally for the solid phase. The result is the mean chord length in the three main directions L (Table 2). For all investigated samples, we find that the largest mean chord length L is always in the direction of the highest conductivity (thermal and electrical). Additionally, the largest water permeability is in the direction of the largest mean chord length, except for s46 and g82. Since g82 consists of two different mats, we calculated the mean solid chord lengths for both subvolumes. We find that the largest mean chord length for the lower fine mat and the coarser upper mat are in different directions. This could be the reason why the largest permeability direction could not be predicted with the mean chord length.
We therefore conclude that mean chord lengths are able to predict the direction of the strongest conductivity for sintered and fibrous structures, and additionally the direction of highest water permeability for homogeneous, fibrous structures. Therefore, the simple time effective chord length distribution can help experimentalists assemble their FF/CC in the most efficient direction.
Thermal conductivity
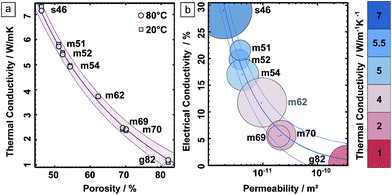
One of the main requirements of a FF/CC in PEM water electrolysis is efficient heat transport. This is especially important in case of the HyCon module as the solar cell on top of the module produces heat. Not only does the solid titanium transports heat, but also the water flooded pore space. Therefore, we solve Fourier's law for the two phases simultaneously. The explicit values are mentioned in the experimental section. The results of the calculations are shown in Fig. 5a. Here, the thermal conductivity at 20 °C is higher than for 80 °C for porosities smaller than 60%, and vice versa for porosities larger than 60%. This can be explained by the increased thermal conductivity of water at 80 °C compared to 20 °C, whereas titanium thermal conductivity decreases from 20 °C to 80 °C. The consequences of this phenomenon only impacts high porosity FF/CCs.The porosity p and two phase through-plane thermal conductivity λ, in the investigated FF/CCs, can be fitted using an exponential function at both 20 °C and 80 °C: λ20°C = 1749p−1.306 − 4.420 and λ80°C = 1338p−1.238 − 4.508.
Fig. 5a shows the data and the fit curve for the 80 °C data. The vertical width of the coloured region represents the 95% prediction bounds. This relation holds true for all investigated structures. This relation allows the estimation of thermal conductivity, for similar FF/CCs, solely from porosity.
Costs
The costs are shown in Fig. 5b as the radii of the circles. They are normalized to a price per volume (approx. 255 cm3). The costs are given relative to each other and are based on single unit prices. One can see that there are cost saving possibilities for both the well conducting/poor permeable case (m51, m52), and for the opposite case (m69). The two extreme cases (s46 and g82) are cost intensive. From these diagrams, it can be decided which FF/CC suits the desired requirements best. It can also be estimated if an increase of a certain transport parameter is worth the additional cost.Permeability
We calculated water permeability for all samples and plotted it versus the through-plane electrical conductivity. The results are depicted in Fig. 5b. The first thing to notice is that the highly porous gradient mat and the least porous sinter sample are the two extremes in this diagram. This visualizes the dilemma of porosity for water electrolysis performance: high porosity usually leads to weak electrical conductivity (gradient mat) and therefore less efficiency, whereas low porosity leads to high flow resistances (sinter) and therefore weak mass transport.1 Generally, when developing performance increasing FF/CCs, it is clear that a position in the upper right corner of the diagram would be favourable. One should note that FF/CC requirements depend on the operating conditions. In high pressure mode, for example, it is more important to have high electrical conductivity and homogenous current density at the catalytic interface, since two phase flow loses importance and less gas bubbles can evolve.4When plotting the result for the investigated FF/CCs, however, one notices an exponential relation between electrical conductivity and permeability. This relation is given by the equationσ(K) = 10−6 × K−b, where the exponent b was fitted to the data and found to be −0.6376 ± 0.0025. Astonishingly, this relation holds true even for morphologically different structures, such as sintered and fibrous structures. Therefore, it is of high importance for macroscopic simulations. Such a relation decreases the degrees of freedom in macro simulations and allows experimentalists to estimate one parameter from another.
Conclusions
An overview on transport relevant parameters for several FF/CC combinations based on X-ray tomographic reconstructions was given. According to this, the requirements of FF/CCs can be compared relatively to each other.Using this type of tomography, morphology and calculated transport parameters can be compared in a fast and reasonable way, since the reconstruction and calculation can be standardized. We used tomography to obtain morphological and transport parameters of eight current collectors also functioning as flow fields (FF/CC) for water electrolysis or related energy devices.
We show that long known concepts like chord length distribution are able to quantify distances between solids at the catalytic layer-current collector flow field interface. This parameter is connected to ohmic losses. They can also be used to quantify main directions of fibrous current collectors.
We also calculated and compared characteristic transport parameters in all microstructures, including: the thermal conductivity for 20 °C and 80 °C, electrical conductivity, and water permeability. These parameters can now be used to compare the influence of current collector parameters on water electrolysis performance in macro models.
We find relations that indicate that different requirements cannot be chosen independently. These two important relations are: an exponential relationship between porosity and two phase (water and titanium solid) thermal conductivity, and a relation of through-plane electrical conductivity and water permeability. The relations hold true for all investigated structures, even for the morphological different sintered and fibrous structures. These relations have the potential to reduce the number of degrees of freedom in macro models. In addition they can be used by experimentalists to estimate one parameter from the other.
However it must be noted that an FF/CC must fulfill more than just high water permeability and electrical conductivity. It is the interaction of multiple parameters that makes an FF/CC's performance increase. In future investigations, the X-ray tomographies of the FF/CCs can be virtually modified towards a better functionality in PEM electrolysis.
Acknowledgements
This work has been partly funded by the German Federal Ministry of Education and Research (BMBF) under the contract number FKZ 03F0432A.References
- M. Carmo, D. L. Fritz, J. Mergel and D. Stolten, Int. J. Hydrogen Energy, 2013, 38, 4901–4934 CrossRef CAS PubMed.
- S. Rau, S. Vierrath, J. Ohlmann, A. Fallisch, D. Lackner, F. Dimroth and T. Smolinka, Energy Technol., 2014, 2, 43–53 CrossRef CAS.
- G. Peharz, F. Dimroth and U. Wittstadt, Int. J. Hydrogen Energy, 2007, 32, 3248–3252 CrossRef CAS PubMed.
- S. A. Grigoriev, A. A. Kalinnikov, P. Millet, V. I. Porembsky and V. N. Fateev, J. Appl. Electrochem., 2010, 40, 921–932 CrossRef CAS.
- P. Millet, A. Ranjbari, F. de Guglielmo, S. A. Grigoriev and F. Auprêtre, HySafe 1, 2012, 37, 17478–17487 CAS.
- H. Ito, T. Maeda, A. Nakano, A. Kato and T. Yoshida, Electrochim. Acta, 2013, 100, 242–248 CrossRef CAS PubMed.
- P. Millet, D. Dragoe, S. Grigoriev, V. Fateev and C. Etievant, Int. J. Hydrogen Energy, 2009, 34, 4974–4982 CrossRef CAS PubMed.
- I. Dedigama, K. Ayers, P. R. Shearing and D. J. L. Brett, Int. J. Electrochem. Sci., 2014, 9, 2662–2681 CAS.
- M. D. Abramoff, P. J. Magalhaes and S. J. Ram, Biophotonics Int., 2004, 11, 36–43 Search PubMed.
- Nobuyuki Otsu, Trans. Syst., Man, Cybern., 1979, 9, 62–66 CrossRef.
- GeoDict, http://www.geodict.com, accessed 6 March 2014.
- M. L. V. Ramires, N. de Castro, A. Carlos, Y. Nagasaka, A. Nagashima, M. J. Assael and W. A. Wakeham, J. Phys. Chem. Ref. Data, 1995, 24, 1377–1381 CrossRef CAS PubMed.
- eFunda, Inc., eFunda, http://www.efunda.com, accessed 24 June 2014.
- MATLAB, R2013b, http://www.mathworks.de/, accessed 27 May 2014.
- J. F. Delerue, E. Perrier, Z. Y. Yu and B. Velde, Phys. Chem. Earth, 1999, 24, 639–644 CrossRef.
- S. Thiele, R. Zengerle and C. Ziegler, Nano Res., 2011, 4, 849–860 CrossRef CAS.
- S. Torquato and B. Lu, Phys. Rev. E: Stat. Phys., Plasmas, Fluids, Relat. Interdiscip. Top., 1993, 47, 2950–2953 CrossRef.
| This journal is © The Royal Society of Chemistry 2014 |

