DOI:
10.1039/C4RA12215A
(Paper)
RSC Adv., 2014,
4, 63951-63961
A biodegradable thermosensitive hydrogel with tuneable properties for mimicking three-dimensional microenvironments of stem cells†
Received
11th October 2014
, Accepted 14th November 2014
First published on 17th November 2014
Abstract
Employing stem cells in therapeutic applications strongly depends on the extracellular three-dimensional (3D) microenvironment and cell carrier properties. In this work, chitosan-g-poly(N-isopropylacrylamide) (CS-g-PNIPAAm) was synthesized as a stem cell mimicking microenvironment. The influence of various polymerization conditions, such as acid concentration, reaction temperature and monomer feed, on the grafting parameters of this thermo-responsive hydrogel, was systematically investigated. We found that the resulting copolymers with a small amount of long poly(N-isopropylacrylamide) (PNIPAAm) side chains are low-soluble at low temperatures, but can form stronger hydrogels (almost 5 folds) at high temperatures, whereas copolymers with a high amount of short PNIPAAm side chains are more soluble at low temperatures, however, they cannot form strong hydrogels at high temperatures. In a physiological pH, an optimized balance between the solubility (as the pre-requirement for cell dispersion and injectability) of copolymers at ambient temperature and enhanced gel mechanical strength (as the essential parameter of stem cell microenvironments) at body temperature can be achieved through controlled reaction conditions. Mesenchymal stem cells (MSCs) were cultured in the CS-g-PNIPAAm hydrogels. Further analysis of confocal images confirms MSCs can maintain their viability and increase the cellular biomass inside hydrogels. Sectional analysis demonstrates that cells are uniformly distributed within the hydrogels. Our results confirm that the CS-g-PNIPAAm with manipulated properties could provide a potential 3D microenvironment for stem cell culture, differentiation and in vivo injection.
1. Introduction
The remarkable potential of stem cells in clinical applications is being increasingly revealed. However, the success in their biomedical applications highly depends on the creation of a microenvironment to provide chemical, mechanical and topological cues inside a 3D architecture in a precisely controlled, temporal and spatial manner, which are essential for regulating stem cell proliferation, differentiation and migration.1 The microenvironment is often realised through the elegant design of biomaterials. Among different types of biomaterials, hydrogels are more appealing than conventional porous scaffolds. Highly hydrated polymeric networks of hydrogels result in a soft and elastic 3D structure which could resemble natural living tissues, especially soft tissues.2 In addition, hydrogels are great materials for efficient entrapment of viable cells.3 They can facilitate sufficient nutrient and oxygen transport, and metabolic waste removal. They usually show excellent biocompatibility as well as great potential to be easily modified with cell adhesion ligands.4 Furthermore, their low interfacial tension and minimal mechanical and frictional irritations5 make them a superb choice for 3D cell culture. Hydrogels can also be tailored to meet the requirements of stem cell microenvironment by adjusting physio-chemical and mechanical properties.
Living systems contain macromolecules such as polysaccharides and proteins which respond to their environment in a non-linear manner and undergo a drastic change around a given critical point. Therefore, stimuli-responsive hydrogels that can respond to external stimuli, such as temperature, pH, ionic strength, light, magnetism, electrical or mechanical stimulus in a controllable and predictable manner, are considered as biomimetic systems.6–8
Thermosensitive hydrogels are such biomimetic polymers. These polymers can be prepared as a solution or cross-linked network. The solution (or cross-linked swollen) form of these polymers can be converted to hydrogels (or shrunken hydrogels) by temperature change.9 The solution form of the copolymer can show a reversible or irreversible thermo-responsive sol–gel transition behaviour. For most applications, a good solubility at room temperature and neutral pH, and tuneable mechanical strength at physiological temperature are required. Good solubility can facilitate effective cell dispersion inside the polymer solution which leads to a homogeneous cell distribution within the hydrogel to form a uniform product. In addition, when the injectability of cell/polymer is desired, the cell-laden hydrogel solution can be administered to fill any shape of a defect site in a minimally invasive manner and then converted into hydrogels to retain cells inside the 3D hydrogel constructs.3,10–13 The hydrogels with reversibility in their sol–gel transition behaviour are also suitable for 3D cell culture to acquire a sufficient number of cells while preserving their cellular functions and phenotype in a 3D microenvironment. Cell harvest can be simply achieved by liquifying the gel at a low temperature and no enzyme such as trypsin to detach the adherent cells is required. In this way, cells can be detached without trypsinization which may inversely affect cell functionality.14,15 On the other hand, tuneable mechanical properties of the gel could provide a competent tool to regulate stem cell fate.
Chitosan-based thermosensitive hydrogels have a great potential to construct a biomimetic microenvironment. Chitosan (CS) is a linear polysaccharide composed of β(1,4)-linked glucosamine and N-acetyl glucosamine subunits.16 It has excellent biocompatibility, tuneable biodegradability and cell adhesion ability,17,18 antimicrobial19,20 and wound healing21 properties. In addition, the chitosan structure is quite similar to some extracellular matrix components such as glycosaminoglycans (GAGs). Therefore, chitosan was extensively chosen as the backbone for cell support. As a thermosensitive moiety, PNIPAAm could be introduced to the chitosan via a variety of chemical approaches. PNIPAAm undergoes a reversible phase transition in an aqueous solution at a temperature called “lower critical solution temperature (LCST)”. The LCST of PNIPAAm is around 31 °C which is close to the body temperature. This fact has made PNIPAAm as one of the most studied thermoresponsive polymers. The simple structure of PNIPAAm which does not contain functional groups to interact with other biomolecules has limited its applications.22 Therefore, it is usually utilized in conjunction with other moieties to improve its functionalities.
PNIPAAm has been introduced to chitosan by different research groups in various ways, including interpenetrating polymer networks (IPN),23,24 semi-IPN,24,25 surface grafted membranes,26 chemically cross-linked hydrogels in forms of discs,27–29 films,29,30 nanoparticles31–35 and solutions.36–41 However, to the best of our knowledge, there is no systematic investigation on polymerization conditions which can regulate the key features (solubility and mechanical strength) of this copolymer as a sol–gel thermoreversible hydrogel. Rheological behaviour of the copolymer at physiological pH and its correlation to grafting parameters need to be addressed. Moreover, few biological applications within a 3D CS-g-PNIPAAm hydrogel have been studied.
In this study, chitosan-g-poly(N-isopropylacrylamide) was synthesized through free radical graft polymerization. We investigated essential physical and mechanical properties of this copolymer for intended biomedical applications which can be precisely manipulated by polymerization conditions. Biomimetic microenvironments were created from the resulting hydrogel. Viability, proliferation, distribution and morphology of mesenchymal stem cells were also evaluated.
2. Materials and methods
2.1. Materials
N-Isopropylacrylamide (NIPAAm, 97%, Sigma-Aldrich) was purified by recrystallization in n-hexane. Ammonium cerium(IV) nitrate (CAN) and chitosan (MW of 200–300 kDa) were purchased from Acros Organic (New Jersey). Dulbecco's Modified Eagle's Medium (DMEM), trypsin–EDTA, penicillin–streptomycin and fetal bovine serum (FBS) were from Gibco-BRL (Grand Island). 3-(4,5-Dimethylthiazol-2-yl)-2,5-diphenyltetrazolium bromide (MTT), Live/Dead® viability/cytotoxicity kit (L3224) and Press-to-Seal™ silicone isolators (P24741) were ordered from Molecular Probes (Oregon). All other chemicals not mentioned were of analytical grades and used directly without further purification.
2.2. Methods
2.2.1. Synthesis of chitosan-g-PNIPAAm. Chitosan-g-PNIPAAm was synthesized by free radical grafting polymerization. In detail, chitosan was dissolved in 30 mL aqueous acetic acid to make a 1 wt% solution. 2.0 g purified NIPAAm monomer was dissolved in 10 mL Milli-Q water, and then mixed with the above chitosan solution in a three-neck flask fitted with a condenser and gas inlet/outlet. The mixed solution was bubbled with nitrogen for 30 min, and 3 mL CAN solution was injected into the flask to initiate polymerization. The reaction was carried out for 24 h under nitrogen atmosphere.After polymerization, the solution was condensed and precipitated in an excess amount of THF–hexane (4
:
1). The crude products were obtained by centrifugation and dried under vacuum at room temperature. The polymer was further purified by methanol Soxhlet extraction for 48 h to remove PNIPAAm homopolymer and other reaction residues. The purified product was dried under vacuum. Grafting ratio (GR) and percentage of homopolymerization (PoH) were calculated using eqn (1) and (2):
|
 | (1) |
|
 | (2) |
where
W1,
W2,
W3 and
W4 are the weights of initial chitosan loaded, PNIPAAm grafted chitosan after Soxhlet extraction, NIPAAm monomer feed and the crude product of grafted chitosan with NIPAAm before Soxhlet extraction, respectively.
2.2.2. Conductometric and potentiometric titration. The amount of free amino groups on chitosan before and after grafting polymerization was quantified by conductometric and potentiometric titration. Typically, a solution of 35 mg copolymer in 70 mL Milli-Q water was prepared and a small amount of HCl was added to adjust pH to 3.5. The solution was then back-titrated using a 0.1 M NaOH. After each addition, the conductivity and pH were measured using a H18733 conductivity meter (Hana Instrument, USA) and a pre-calibrated pH/mV meter (smartCHEM-pH, TPS Australia). The degree of substitution (DS%) was calculated according to eqn (3): |
 | (3) |
2.2.3. FTIR spectroscopy. The dry powders of grafting copolymers and chitosan were examined using Fourier Transformed Infrared (FTIR), where the spectra were recorded over a wave number range of 600–3000 cm−1 using a Nicolet 6700 FTIR spectrometer (Thermo Electron, USA) at room temperature.
2.2.4. Rheological characterization. The rheological properties of concentrated copolymer solutions were investigated using a SR5 controlled stress rheometer (Rheometric Scientific, USA) equipped with a cone and plate geometry fixture (diameter: 40 mm; actual gap: 0.0483 mm; actual angle: 0.0398 rad). Experimental temperature was controlled by a Peltier system connected to a water bath, and silicone oil was used to prevent solvent evaporation. Grafting copolymer solutions were prepared in phosphate buffered saline (PBS, pH ∼ 7.4). Stress sweeps were first performed to determine linear viscoelastic regions for each sample. Within the linear viscoelastic regime and under a fixed stress and frequency, the storage (G′) and loss (G′′) modules were measured over a temperature range of 25 to 45 °C.
2.2.5. Solubility. To investigate the solubility of grafting copolymers, 0.44 mg mL−1 solutions of copolymers in 0.2 wt% acetic acid were first prepared. A small amount of 2.5 M NaOH was used to adjust pH while recording their absorbance as a function of pH at 600 nm using a UV-1601 UV/Vis spectrophotometer (Shimadzu, Japan).
2.2.6. Hydrogel morphology. A hydrogel prepared from 35 mg mL−1 of the copolymer in PBS at 37 °C was instantly immersed in liquid nitrogen and then dried in a ALPHA 1-2LD plus freeze-dryer (CHRIST, Germany) for 48 h. The dried samples were gold coated and their morphologies were observed by a Philips XL 30 FEG scanning electron microscope (SEM) (FEI, USA).
2.2.7. Cell culture. A stem cell line, murine embryonic mesenchymal progenitor cell (C3H/10T1/2) from Riken Cell Bank (Japan), was cultured in DMEM supplemented with 10% FBS, 100 U mL−1 of penicillin, 100 mg mL−1 of streptomycin and 2 mM L−1 L-glutamine. The cells were incubated at 37 °C in a humidified atmosphere in the presence of 5% CO2.
2.2.8. 3D cell culture. MSCs were trypsinized from flasks and resuspended in a fresh culture medium. A polymer solution (CS–NI-2) of 31.5 mg mL−1 in PBS was prepared (pH of 7.4) and sterilized by autoclave. Cell suspension and copolymer solution were mixed to prepare a mixture of cell and polymer at a cell concentration of 1.0 × 10⁶ cells per mL and a final polymer concentration of 30 mg mL−1. 0.5 mL of the cell–polymer mixture was transferred to each well on a 24-well plate and incubated for 1 h at 37 °C to form mixed hydrogels. The same cell concentrations were prepared by mixing cells and PBS without copolymer as a control. 2.0 mL of fresh growth medium was topped up to each well and kept in a humidified incubator at 37 °C and 5% CO2. Medium was replaced with fresh medium once every other day.
2.2.9. MTT assay. Cell viability and proliferation inside the mixed hydrogels were examined using the MTT assay. At each time point, 0.5 mL of MTT (5 mg mL−1 in PBS) was added to each well, including both test and control, and then incubated for 4 h at 37 °C. All the liquid was removed from the top of the hydrogels and 1 mL dimethyl sulfoxide (DMSO) was added to each well to ensure complete solubilization of formazan crystals. After 1 h further incubation, all of the well content was transferred to an eppendorf tube, vortexed briefly and centrifuged at 10
000 rpm for 5 min. Finally, 200 μL of supernatant were transferred to a 96-well plate and the absorbance was read using a microplate reader (ELx808, BioTek, USA) at 595 nm. Triplicates of every time point were used.
2.2.10. Confocal laser scanning microscopy. Live/dead cytotoxicity/viability kit was used to stain live and dead cells. 1 μM of acetomethoxy derivate of calcein (calcein AM) and 2.5 μM of ethidium homodimer-1 (EthD-1) working solutions were prepared freshly according to the manufacturer's protocol. At days 1 and 7, the growth medium was removed and mixed hydrogels were washed with 1.0 mL prewarmed PBS (37 °C). The PBS was replaced with 1.0 mL of fresh prewarmed PBS and left in the incubator at 37 °C. The liquid was replaced with 2 mL of dye working solution and further incubated at 37 °C for 45 min. The dye solution was removed and hydrogel was washed twice with 1.0 mL prewarmed PBS. All the liquid was removed and hydrogel was then transferred carefully to a chamber made from coverslips and Press-to-Seal™ silicone isolators. To make the 3D structure more stable and to prevent dissolution, the extra liquid was absorbed from the hydrogel by gently touching its surface with a piece of tissue paper so that the gel got highly concentrated (semi-dried). The cultured cells in the hydrogels were observed under a Leica SP5 spectral scanning confocal microscope (Leica Microsystems, Germany) equipped with a temperature controlled stage to keep the thermosensitive hydrogels at 37 °C. Excitation wavelengths were set to 494 and 528 nm and emission wavelengths were at 517 and 617 nm for live (green) and dead (red) cells, respectively.
3. Results and discussion
3.1. Synthesis and characterization of chitosan-g-PNIPAAm
Chitosan-g-PNIPAAm copolymers were synthesized in various reaction conditions, as detailed in Table 1. Chitosan is a natural biodegradable and biocompatible polymer, which is a promising material in biomedical applications. In order to make chitosan thermosensitive as well as more soluble at physiological pH 7.4, we introduced the thermosensitive moieties of poly(N-isopropylacrylamide) to chitosan backbone through graft copolymerization. The schematic of synthesis outline is shown in Scheme 1. The success of graft copolymerization was confirmed by the characteristic bands of NIPAAm in the FTIR spectra of copolymer (ESI†), where the peaks at 2970 and 1456 cm−1 correspond to the C–H stretching and CH3 bending deformation. In addition, the peak at 1385 cm−1 can be assigned to the methyl in isopropyl groups. Absorption bands of amide I and amide II are strengthened at 1626 and 1529 cm−1, respectively, while the weak bands at 1586 cm−1 are attributed to –NH2 scissoring of chitosan.
Table 1 Reaction optimization for the graft polymerization of NIPAAm onto chitosana
Sample name |
CAN (mmol) |
Acetic acid (wt%) |
Temperature (°C) |
All reactions were carried out for 24 h. Chitosan free amino groups and NIPAAm monomer were 1.6 and 17.7 mmol in feed. |
CS–NI-1 |
0.09 |
10 |
25 |
CS–NI-2 |
0.18 |
10 |
25 |
CS–NI-3 |
0.27 |
10 |
25 |
CS–NI-4 |
0.36 |
10 |
25 |
CS–NI-5 |
0.18 |
5 |
25 |
CS–NI-6 |
0.18 |
15 |
25 |
CS–NI-7 |
0.18 |
20 |
25 |
CS–NI-8 |
0.18 |
10 |
32 |
CS–NI-9 |
0.18 |
10 |
45 |
CS–NI-10 |
0.18 |
10 |
60 |
 |
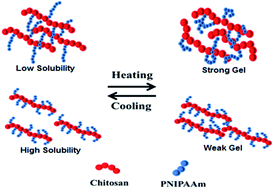
| Scheme 1 (a) Outline of the synthesis of chitosan-g-PNIPAAm; (b) schematic description on solubility and gelation behaviour of chitosan-g-PNIPAAm: copolymers with long side chains are viscous and less-soluble at low temperatures, but can form strong hydrogels at high temperatures, whereas copolymers with short side chains are more soluble at low temperatures. However, they cannot form strong hydrogels at high temperatures. | |
Grafting and homopolymerization parameters were determined by gravimetric, potentiometric and conductometric measurements as summarized in Fig. 1 and Table 2, where the amount of un-grafted amino groups along chitosan backbone was measured from potentiometric and conductometric titrations (ESI†). For the titration of chitosan and chitosan-g-PNIPAAm, a slight excess of HCl was added to ensure the complete protonation of all amino groups. After gradual addition of alkali, the conductivity first decreases rapidly (descending leg) as the excess HCl is neutralized. After a transition point, a buffering zone is observed. In this buffering range, the conductivity increases slowly with the alkali addition, as a consequence of the neutralization of the protonated free amino groups. Therefore, this range can be used for the quantification of the PNIPAAm side chains on chitosan backbone as they have substituted amino groups on chitosan.39 A narrower buffering zone corresponds to the less availability of free –NH2 groups and more grafts on chitosan. After the second transition point, the conductivity increases (ascending leg), indicating the introduction of excess NaOH. Similar steps are distinguishable in potentiometric titration curves. The degrees of substitution were calculated for each sample from the values of reacted and un-reacted functional groups (free amino groups in this case) using eqn (3).14,39 The mechanisms for initiation, propagation and termination of grafting polymerization are as follows:
 |
| Fig. 1 Effect of reaction parameters on grafting properties of chitosan-g-NIPAAM, where filled squares indicate GR% and open circles show the DS%. (a) Initiator concentration [acid concentration: 10 wt%; reaction temperature: 25 °C and reaction time: 24 h]; (b) reaction temperature [initiator concentration: 0.1 mg; acid concentration: 10 wt% and reaction time: 24 h]; and (c) acetic acid concentration [initiator concentration: 0.1 mg; reaction temperature: 25 °C and reaction time: 24 h]. | |
Table 2 Summary of products synthesized at different reaction conditions
Parameter |
Sample name |
Percentage of homo-polymerizationa (%) |
Yielda (%) |
Gelationb |
Calculated from gravimetric measurements and eqn (1). Visually verified (Yes: gelation occurs with temperature rise, No: no gelation with temperature rise). |
Acid concentration |
CS–NI-5 |
6 |
20 |
No |
CS–NI-2 |
27 |
61 |
Yes |
CS–NI-6 |
27 |
66 |
Yes |
CS–NI-7 |
28 |
73 |
Yes |
CS–NI-2 |
27 |
61 |
Yes |
Temperature |
CS–NI-8 |
44 |
71 |
Yes |
CS–NI-9 |
40 |
65 |
Yes |
CS–NI-10 |
30 |
56 |
Yes |
Initiator concentration |
CS–NI-1 |
9 |
20 |
No |
CS–NI-2 |
27 |
61 |
Yes |
CS–NI-3 |
43 |
78 |
Yes |
CS–NI-4 |
80 |
96 |
Yes |
Initiation:
|
CS + Ce4+ ↔ Complex → CS˙ + Ce3+ + H+
| (4) |
|
M + Ce4+ → M˙ + Ce3+ + H+
| (5) |
Propagation:
Termination:
|
CSM˙n + CSM˙m → CSMn − CSMm
| (11) |
|
CSM˙n+Ce4+ → CSMn + Ce3+ + H+
| (12) |
|
M˙n + Ce4+ → Mn + Ce3+ + H+
| (13) |
|
CSM˙n + M → CSMn + M˙
| (14) |
|
CSM˙n + P → CSMn + P˙
| (15) |
where CS, M, Ce and P represent chitosan, NIPAAm monomer, ceric ion and propagating polymers, respectively.
3.1.1. Effect of initiator concentration. Based on eqn (4), (6) and (7), it is expected that grafting ratio and degree of substitution increase by increasing initiator concentration. To investigate the influence of initiator feed on grafting parameters, a range of polymerizations at various CAN concentrations from 0.09 to 0.36 mmol has been carried out. The results are shown in Fig. 1a and Table 2. The degree of substitution increases continuously with increasing the amount of CAN initiator. It is expected that the more the initiator is fed, the more the free radical can be formed on chitosan backbone, leading to more side graft chains (eqn (4) and (6)). At a low concentration of initiator (0.09 mmol), no grafting occurs and only the homopolymerization of NIPAAm is found. The grafting ratio increases with the increment of initiator concentration up to 0.18 mmol. On the other hand, the percentage of homopolymer is increased simultaneously. Beyond this concentration, a further increase in CAN lead to a slight drop in grafting ratios. That could be due to the increase in formation of free radicals on chitosan, leading to more termination reactions by coupling these radicals according to eqn (9), (11), (12), (14) and (15),36,42,43 while homopolymerization increment is continued as a competitor reaction (eqn (5) and (8)). Similar experimental trend has also been observed by Lee et al.36
3.1.2. Effect of reaction temperature. Effect of reaction temperature on polymerization parameters was investigated between 25 to 60 °C. As shown in Fig. 1b and Table 2, the grafting ratio gradually decreases, but the degree of substitution drastically increases with the increase of temperature. In addition, it is observed that the percentage of homopolymerization increases with the increment of temperature below the LCST, while it decreases when temperature keeps rising above the LCST. At a low temperature below the LCST of PNIPAAm, the initiator is less active and therefore offers less free radicals on chitosan amino groups and in solution. However, the fully homogeneous system allows monomers to access to and react with these free radicals easily. As a result, less grafts are found on the backbone, while their chain lengths are long. By increasing the temperature, the initiator is more active, leading to more substitutions and homopolymers. However, the increased rate of termination reduces the grafting ratio. When the temperature is close or over the LCST, thermo-reversible phase transition of grafted chains and homopolymers occurs. The solution turns from a water-soluble hydrophilic state to a water-insoluble hydrophobic state. Thus, the system is likely heterogeneous which ultimately affects the penetration and diffusion of NIPAAm monomers into the active sites on the chitosan and homopolymer radicals.43 Therefore, more substitution and less grafting ratio on chitosan backbone together with low percentage of homopolymer are expected.
3.1.3. Effect of acetic acid concentration. During the synthesis, it is also found that the amount of acetic acid applied to prepare chitosan aqueous solution in the reaction system has significant effect on grafting parameters. Therefore, this effect was systematically studied at different acetic acid concentrations ranging from 5 to 20 wt% with experimental results shown in Fig. 1c and Table 2.Initially, an increase in acetic acid concentration from 5 to 10 wt% results in increasing both the grafted and homopolymerized NIPAAm. The degree of substitution shows a significant drop over this acid concentration range. By further increasing acetic acid concentration, no significant effect on grafting parameters is observed. At low H+ concentrations, a high degree of substitution and a low grafting ratio suggest more grafts with shorter chain lengths. It is attributed to the initiation equations of 4 and 5, which are more favorable at low H+ concentrations.42 At a higher acid concentration, high H+ concentration leads to less initiation and subsequently less growing chains on chitosan backbone. Simultaneously, termination reactions get less favorable (eqn (12) and (13)), which promote longer chain formation.
3.2. Solubility
Although the solubility of an injectable hydrogel is an important parameter, no comprehensive study has been reported on the solubility of chitosan-g-PNIPAAm yet. The solubility of various copolymers was investigated by measuring the turbidity of polymer solutions against pH. Fig. 2 demonstrates the pH-responsiveness of the grafting copolymers in comparison with chitosan. At low pH, all samples showed no significant change in their solubilities. However, the turbidity of each solution dropped dramatically at a certain pH, which indicates phase separation.
 |
| Fig. 2 Solubility of chitosan and various chitosan-g-PNIPAAm samples at different pHs as measured by the turbidity of 0.44 mg mL−1 polymer solutions at 600 nm. | |
The plot reveals that by increasing the initiator concentration from 0.18 mmol for CS–NI-2 to 0.36 mmol for CS–NI-4, the pH-solubility profile is extended and the precipitation points elevate from pH ≈ 5.2 to pH ≈ 6.5. The solubility of chitosan in aqueous solution is governed by two main factors: protonation of free amino groups which results in interruption of intermolecular hydrogen bonds and hence improves solubility; and inter-chain crystallinity which reduces the solubility. An increase in the initiator leads to a higher degree of substitution and results in less free amino groups along chitosan backbone (see Section 3.1.1). As a result, the remaining amino groups need less protons for protonation, which could be provided at higher pHs. Moreover, these grafts can destroy the crystallinity and further improve water solubility.
Reducing the acetic acid concentration in the reaction solution for CS–NI-5 (5 wt%) results in a broader solubility window with an onset at pH ≈ 6.1 in comparison with CS–NI-2 (10 wt%), which is due to its higher degree of substitution (see Section 3.1.3).
Precipitation at higher pHs was observed for the CS–NI-8 synthesized at 32 °C compared to CS–NI-2 (prepared at 25 °C), which is in agreement with its higher graft numbers (see Section 3.1.2). A decrease in turbidity of the stable phase (low pH) might be attributed to the non-homogeneous reaction condition that the polymerization temperature is close to the LCST of PNIPAAm. More growing side chains on the chitosan backbones result in higher chance of self-crosslinking.
3.3. Rheological measurements
Mechanical properties of stem cells niche are known to modulate their fates along with the chemical and biophysical properties of the microenvironment. Cell mechano-sensitive pathways translate these cues into biochemical signals that guide the cell to a specific lineage or behaviour.44–46 Therefore, it is extremely important to control the mechanical properties such as elasticity when designing a biomaterial to mimic the 3D microenvironment for stem cells.
To investigate the viscoelastic characteristics of chitosan-g-PNIPAAm solution at different temperatures before and after gelation, we have conducted dynamic mechanical analysis. At low temperatures (20–30 °C), loss modulus (G′′) dominates the flow property and the value of storage modulus (G′) is too small to be accurately measured, as shown in Fig. 3b. This corresponds to the solution state of the samples. In this temperature range, the loss modulus decreases slightly with an increase in the temperature due to thermal movement of polymer chains leading to a lower viscosity (Arrhenius model). Beyond this temperature range, a sharp increase in both G′ and G′′ is observed and after a cross-over between two lines, storage modulus, G′, starts to become higher than loss modulus, G′′, indicating the formation of hydrogel (Fig. 3b), which is evidenced by Fig. 3a. The cross-over between G′ and G′′ lines is considered as the gelation point and the corresponding temperature is termed as the gelation temperature (Tgel) which is close to the LCST of the copolymer.
 |
| Fig. 3 (a) Phase transition of chitosan-g-PNIPAAm upon heating and cooling; (b–d) dynamic temperature sweeps of 36 mg mL−1 of chitosan-g-PNIPAAm copolymers in PBS (pH = 7.4) at 1 rad s−1. | |
Storage modulus which represent the mechanical strength of gels are 155 and 52 Pa at 37 °C for CS–NI-2 and CS–NI-4, respectively (Fig. 3b and d). The drop could be explained by less degree of substitution and higher grafting ratio of CS–NI-2 in comparison to CS–NI-4 as a consequence of increasing initiator concentration (Fig. 1a). It means longer side chain lengths on chitosan backbone in CS–NI-2 could improve polymer chain entanglements and hence make the gels stronger.
Sample CS–NI-5 synthesized in 5 wt% acid does not show a phase transition with rise in temperature (Table 2). However, CS–NI-2 synthesized at 10 wt% acid undergoes a sol–gel transition and forms a relatively strong gel. It happens due to the very low grafting ratio and high degree of substitution (Fig. 1c), which results in very short side chain lengths in CS–NI-5.
An increment in reaction temperature from 25 °C (CS–NI-2) to 32 °C (CS–NI-8) results in the decrease in gel mechanical strength from 155 Pa to 30 Pa at 37 °C (Fig. 3b and c). GR and DS in Fig. 1b can be used to explain the decrease of mechanical strength. Increasing the reaction temperature makes more, but shorter PNIPAAm side chains on chitosan and consequencely gels are weaker.
To examine the reversibility of the sol–gel transition behaviour, several cycles of stepwise temperature change between 25 and 37 °C were applied and the mechanical modulus were monitored. As shown in Fig. 4, the copolymer reveals a thermo-reversible behaviour. However, the storage modulus slightly decreases over cycles. After cooling the hydrogel, without any stirring, the solution is not a homogeneous liquid as it was before the first gelation. Therefore, when the solution is warmed up again, the structure could not regain a uniform network of hydrogel, resulting in a weaker hydrogel at further cycles.
 |
| Fig. 4 Storage and loss moduli of CS–NI-2 in stepwise periodic changes of temperature between 25 and 37 °C at 1 rad s−1. | |
3.4. Morphological studies
The microstructure of the hydrogel was studied using a scanning electron microscopy. Fig. 5 presents the SEM micrographs of the hydrogel cross-sections. These images demonstrate the interconnected porous structure of the hydrogel which provides adequate space for nutrient delivery to cells and waste removal from their microenvironment as well as supports cell proliferation and migration.
 |
| Fig. 5 SEM micrograph of (a) chitosan-g-PNIPAAM (CS–NI-2) hydrogel and (b) the enlarged section of marked area in (a). | |
3.5. In vitro three-dimensional cell culture
To investigate the interactions between MSCs and the hydrogel microenvironment, the MTT assays were employed. Cell viability was monitored over a 14 day period. Fig. 6 shows the optical densities obtained from the MTT assays, which represent the number of viable cells. The results reveal that cells retain their biological activities and gradually proliferate inside the hydrogel during the first 7 days of cultivation, and after that, the cell number ceases to increase. However, cells remain metabolically active at day 14 as evidenced by the optical density, which is nearly the same as day 7. When cells are cultured in a 3D microenvironment, the cell viability and metabolic activity depend on several parameters including cell type, cell-seeding density and the surrounding material. Cardiac cells showed a constant number of viable cells within alginate hydrogel regardless of seeding density while proliferated significantly on 2D culture dishes.47 The same trend has been reported for the viability of osteoblasts encapsulated in Arg–Gly–Asp (RGD)-modified poly (ethylene glycol) hydrogels.48 Hepatocytes entrapped in alginate scaffolds lost 66% of their metabolic activity within 7 days when seeded at the cell density of 0.28 × 10⁶ cells per cm3 scaffold. However, they maintained their viability when cultured at an initial seeding density of 18.2 × 10⁶ cells per cm3 after a 25% decrease within the first 24 h.49 MSC metabolic activity decreased up to day 3 when cultured within chitosan/alginate polyelectrolyte complex-based scaffolds and then showed a slight increase until day 14.50 In comparison with 2D cell culture, the number of MSCs is less in the 3D chitosan-g-PNIPAAm hydrogel. However, cell proliferation is observed from Fig. 6 and the cellular biomass reaches a plateau after 7 days. The dynamic balance of cell number inside the hydrogel is due to insufficient oxygen and nutrient supplied to cells and lack of space when a certain cell density is reached. The cell survival is significantly improved through manipulation of hydrogel properties, while the decreased cell viability of osteoblasts36 and MSCs37 have been reported when cells were cultured within the same hydrogel without manipulation. The retaining of cell viability is essential for downstream processing steps. For example, in the in vivo injection of cell-laden hydrogels to cure tissue damages, cells must be able to survive in human body environment so that cells can play their therapeutic roles. In tissue engineering applications using stem cells and hydrogels, cells need to keep viable during cell differentiation process. The preliminary results have demonstrated that the synthesized chitosan-g-PNIPAAm hydrogel with manipulated properties can support cell proliferation and retain cell viability for up to 14 days.
 |
| Fig. 6 MSCs proliferation cultured in chitosan-g-PNIPAAm (CS–NI-2) hydrogels (red bars) and monolayers (green bars) measured by MTT assays. (n = 3, mean ± SE). | |
Fig. 7 shows confocal laser scanning images of cells inside the hydrogel. Live and dead cells were stained in green and red, respectively. An increase in green intensity from day 1 (a–c) to day 7 (d–f) corresponds to cell number increment and also cell spread morphology. It verifies cell viability and proliferation during the seven-day period. However, the higher green intensity is not just implied by cell number. It is also partially due to cells' elongation and even some aggregations.48 These results are consistent with the MTT values. At day 1, more dead cells (red spots) could be observed in comparison with day 7 and the cell death at day 1 may be explained as a consequence of the first shock when cells adapt them with a new culture microenvironment. In order to determine cell distribution inside the hydrogel, images were taken at the different heights of 40, 80 and 120 μm above the bottom of the microwell plate, and images c & f, b & e and a & d (in Fig. 7) were corresponding to three scans respectively. The images demonstrate that cells retained their viability and well distributed within the hydrogel, all through the different depths of the hydrogel inside the microwell, not on the top of the gel or at the bottom of the wells. Cell morphology at day 1 (Fig. 7g) and day 7 (Fig. 7h) can be observed from high-magnification (60×) images. Cells appear to be in a round shape at day 1 (Fig. 7g), when there are still not strong cell–matrix interactions. In contrast, at day 7, cells lose their spherical shape and change to a spread or elongated structure in a 3D manner. This change might be due to cellular adaptation to the porous and interconnected microenvironment which encourages cells to attach to the surface of the pores and conform to the shape of the available lacuna. Cells start to grow and remain close to each other to impart cell–cell interactions. They overlap inside the pore structure and individual cells are not easily distinguishable. However, spherical individual cells can be observed to be resuspended in the solution when the hydrogel converts to solution after reducing the temperature to an ambient one, which is shown in Fig. 7i. The recovered cells can be re-cultured onto the 2D rigid surface, which means the cells are viable and can retain their migration capacity as well.
 |
| Fig. 7 Confocal laser scanning images of MSCs cultured in chitosan-g-PNIPAAm (CS–NI-2) hydrogels: (a–f): Comparison on cell densities at day 1 (a–c) and day 7 (d–f). Images were taken at different distances ((a and d) = 120 μm; (b and e) = 80 μm and (c and f) = 40 μm) from the bottom of the samples. 10× oil immersion objective. Scale bars are 250 μm. (g and h): Z-series of images captured at high magnification (63× oil immersion objective) and converted to 3D images using the Volocity™ software, at day 1 (g) and 7 (h). Scale bars are 16 μm. (i): Harvested cells after melting down the mixed hydrogels at day 7. 20× oil immersion objective. Scale bar is 100 μm. | |
4. Conclusions
In this study, chitosan-g-poly(N-isopropylacrylamide) was synthesized as a thermo-responsive hydrogel. The synthesized polymer showed a thermo-reversible sol–gel transition behaviour at around 32 °C. It has been demonstrated that the solubility of copolymer aqueous solutions and mechanical strength of their gels could be manipulated by the number and length of PNIPAAm grafts which have been substituted with free amino groups on chitosan backbone. To control the graft ratio and chain length, the effect of polymerization conditions, including acid concentration, reaction temperature and initiator concentration on the degree of substitution and grafting ratio have been systematically investigated. SEM observations revealed the porous structure of the hydrogel which can facilitate oxygen and nutrient delivery to cells and cell growth. Mesenchymal stem cells were cultured in CS-g-PNIPAAm hydrogels. Cell viability and proliferation were evaluated by the MTT assay. It was demonstrated that cells retained their biological activities. Confocal images confirmed the cell viability and proliferation and uniform distribution inside the hydrogel while their phenotypic morphology was preserved. These results reinforce the suitability of chitosan-g-poly(N-isopropylacrylamide) copolymer as a well-controlled microenvironment for cells, especially stem cells and its potential applications in 3D cell culture, tissue engineering and regenerative medicine.
Acknowledgements
AM would like to acknowledge the Adelaide Scholarship International of The University of Adelaide. HZ thanks The MAWA Trust and the 111 Project (B12034).
References
- H. Zhang, S. Dai, J. Bi and K. K. Liu, Interface Focus, 2011, 1, 792–803 CrossRef PubMed.
- S. Van Vlierberghe, P. Dubruel and E. Schacht, Biomacromolecules, 2011, 12, 1387–1408 CrossRef CAS PubMed.
- J. L. Drury and D. J. Mooney, Biomaterials, 2003, 24, 4337–4351 CrossRef CAS.
- A. S. Hoffman, Adv. Drug Delivery Rev., 2002, 54, 3–12 CrossRef CAS.
- B. Baroli, J. Pharm. Sci., 2007, 96, 2197–2223 CrossRef CAS PubMed.
- F. Liu and M. W. Urban, Prog. Polym. Sci., 2010, 35, 3–23 CrossRef CAS PubMed.
- J. F. Mano, Adv. Eng. Mater., 2008, 10, 515–527 CrossRef CAS.
- C. D. L. H. Alarcon, S. Pennadam and C. Alexander, Chem. Soc. Rev., 2005, 34, 276–285 RSC.
- L. Klouda and A. G. Mikos, Eur. J. Pharm. Biopharm., 2008, 68, 34–45 CrossRef CAS PubMed.
- L. Yu and J. Ding, Chem. Soc. Rev., 2008, 37, 1473–1481 RSC.
- B. Jeong, S. W. Kim and Y. H. Bae, Adv. Drug Delivery Rev., 2012, 54, 37–51 CrossRef.
- N. E. Fedorovich, J. Alblas, J. R. de Wijn, W. E. Hennink, A. J. Verbout and W. J. Dhert, Tissue Eng., 2007, 13, 1905–1925 CrossRef CAS PubMed.
- A. Gutowska, B. Jeong and M. Jasionowski, Anat. Rec., 2001, 263, 342–349 CrossRef CAS PubMed.
- Z. Shen, J. Bi, B. Shi, D. Nguyen, C. J. Xian, H. Zhang and S. Dai, Soft Matter, 2012, 8, 7250–7257 RSC.
- Z. Shen, A. Mellati, J. Bi, H. Zhang and S. Dai, RSC Adv., 2014, 4, 29146–29156 RSC.
- A. Di Martino, M. Sittinger and M. V. Risbud, Biomaterials, 2005, 26, 5983–5990 CrossRef CAS PubMed.
- S. Hirano, H. Tsuchida and N. Nagao, Biomaterials, 1989, 10, 574–576 CrossRef CAS.
- T. Freier, H. S. Koh, K. Kazazian and M. S. Shoichet, Biomaterials, 2005, 26, 5872–5878 CrossRef CAS PubMed.
- E. I. Rabea, M. E.-T. Badawy, C. V. Stevens, G. Smagghe and W. Steurbaut, Biomacromolecules, 2003, 4, 1457–1465 CrossRef CAS PubMed.
- L. Y. Zheng and J. F. Zhu, Carbohydr. Polym., 2003, 54, 527–530 CrossRef CAS PubMed.
- H. Ueno, T. Mori and T. Fujinaga, Adv. Drug Delivery Rev., 2001, 52, 105–115 CrossRef CAS.
- Z. M. Rzaev, S. Dincer and E. Pişkin, Prog. Polym. Sci., 2007, 32, 534–595 CrossRef CAS PubMed.
- S. Y. Kim, S. M. Cho, Y. M. Lee and S. J. Kim, J. Appl. Polym. Sci., 2000, 78, 1381–1391 CrossRef CAS.
- W. F. Lee and Y. J. Chen, J. Appl. Polym. Sci., 2001, 82, 2487–2496 CrossRef CAS.
- X. Chen, H. Song, T. Fang, J. Bai, J. Xiong and H. Ying, J. Appl. Polym. Sci., 2010, 116, 1342–1347 CAS.
- R. M. da Silva, P. M. López-Pérez, C. Elvira, J. F. Mano, J. S. Román and R. L. Reis, Biotechnol. Bioeng., 2008, 101, 1321–1331 CrossRef CAS PubMed.
- J. Wang, L. Chen, Y. Zhao, G. Guo and R. Zhang, J. Mater. Sci.: Mater. Med., 2009, 20, 583–590 CrossRef CAS PubMed.
- T. M. Don, S. C. Chou, L. P. Cheng and H. Y. Tai, J. Appl. Polym. Sci., 2011, 120, 1–12 CrossRef CAS.
- S. B. Lee, D. I. Ha, S. K. Cho, S. J. Kim and Y. M. Lee, J. Appl. Polym. Sci., 2004, 92, 2612–2620 CrossRef CAS.
- T.-M. Don and H.-R. Chen, Carbohydr. Polym., 2005, 61, 334–347 CrossRef CAS PubMed.
- C. Y. Chuang, T. M. Don and W. Y. Chiu, Carbohydr. Polym., 2011, 84, 765–769 CrossRef CAS PubMed.
- N. Sanoj Rejinold, P. Sreerekha, K. Chennazhi, S. Nair and R. Jayakumar, Int. J. Biol. Macromol., 2011, 49, 161–172 CrossRef CAS PubMed.
- V. Sundaresan, J. U. Menon, M. Rahimi, K. T. Nguyen and A. S. Wadajkar, Int. J. Pharm., 2014, 466, 1–7 CrossRef CAS PubMed.
- R. Gui, Y. Wang and J. Sun, Colloids Surf., B, 2014, 116, 518–525 CrossRef CAS PubMed.
- Y. Wang, J. Wang, L. Ge, Q. Liu, L. Jiang, J. Zhu, J. Zhou and F. Xiong, J. Appl. Polym. Sci., 2013, 127, 3749–3759 CrossRef CAS.
- J. Lee, M. Jung, H. Park, K. Park and G. Ryu, J. Biomater. Sci., Polym. Ed., 2004, 15, 1065–1079 CrossRef CAS PubMed.
- J. H. Cho, S.-H. Kim, K. D. Park, M. C. Jung, W. I. Yang, S. W. Han, J. Y. Noh and J. W. Lee, Biomaterials, 2004, 25, 5743–5751 CrossRef CAS PubMed.
- Y. Cao, C. Zhang, W. Shen, Z. Cheng, L. L. Yu and Q. Ping, J. Controlled Release, 2007, 120, 186–194 CrossRef CAS PubMed.
- M. Recillas, L. L. Silva, C. Peniche, F. M. Goycoolea, M. Rinaudo and W. M. Argüelles-Monal, Biomacromolecules, 2009, 10, 1633–1641 CrossRef CAS PubMed.
- J. P. Chen and T. H. Cheng, Macromol. Biosci., 2006, 6, 1026–1039 CrossRef CAS PubMed.
- C. Chen, M. Liu, C. Gao, S. Lü, J. Chen, X. Yu, E. Ding, C. Yu, J. Guo and G. Cui, Carbohydr. Polym., 2013, 92, 621–628 CrossRef CAS PubMed.
- D. McDowall, B. Gupta and V. Stannett, Prog. Polym. Sci., 1984, 10, 1–50 CrossRef CAS.
- K. Gupta and K. Khandekar, Biomacromolecules, 2003, 4, 758–765 CrossRef CAS PubMed.
- G. C. Reilly and A. J. Engler, J. Biomechanics, 2010, 43, 55–62 CrossRef PubMed.
- A. J. Engler, S. Sen, H. L. Sweeney and D. E. Discher, Cell, 2006, 126, 677–689 CrossRef CAS PubMed.
- D. E. Discher, D. J. Mooney and P. W. Zandstra, Science, 2009, 324, 1673–1677 CrossRef CAS PubMed.
- A. Dar, M. Shachar, J. Leor and S. Cohen, Biotechnol. Bioeng., 2002, 80, 305–312 CrossRef CAS PubMed.
- J. A. Burdick and K. S. Anseth, Biomaterials, 2002, 23, 4315–4323 CrossRef CAS.
- M. Dvir-Ginzberg, I. Gamlieli-Bonshtein, R. Agbaria and S. Cohen, Tissue Eng., 2003, 9, 757–766 CrossRef CAS PubMed.
- C. Ceccaldi, R. Bushkalova, C. Alfarano, O. Lairez, D. Calise, P. Bourin, C. Frugier, C. Rouzaud-Laborde, D. Cussac, A. Parini, B. Sallerin and S. G. Fullana, Acta Biomater., 2014, 10, 901–911 CrossRef CAS PubMed.
Footnote |
† Electronic supplementary information (ESI) available. See DOI: 10.1039/c4ra12215a |
|
This journal is © The Royal Society of Chemistry 2014 |
Click here to see how this site uses Cookies. View our privacy policy here.