Recycling of waste printed circuit boards into ion exchange resin

Jianqiu Zhang*a, Tao Tiana, Jinyang Chen*a, Jianhua Zub and Yangjun Wanga
aSchool of Environmental and Chemical Engineering, Shanghai University, Shanghai 200444, China. E-mail: chenjy@shu.edu.cn
bSchool of Nuclear Science and Engineering, Shanghai Jiao Tong University, Shanghai, 200240, China

Received 10th October 2014 , Accepted 1st December 2014

First published on 1st December 2014


Abstract

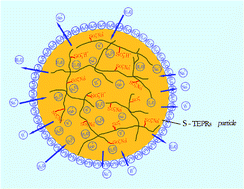
Recycling the nonmetal components of waste printed circuit boards (WPCBs), mainly thermosetting epoxy resins (TEPRs), is quite difficult because they are insoluble and inflexible. We report a new method to convert TEPRs into ion exchange resin by treatment with sulphuric acid and the equilibrium ion exchange capacity (IEC) of the produced sample is 1.63 meq g−1. FTIR indicated that TEPRs were modified by sulphuric acid and X-ray photoelectron spectroscopy (XPS) verified that sulfonic acid group (–SO3) was introduced. The produced ion exchange resin was stable up to 200 °C by TG-DTG analysis. The maximum adsorption capacities for Cu(II) and Ca(II) were 23.30 and 56.27 mg g−1, respectively. The Langmuir model gave a better fit for adsorption than the Freundlich model. The activation energies (Ea) were 21.18 and 48.53 kJ mol−1 for Cu(II) and Ca(II), respectively, with pseudo-second-order kinetics.


1. Introduction

The printed circuit board (PCB) is the foundation of the electronic industry: an essential component of every electrical and electronic device. The rapid development of the electronic industry has resulted in a significant increase in the production of waste printed circuit boards (WPCBs).1,2 In recent years, the recovery of metals from WPCBs has received more and more attention because of their high metal content, which may exceed that of some mineral deposits. This makes WPCBs an attractive secondary source of metals.3–8 Other than metals, WPCBs is mainly mixtures of polymers and glass fibres.9 The most common polymers in WPCBs are thermosetting epoxy resins (TEPRs), such as bromine epoxy resin, which is used as a fire retardant.10,11 However, because TEPRs are insoluble and infusible, it is difficult to treat and recycle. The increase in TEPRs wastes has resulted in health problems and environmental pollution. There is thus an urgent need to recycle or reuse TEPRs.

Ion exchange resins based on polystyrene are capable of ion exchange mainly because of sulfonic acid groups (R–SO3H), R is the network structure form of the resin frame part. The chemical structure of TEPRs, including the main aromatic ring, is shown in Fig. 1. It is possible to introduce functionalities, such as sulfonic acid groups, by sulfonation.12 In the sulfonation of TEPRs, an –SO3H group is attached to the aromatic ring. Ion exchange resins consisting of sulfonated TEPRs (S-TEPRs) have a fixed negative charge (–SO3) that allows mobile cations (H+) to migrate while excluding co-ions and S-TEPRs can be cation exchange resins.


image file: c4ra12094a-f1.tif
Fig. 1 Structure of thermosetting epoxy resin.

Here we present the new process using sulfonation to recycle TEPRs into ion exchange resins (S-TEPRs). We measured several properties of the products: ion exchange capacity (IEC), swelling degree (SD) or water uptake (WU). Resins were characterized by Fourier transform infrared spectroscopy (FTIR), elemental analysis, thermal analysis (TG-DTG) and X-ray photoelectron spectroscopy (XPS). To investigate the ion exchange process, the product was used to remove Cu(II) and Ca(II) and ion exchange isotherms and kinetics were determined.

2. Experimental

2.1 Materials

The aTEPRs powder was obtained from the Shanghai Solid Waste Management Center. The bTEPRs powder was manufactured in the lab from a 50 wt% E51/polyamide resin, cured at 60 °C and 12 h, grinded into powder of approximately 1 mm in diameter. The 732 phenylethylene ion exchange resin (732 IER), CuSO4, CaCl2 and 98% (wt%) sulphuric acid were provided by Sinopharm Chemical Reagent Co., Ltd. (China). E51 and polyamide resin were provided by Hong Kong Honour Rich Decoration Material International Group Limited.

2.2 Sulfonation

The aTEPR and bTEPR powders were dried in a vacuum oven at 100 °C for 48 h. Sulfonation of the aTEPRs and bTEPRs were carried out with the following steps: (1) 10 g TEPRs powder was added to 100 mL 98% sulfuric acid and the mixture was stirred vigorously at 85 °C for 360 min; (2) a large excess of ice water was added to stop the sulfonation and cause the precipitation of sulfonated TEPRs under continuous mechanical stirring; (3) the sulfonated TEPRs precipitation was then filtered and washed with deionized water until the pH 7. The obtained sulfonated TEPRs powder was dried in an oven at 60 °C for 24 h.

2.3 Ion exchange capacity (IEC)

IEC (meq g−1) was determined by acid–base titration. First H+ type resin was neutralized with excess aqueous NaOH, converting the resin into Na+ type. Then the excess NaOH was determined by neutralization to pH 7 with dilute HCl solution. Thus IEC was calculated by eqn (1):13
 
image file: c4ra12094a-t1.tif(1)
M and V are the molar concentration and volume of the solutions, respectively, while mresin is the weight of the products (H+ type).

2.4 Characterization

FTIR spectra were obtained on an Avatar 370 FTIR spectrometer with KBr powder. TG-DTG was obtained on a Netzsch STA 409 PC instrument at a rate of 10 °C min−1 under nitrogen atmosphere up to 900 °C.

WU and SD were calculated from eqn (2).14

 
image file: c4ra12094a-t2.tif(2)
where Gs is the weight of swollen powder and Gd is the weight of dry powder.

X-ray photoelectron spectroscopy (XPS) was performed on an ESCALAB 250Xi (Thermo Fisher Scientific China Ltd) and the data were analysed using Avantage software.

2.5 Ion exchange isotherms and kinetics

To obtain the ion exchange isotherms and kinetics of S-bTEPRs, the resin was washed with HCl and NaOH, converted to the Na+ type and dried in an oven at 60 °C to a constant weight. Cu(II) and Ca(II) solutions (600 mg L−1) were prepared by dissolving CuSO4 or CaCl2 in deionized water. The 0.5 g resin and 50 mL Cu(II) or Ca(II) solution (600 mg L−1) were put into 2 Hz vibration frequency vessel and adjusted to pH 9 with NaOH to conduct adsorption process at ambient temperature. The metal concentration in the solution was then analysed by ICP. The adsorption capacity (qt) of the resin was obtained as follows:15
 
image file: c4ra12094a-t3.tif(3)
where v is the volume of solution (L); m is the mass of resin (g); C0 and Ct are ion concentrations (mg L−1) at initial condition and adsorption time t; and qt is the adsorption capacity (mg g−1).

3. Results and discussion

3.1 Photographs and ion exchange capacity of prepared S-TEPRs

Two typical TEPRs and their sulfonated products with 98% sulphuric acid at 85 °C for 360 min are shown in Fig. 2. It shows that aTEPRs turns the color of yellow to dark brown after sulfonation and the main reason is that the aTEPRs was obtained from the Shanghai Solid Waste Management Center, which has some impurity, with 98% sulfuric acid the impurity may be oxidized to become brown. The bTERPs is pure E51/polyamide resin and its color becomes dark from transparent light yellow to reddish brown should be the conjugation of S[double bond, length as m-dash]O in –SO3 with benzene ring after the addition of –SO3 groups to the benzene ring of product, indicating the sulfonation indeed took place.
image file: c4ra12094a-f2.tif
Fig. 2 Photographs of aTEPRs, bTEPRs and the sulfonated products of S-aTEPRs and S-bTEPRs. (a) aTEPRs, (b) S-aTEPRs, (c) bTEPRs, (d) S-bTEPRs.

The most important parameter of ion exchange resins is IEC. Fig. 3 shows the IEC of 732 IER, S-aTEPRs and S-bTEPRs at ambient temperature. It shows that IEC increases rapidly in a relatively short time. However, the increase in IEC becomes slowly when exchange time is prolonged. The IEC reaches a maximum at 120 min and as for 732 IER, S-bTEPRs and S-aTEPRs the values are 2.21, 1.98, and 1.63 meq g−1, respectively. The IEC maintains a relatively stable value after 120 min, indicating that it reaches equilibrium.


image file: c4ra12094a-f3.tif
Fig. 3 IEC of 732 IER, S-aTEPRs and S-bTEPRs with time at ambient temperature.

Table 1 shows the adsorption properties of the samples. The equilibrium IEC of S-aTEPRs and S-bTEPRs are 73.76 and 89.29% for the value of 732 IER, respectively. The WU (SD) of S-aTEPRs is lower than that of S-bTEPRs and 732 IER, which may be due to glass fibres. It is obvious that S-aTEPRs has excellent ion exchange capacity and has a greatly potential application.

Table 1 The adsorption properties of 732 IER, S-aTEPRs and S-bTEPRs
Sample IEC (meq g−1) WU or SD (%)
S-aTEPRs 1.63 18.05
S-bTEPRs 1.98 25.54
732 IER 2.21 27.69


3.2 Characteristics of the products

The FTIR spectra of bTEPRs and S-bTEPRs are shown in Fig. 4. The peaks at 2925 and 2856 cm−1 represent the saturated C–H stretching vibrations of epoxy resin, which may be associated with methyl and methylene groups. Absorbance peaks of aromatic C[double bond, length as m-dash]C stretching appears at 1509 and 1459 cm−1. The peak at 1550 cm−1 represents the amide curing agent. The peak at approximately 1240 cm−1 confirms the presence of C–O–C structure. In many case, strong acid caused broken of C–O–C bond, however, the result shows that there are still a lot of these bonds after the sulfonation process, which because the structure is 3D net-like structure and only a part of this structure on the surface is broken during sulfonation. This little surface breakdown of C–O–C has little effect on ion exchange capacity of the recycling IER from waste WPCBs.
image file: c4ra12094a-f4.tif
Fig. 4 FTIR spectra of bTEPRs and S-bTEPRs.

Comparing the FTIR spectra of bTERPs and S-bTEPRs, there are noticeable differences in the spectra. The presence of two new peaks at approximately and 1037 and 1096 cm−1 are assigned to the symmetric and asymmetric stretching vibrations of –SO3H group in S-bTEPRs. That the absorbance at approximately 3500 cm−1 representing the stretching vibration of O–H groups in S-bTEPRs is wider and stronger than in bTERPs should be due to the addition of –SO3H in S-bTEPRs, which cause the formation of intermolecular hydrogen bonding between –SO3H groups and absorbed water molecules.16 The result shows that the bTEPRs has been added –SO3H group after sulfonation.

The thermal analysis of ion exchange resin has two main objects. One is to study the thermal properties of the resin to determine the thermal stability and degradation temperature.17,18 The other important object is to characterize the resin.19 Fig. 5 shows the TG of 732 IER and S-aTEPRs and it is clear that there are three steps in the decomposition curves of both samples. The first step is almost a level line up to the temperatures of 185 for 732 IER and 192 °C for S-aTEPRs, indicating that they are stable less than 200 °C. The second step shows obvious weight loss starting at approximately 280 up to 487 for 732 IER and 465 °C for S-aTEPRs owing to the decomposing of the molecular structure. Then the third step starts continuous weight loss up to 800 °C till totally carbonization. Comparing with 732 IER, the more residual of S-aTEPRs (approximately 20%) may be due to glass fibres.


image file: c4ra12094a-f5.tif
Fig. 5 TG curves of 732 IER and S-aTEPRs (10 °C min−1, N2: 50 mL min−1).

Fig. 6 and 7 show the TG-DTG of bTEPRs and S-bTEPRs, respectively. From room temperature to 250 °C, comparing the weight loss in Fig. 7 with Fig. 6, an obvious weight loss step can be observed from 25 to 200 °C in Fig. 7 which should be the loss of water combining with –SO3H group in S-bTERPs. Fig. 6 shows significant weight loss at 435 °C; however, significant weight loss from S-bTEPRs presents at 310, 346 and 428 °C. It indicates that the two processes of decomposition are completely different and the reason should be due to the decomposition of the addition of –SO3H group of S-bTEPRs.


image file: c4ra12094a-f6.tif
Fig. 6 TG-DTG curves of bTEPRs (10 °C min−1, N2: 50 mL min−1).

image file: c4ra12094a-f7.tif
Fig. 7 TG-DTG curves of S-bEPRs (10 °C min−1, N2: 50 mL min−1).

The products of different weight loss steps for S-bTEPRs were analysed by FTIR, as shown in Fig. 8. Comparing the first step of no weight loss with the initial sample, there is no obvious change and the elemental composition indicates that the C and S is unchanged, while the O and H has some decrease, as shown in Table 2. This may be due to evaporation of bound moisture in –SO3H group resulting in weight loss of 5.27%.


image file: c4ra12094a-f8.tif
Fig. 8 FTIR spectra of different weight loss steps in S-bTEPRs.
Table 2 The elemental composition for each step of TG as for S-bTEPRs
TG steps C area H area N area O area S area
Intial 30[thin space (1/6-em)]296 14[thin space (1/6-em)]165 2803 21[thin space (1/6-em)]407 1662
First step 30[thin space (1/6-em)]182 11[thin space (1/6-em)]402 2707 15[thin space (1/6-em)]730 1571
Second step 9670 1529 1089 12[thin space (1/6-em)]574 793
Third step 3062 427 112 2303 217


As for the second step with weight loss, the characteristic C–S absorption peak at approximately 609 cm−1 decreases significantly, indicating the breakdown of partial C–S bonds between –SO3H groups and phenyl rings.20 Elemental analysis shows a significant weight loss of the S and O, indicating the decomposition of –SO3H group. Furthermore, as for C, there is also some weight loss which indicates that the carbon linkage molecular structure also decomposes. In the third step, the peaks of characteristic –CH2– and phenyl ring disappear, indicating that S-bTEPRs is decomposed completely. This is accorded with the corresponding significantly decrease of C, H, O and S.

To confirm that the –SO3H group is covalently bonded to the bTEPR after sulfonation, XPS measurement of bTEPRs and S-bTEPRs was carried out and the XPS wide scan spectra are shown in Fig. 9. In the bTEPRs and S-bTEPRs samples, a strong peak at approximately 285 eV (corresponding to C, 1s), a weak peak at approximately 400 eV (corresponding to N, 1s), and a strong peak at 533 eV (corresponding to O, 1s) are all observed. However, a new peak for sulphur (S, 2p, 168 eV) is observed originated from –SO3H groups in S-bTEPRs and it is shown obviously in Fig. 10, indicating successful sulfonation to produce S-bTEPRs. The binding energies and elemental compositions are summarized in Table 3 and it shows that the content of S in S-bTEPRs is 8.58%, indicating sulfonation of S-bTEPRs from bTEPRs.


image file: c4ra12094a-f9.tif
Fig. 9 The XPS wide scan spectra of bTEPRs and S-bTEPRs.

image file: c4ra12094a-f10.tif
Fig. 10 The XPS narrow S 2p scan spectra of bTEPRs and S-bTEPRs.
Table 3 XPS elemental compositions
Samples C 1s (285 eV) O 1s (533 eV) N 1s (400 eV) S 2p (168 eV)
bTEPRs 84.23 10.62 5.51
S-bTEPRs 52.18 29.47 9.77 8.58


The XPS narrow scan C 1s scan spectra and fit curves for bTEPRs, along with the XPS narrow scan C 1s and S 2p spectra and fit curves for S-bTEPRs, are shown in Fig. 11. Comparing the C 1s fit curves of (a) with (b), there is one new peak at approximately 285.5 eV and it is attributed to the C–S bond of the sulfonated skeleton. The most important information comes from S 2p spectrum and fit curves for S-bTEPRs in Fig. 11(c). The spectrum is deconvoluted into two peaks at 168.1 and 169.2 eV which be assigned to the 2p3/2 and 2p1/2 of sulphur in a high oxidation state, i.e., sulfonic acid groups (–SO3).21


image file: c4ra12094a-f11.tif
Fig. 11 The XPS narrow scan spectra and fit curves. (a) C 1s of the S-bTEPRs, (b) C 1s of the bTEPRs, (c) S 2p of the S-bTEPRs.

3.3 Ion exchange isotherms and kinetics of S-bTEPRs

3.3.1 Ion-exchange isotherms. The most powerful tool for the analysis of adsorption processes are isotherms and the Langmuir and Freundlich isotherm models are widely used.

The Langmuir isotherm is expressed as:22,23

 
image file: c4ra12094a-t4.tif(4)
where Ce is the equilibrium concentration (mg L−1), qe is the solid adsorbate concentration at equilibrium (mg g−1), Q0 is theoretical mono-layer adsorption capacity (mg g−1) and b is related to the energy of adsorption (L mg−1).

The Freundlich isotherm model is expressed as:23,24

 
log[thin space (1/6-em)]qe = log[thin space (1/6-em)]kf + (1/n)log[thin space (1/6-em)]Ce (5)
where kf is adsorption capacity and n is related to the intensity of adsorption.

The Langmuir isotherm describes mono-layer adsorption on a homogenous surface and the Freundlich isotherm is a satisfactory empirical isotherm used for non-ideal adsorption on heterogeneous surface.24

Fig. 12 and 13 show the Langmuir and Freundlich adsorption of Cu(II) and Ca(II) and their adsorption constants evaluated from isotherms are given in Table 4. The correlation coefficients of Cu(II) and Ca(II) of the Langmuir are 0.9981 and 0.9983 which are more perfect than corresponding 0.7855 and 0.8476 of the Freundlich. The result indicates that the Langmuir isotherm model is a better fit to the equilibrium adsorption data.


image file: c4ra12094a-f12.tif
Fig. 12 Langmuir isotherm for ion exchange of Cu(II) and Ca(II) in S-bTEPRs.

image file: c4ra12094a-f13.tif
Fig. 13 Freundlich isotherm for ion exchange of Cu(II) and Ca(II) in S-bTEPRs.
Table 4 Parameters of Langmuir and Freundlich isotherms for the ion exchange of metals on S-bTEPRs
  Langmuir constants Freundlich constants
Q0 (mg g−1) b (L mg−1) R2 kf 1/n R2
Ca(II) 23.30 0.13 0.9981 41.85 0.050 0.7855
Cu(II) 56.27 0.16 0.9983 23.45 0.066 0.8476


As for the IER with the –SO3Na group which is the functional group grafted on the surface, the Cu(II) and Ca(II) will take place of Na+ during the ion exchange process. The ion exchange reactions occurring in the Ca2+ and Cu2+ solutions can be represented by the following reactions.

2RSO3Na + Ca2+ ↔ (RSO3)2Ca + 2Na+

2RSO3Na + Cu2+ ↔ (RSO3)2Cu + 2Na+

Obviously, the adsorption is chemical adsorption and thus the mono-layer Langmuir model is more suitable.

3.3.2 Ion-exchange kinetics. Experiments were carried out at 289–338 K to understand the ion-exchange kinetics. Based on the previous similar works,25–28 it can assume that the ion-exchange kinetics is pseudo-second-order reaction relative to the adsorbed amount.

The pseudo-second-order equation is expressed as:

 
image file: c4ra12094a-t5.tif(6)
where k1 (min−1) is the rate constant of the second-order adsorption, qe is the equilibrium adsorption capacity and qt is the amount adsorbed at time “t”.

Plots of t/qt against “t” at 298–338 K for the second-order adsorption are shown in Fig. 14. The result provides the adsorption rate constants k1 and qe values from the slope and intercept in Table 5. The calculated qe from the second-order kinetic model corresponded very well with the experimental values, with R2 > 0.99. It is obvious that the pseudo-second-order model provides a perfect fit of the experimental data and thus, the kinetics model is reliable and suitable.


image file: c4ra12094a-f14.tif
Fig. 14 The fit curves of the pseudo-second-order equation for adsorption of Ca(II) and Cu(II) in S-bTEPRs at different temperatures.
Table 5 Parameters for the pseudo-second-order kinetic model
Metal T (K) qe,expa (mg g−1) k2 × 10−4 (g mg−1 min−1) qe (mg g−1) R2
a Amount of metal adsorbed for 24 h which can be considered as the equilibrium absorption capacity because there is no change with more time.
Ca(II) 298 35.49 7.9021 33.31 0.9968
318 36.06 9.4898 35.31 0.9974
338 36.74 13.7276 36.46 0.9985
Cu(II) 298 43.76 6.6763 39.43 0.9946
318 44.86 7.3414 40.21 0.9955
338 45.73 7.9477 40.87 0.9953


The rate constant k can be expressed in Arrhenius form of ln[thin space (1/6-em)]k = −(Ea/RT) + ln[thin space (1/6-em)]A, where A is the pre-exponential factor, Ea is the activation energy (J mol−1), R is the universal gas constant (8.314 J mol−1 K−1), and T is the temperature (K). Then according to Arrhenius equation, the line fitting relation of ln[thin space (1/6-em)]k and 1/T gives apparent adsorption activation energy Ea and Arrhenius pre-exponential factor A.

The relation of linearly fit of adsorption rate constant k1 and temperature is shown in Fig. 15. According to Arrhenius equation, the linear fitting relation of ln[thin space (1/6-em)]k1and 1000/T gives that the apparent adsorption activation energy (Ea) for the adsorption of Cu(II) and Ca(II) on S-bTEPRs are 21.18 and 48.53 kJ mol−1, respectively. Thus, the adsorption kinetic equations are shown as eqn (7) and (8).

 
image file: c4ra12094a-t6.tif(7)
 
image file: c4ra12094a-t7.tif(8)


image file: c4ra12094a-f15.tif
Fig. 15 Relationship between reaction rate constants and temperature for adsorption of Cu(II) and Ca(II) in S-bTEPRs.

The positive values of Ea suggest that higher temperature favours adsorption and that the adsorption is endothermic.

4. Conclusions

Thermosetting epoxy resins, nonmetal materials from WPCBs, were transformed into ion exchange materials using sulphuric acid. The equilibrium IEC is 1.63 mmol g−1 and it can be used safely below 200 °C. The process is a low cost method to produce high-value product for the recycling of waste WPCBs.

The produced IER is an effective adsorbent for the removal of Cu(II) and Ca(II) and the Langmuir isotherm model is suitable for the adsorption. The adsorption capacity for Cu(II) and Ca(II) calculated from the Langmuir model are 56.27 and 23.30 mg g−1, respectively. The adsorption kinetics of Cu(II) and Ca(II) are suitable for pseudo-second-order rate model and the apparent Ea for Cu(II) and Ca(II) are 21.18 and 48.53 kJ mol−1, respectively.

Acknowledgements

This research was supported by the National Natural Science Foundation of China (no. 20777048, 91226111) and the Program for Innovative Research Team in University (no. IRT13078).

Notes and references

  1. W. J. Hall and P. T. Williams, Resour., Conserv. Recycl., 2007, 51, 691–709 CrossRef PubMed.
  2. P. Zhu and G. B. Gu, Chin. J. Rare Met., 2002, 26, 214–216 CAS.
  3. Y. Zhou and K. Qiu, J. Hazard. Mater., 2010, 175, 823–828 CrossRef CAS PubMed.
  4. I. D. Marco, B. M. Caballero, M. J. Chomón, M. F. Laresgoiti, A. Torres, G. Fernández and S. Arnaiz, J. Anal. Appl. Pyrolysis, 2008, 82, 179–183 CrossRef PubMed.
  5. C. Quan, A. Li and N. Gao, Waste Manage., 2009, 29, 2353–2360 CrossRef CAS PubMed.
  6. J. H. William and T. W. Paul, Resour., Conserv. Recycl., 2007, 51, 691–709 CrossRef PubMed.
  7. C. Hung-Lung, L. Kuo-Hsiung, L. Mei-Hsiu, C. Ting-Chien and M. Sen-Yi, J. Hazard. Mater., 2007, 149, 151–159 CrossRef PubMed.
  8. F. Barontini and V. Cozzani, J. Anal. Appl. Pyrolysis, 2006, 77, 41–55 CrossRef CAS PubMed.
  9. J. Li, H. Z. Lu, J. Guo, Z. M. Xu and R. H. Zhou, Environ. Sci. Technol., 2007, 41, 1995–2000 CrossRef CAS.
  10. J. Guan, Y. S. Li and M. X. Lu, J. Anal. Appl. Pyrolysis, 2008, 83, 185–189 CrossRef PubMed.
  11. A. C. Kasper, G. B. T. Berselli, B. D. Freitas, J. A. S. Tenório, A. M. Bernardes and H. M. Veit, Waste Manage., 2011, 31, 2536–2545 CrossRef CAS PubMed.
  12. H. C. Lee, H. S. Hong, Y. M. Kim, S. H. Choi, M. Z. Hong, H. S. Lee and K. Kim, Electrochim. Acta, 2004, 49, 2315–2323 CrossRef CAS PubMed.
  13. R. Y. M. Huang, P. Shao, C. M. Burns and X. Feng, J. Appl. Polym. Sci., 2001, 82, 2651–2660 CrossRef CAS.
  14. F. Barroso-Bujans, R. Verdejo, A. Lozano, J. L. G. Fierro and M. A. Lopez-Manchado, Acta Mater., 2008, 56, 4780–4788 CrossRef CAS PubMed.
  15. F. Gode and E. Pehlivan, J. Hazard. Mater., 2006, 136, 330–337 CrossRef CAS PubMed.
  16. P. Xing, G. P. Robertson, M. D. Guiver, S. D. Mikhailenka, K. Wang and S. Kaliaguine, J. Membr. Sci., 2004, 229, 95–106 CrossRef CAS PubMed.
  17. S. M. Dakka, J. Therm. Anal. Calorim., 2003, 74, 729–734 CrossRef CAS.
  18. S. M. Dakka, J. Therm. Anal. Calorim., 2003, 73, 17–24 CrossRef CAS.
  19. D. Chambree, C. Iditoiu, E. Segal and A. Cesrao, J. Therm. Anal. Calorim., 2005, 82, 803–811 CrossRef CAS PubMed.
  20. H. Qian, Q. J. Peng and J. W. Zhang, Ion Exch. Adsorpt., 2012, 28, 413–422 CAS.
  21. M. M. Nasef and H. Saidi, Appl. Surf. Sci., 2006, 252, 3073–3084 CrossRef CAS PubMed.
  22. I. Langmuir, J. Am. Chem. Soc., 1916, 38, 2221–2295 CrossRef CAS.
  23. S. S. Gupta and K. G. Bhattacharyya, RSC Adv., 2014, 4, 28537–28586 RSC.
  24. H. M. F. Freundlich, Z. Phys. Chem., 1906, 57, 385–470 CAS.
  25. Y. S. Ho, J. Hazard. Mater., 2006, B136, 681–689 CrossRef PubMed.
  26. Y. S. Ho and G. McKay, Process Biochem., 1999, 34, 451–465 CrossRef CAS.
  27. L. C. Lin and R. S. Juang, Chem. Eng. J., 2007, 132, 205–213 CrossRef CAS PubMed.
  28. Y. Prasanna Kumar, P. King and V. S. R. K. Prasad, J. Hazard. Mater., 2006, 137, 1211–1217 CrossRef CAS PubMed.

This journal is © The Royal Society of Chemistry 2015
Click here to see how this site uses Cookies. View our privacy policy here.