
Preparation, characterization and electrochemical measurement of porous carbon derived from poly(furfuryl alcohol)/polyvinylpyrrolidone electrospun nanofibers
Meijing Wang,
Yi-nan Wu,
Jingyi Shen,
Meimei Zhou,
Fengting Li and
Bingru Zhang*
College of Environmental Science & Engineering, State Key Laboratory of Pollution Control and Resource Reuse, Tongji University, 1239 Siping Road, Shanghai, China. E-mail: bingru@tongji.edu.cn; Fax: +86-21-65985059; Tel: +86-21-65980567
First published on 11th November 2014
Abstract
In this work, porous carbon materials produced from poly(furfuryl alcohol) (PFA)/polyvinylpyrrolidone/silica composite electrospun fibers have been prepared by sol–gel, carbonization and etching processes. PFA acts as carbon source, tetraethyl orthosilicate (TEOS) serves as a template and poly(propylene oxide)-block-poly(ethylene oxide)-block-poly(propylene oxide) triblock copolymer Pluronic F127 works as a structure-directing agent. Three samples (C-1, C-2 and C-3) with different pore structures have been prepared. The structures of the pores are demonstrated to be dependent on the amount of TEOS and the presence or absence of F127 by means of various characterization methods. After the carbonization process, carbon material yields of 35.5%, 38.6% and 40.3% are obtained, corresponding to the samples of electrospun nanofibers M-1, M-2 and M-3, respectively. When further treated by the hydrofluoric acid (HF) etching, the regular morphology of the electrospun nanofibers disappears gradually by prolonging the etching time, and the as-obtained typical product C-3 has a high specific surface area (SSA) of 897 m2 g−1 and a specific capacitance of 205.5 F g−1 at the scan rate of 20 mV s−1 in KOH electrolyte solution. It is revealed that the structure of the pores and the high SSA are responsible for the excellent electrochemical performance of the porous carbon materials. According to the results, the typical product C-3 is a promising electrode material for electrical double-layer capacitors.
Introduction
Li-ion batteries suffer from barriers to fulfilling the increasing demands for high-efficiency energy storage systems, owing to their low energy density and limited life cycle.1,2 Electrochemical capacitors (ECs), also known as double-layer capacitors or supercapacitors, have been put forward for many years as an alternative to or components of batteries due to their high power density, near-infinite life cycle, short charging and discharging time, high stability and low cost. To date, various materials have been used to make ECs, which may be classified into carbon, carbon-based composites, oxides, and polymeric materials.3 Among them, carbon has attracted great interest due to possessing some distinct advantages such as easy processability, good electrical conductivity, being environmentally friendly, and low cost. As the electrochemical performance of electrodes depends on the properties of EC materials, including surface area, surface morphology, pore size and functional groups, much effort has been made to improve the electrochemical performance of carbon by increasing the surface area or enforcing controllability of the pore size distribution and pore structure.4–8Recently, carbon materials prepared by the electrospinning method, as a promising electrode for capacitors, have been of great interest because of their large surface area and porosity. The properties of the fabricated carbon materials depend on the type of the polymer solution and the processing parameters. The polymers featuring in current research are mainly polyacrylonitrile (PAN) and phenolic resin, which both act as carbon sources.9,10 Jo and co-workers used PAN as the carbonizing polymer and other polymers such as PAA and PS as the pyrolyzing polymer to prepare well-controlled porous carbon nanofibers.11 Ma et al. prepared carbon nanofiber webs with a BET surface area of 416 m2 g−1, without any activation process, by electrospinning resole-type phenolic resin–PVA blend solution.10 Many other polymers, including pitches, poly(vinyl alcohol) (PVA), polyimides (PIs), polybenzimidazole (PBI), poly(vinylidence fluoride) (PVDF) and lignin, have also been used in studies in order to improve the performance of carbon materials or reduce the cost, etc.12
Although a series of electrospinning researches have been presented, no one has involved furfuryl alcohol (FA) in electrospinning. FA, with a large carbon yield, which is easily dispersed in a pore-forming agent and converted to a carbon matrix network, has been made into porous carbon.13–19 In those preparation processes, the triblock copolymer Pluronic F127 is always used as a structure-directing agent, and TEOS acts as a hard template to produce pores. In the presence of acid, FA converts into poly(furfuryl alcohol) (PFA) which will copolymerize with TEOS to form a PFA/silica composite. Therefore the fact that the PFA/silica framework is a unity makes the resultant carbon amorphous if silica is removed. Zhai et al.15 reported an organosilane-assisted synthesis of ordered mesoporous PFA/silica composites possessing a surface area of 200–510 m2 g−1 by employing TEOS, 3-(triethoxysilyl) furan and FA as precursors, and F127 as a structure-directing agent via an EISA (solvent-Evaporation Induced Self-Assembly) process. Sun et al.19 synthesized amorphous carbon nanotubes with a surface area of 503.1 m2 g−1 bya vapour deposition polymerization (VDP) method using attapulgite as the template and FA as the carbon source. Zhang et al.20 introduced a novel method to functionalize nanofiber surfaces with PFA-derived carbon nanoparticles by dip coating, and the carbon nanofibers with PFA-decorated surfaces showed promise in becoming effective electrodes in Li-ion batteries.
In this present article, electrospinning technology and a sol–gel process are applied to prepare carbon nanofibers with furfuryl alcohol as the carbon source. In order to increase the viscosity and spinnability of the spinning solution, polyvinylpyrrolidone (PVP) is added. In addition, TEOS and F127 play the parts of the template and structure-directing agent in the preparation process, respectively. The morphology variation of the fibers has been systematically analyzed by prolonging the etching time. What’s more, we for the first time report this kind of product as a supercapacitor electrode material in combination with acetylene black and polyvinylidene fluoride (PVDF) in 6 mol L−1 KOH electrolyte solutions. The electrochemical capacitance performance of the materials is illuminated by cyclic voltammetry (CV) tests and electrochemical impedance spectroscopy (EIS).
Experimental
Materials
Poly(vinyl pyrrolidone) (PVP, Mw = 3000–5000) and tetraethyl orthosilicate (TEOS, SiO2 (%) = 28.4) were supplied by Sinopharm Chemical Reagent Co., China. Poly(propylene oxide)-block-poly(ethylene oxide)-block-poly (propylene oxide) triblock copolymer Pluronic F127 (EO106PO70EO106, Mw = 12![[thin space (1/6-em)]](https://www.rsc.org/images/entities/char_2009.gif) 600) was purchased from Aldrich. Furfuryl alcohol (FA, 98.0%) was purchased from Aladdin Chemistry Reagent Co., Shanghai. Oxalic acid dehydrate (99.5%), used as the catalyst for the polymerization of FA, was obtained from Qiangsheng Chemical Reagent Co., Jiangsu. Acetone (99.5%), ethanol (99.7%), hydrofluoric acid (HF, 40.0%), cetyltrimethylammonium bromide (CTAB, 99.0%), sulphuric acid (98.0%) and toluene (99.5%) were purchased from Sinopharm Chemical Reagent Co., China. Acetylene black (AB) and polyvinylidene fluoride (PVDF) were purchased from the specific vendor. All chemicals were of analytical grade and used as received without any further purification.
600) was purchased from Aldrich. Furfuryl alcohol (FA, 98.0%) was purchased from Aladdin Chemistry Reagent Co., Shanghai. Oxalic acid dehydrate (99.5%), used as the catalyst for the polymerization of FA, was obtained from Qiangsheng Chemical Reagent Co., Jiangsu. Acetone (99.5%), ethanol (99.7%), hydrofluoric acid (HF, 40.0%), cetyltrimethylammonium bromide (CTAB, 99.0%), sulphuric acid (98.0%) and toluene (99.5%) were purchased from Sinopharm Chemical Reagent Co., China. Acetylene black (AB) and polyvinylidene fluoride (PVDF) were purchased from the specific vendor. All chemicals were of analytical grade and used as received without any further purification.
Preparation of PVP, PFA/PVP/silica electrospinning solution and PFA resin
By addition of 25 mg of oxalic acid to 5 mL of FA, the oligomeric PFA was prepared after stirring for 4 h in a 70 °C water bath. Meanwhile, 2 g of alcohol, 0.54 g of deionized water, 0.07 g of 2 mol L−1 HCl and TEOS were mixed in sequence, and stirred at room temperature. After a certain period of time, the prepared silica acid was dripped into the oligomeric PFA solution at 70 °C under stirring. Then, the formed xerogel was dissolved in acetone and dried in air. Finally, the dry products were added in sample vials containing 10 mL of alcohol at room temperature.In a typical procedure, 15 wt% PVP (dissolved in alcohol) was prepared. The PVP–(PFA/silica) sol with the mass ratio of PVP:(PFA/silica) = 2.4:1 was prepared by the drop-wise addition of aqueous PFA/silica to PVP within 1 h under vigorous stirring. The resulting PVP–(PFA/silica) mixture was further stirred until a homogeneous and viscous mixture spinnable for electrospinning was obtained. Additionally, pure PFA resin was also obtained for comparison.21
Preparation of fiber mats
The above precursor gel solution sol was taken up into the plastic syringe with a stainless steel pinhead connected to a high-voltage generator as the anode, and ejected from the pinhead at a speed of 1.0 mL h−1. The cathode was covered with aluminum foil, with a distance to the pinhead of 15 cm, which was used as the fiber collector. The nanofibers were formed between the nozzle tip and the aluminum foil when a high voltage of 17 kV was applied. The membranes collected were dried in the drying apparatus for further characterization. The fibrous membranes obtained were denoted as M-1 and M-2, corresponding to 4.0048 g and 4.8568 g TEOS in the spinning sols respectively. M-3 was derived from adding 4.8568 g TEOS and 1.6 g F127 simultaneously. Meanwhile, pure PVP fiber mats were collected for comparison.Synthesis of the resultant products
The as-spun PVP–PFA/silica fiber mats were dried in a vacuum oven for 24 h at 80 °C. Pyrolysis of F127 and PVP was conducted by heating to 400 °C and maintaining this temperature for 3 h in a tubular furnace under a nitrogen atmosphere. Then, carbonization took place at 700 °C for 3 h to create nanofiber membranes. The silica component of the carbonized products was removed gradually by etching in HF solution for different time intervals (0 h, 12 h and 24 h). Subsequently, the as-obtained products were washed with deionized water, and dried at 80 °C for 24 h. Finally, the black carbon materials etched for 24 h were noted C-1, C-2 and C-3.Characterization
Scanning electron microscopy (SEM) and energy dispersive X-ray detector (EDX) experiments were conducted on a XL-30 scanning electron microscope. Fourier-transform infrared (FT-IR) spectra were recorded on a Bruker Vector 22 spectrometer. Transmission electron microscopy (TEM) experiments were performed on a JEM-2011 electron microscope operated at 200 kV. For X-ray diffraction (XRD), the patterns of the samples were measured using a Bruker D8 Advance diffractometer with Cu Kα radiation. The thermogravimetric (TG) curves of the as-spun fiber mats were recorded using an SDT Q600 V8.3 Build 101 instrument from 35 °C to 800 °C under an air atmosphere with a heating rate of 10 °C min−1. Scans were taken from 10° to 60° (2θ) at a speed of 2° min−1. The Brunauer–Emmett–Teller (BET) method was employed to calculate the specific surface areas. By using the Barrett–Joyner–Halenda (BJH) model, the pore volumes and pore size distributions were derived from the adsorption branches of the isotherms. The mesopore volumes (Vmeso) and mesopore surface areas were calculated by the t-plot method.Electrochemical measurements
The electrochemical tests were carried out in a standard three-electrode system controlled with a PGSTAT302N electrochemical working station. The working electrode (the surface is 1 cm2) was formed by mixing about 85 wt% sample, 10 wt% AB and 5 wt% PVDF and then pressing the mixture onto a nickel grid (7 MPa). Furthermore, platinum wire acted as the counter electrode, and Ag/AgCl as the reference electrode. The electrolyte used was 6 M KOH solution, and the cells were cycled between voltages of −1.0 and 0 V. The EIS spectra were measured in the frequency range of 0.1–10000 Hz with an amplitude of 10 mV.
Results and discussion
As shown in Fig. 1(a) and (b), the as-obtained nanofiber mats and carbons are characterized by FTIR. It can be seen from Fig. 1(a) that the peaks at 787 cm−1 represent a 2,5-disubstituted furan ring, which means that FA molecules have connected to each other through their –CH2– bridges;22 the featured band at 947 cm−1 is ascribed to Si–OH vibrations.23 The other featured peaks and their corresponding groups are shown in Table 1. Some characteristic peaks of the prepared fibers become weaker after carbonization and the etching treatment (Fig. 1(b)); only three (3650 cm−1, 1515 cm−1 and 1119 cm−1) remain, which belong to OH stretching vibrations of surface-absorbed water, aromatic ring stretching vibrations of furan rings24 and C–O stretching vibrations, respectively. | ||
| Fig. 1 FT-IR spectra of PFA–PVP/silica composites: (a) before carbonization, (b) after carbonization and etching. | ||
| Wavelength/cm−1 | Groups |
|---|---|
| 3391 | OH stretching of surface-adsorbed water |
| 2967 | CH2 asymmetric stretching of PVP and PFA (containing F127 in M-3) |
| 2872 | CH asymmetric stretching of PVP (containing F127 in M-3) |
| 1661 | C![[double bond, length as m-dash]](https://www.rsc.org/images/entities/char_e001.gif) O symmetric stretching of PVP and PFA O symmetric stretching of PVP and PFA |
| 1495 | CH2 in-plane bending vibration of PVP and PFA (containing F127 in M-3) |
| 1426 | C–C in-plane bending vibration of PVP and PFA (containing F127 in M-3) |
| 1372 | Furan rings of PFA |
| 1287 | C–N symmetric stretching of PVP |
| 1075 | C–O–Si stretching vibration of PFA |
The SEM photographs of the originally prepared PVP–PFA/silica nanofiber mats are displayed in Fig. 2(a). The nanofibers with smooth surfaces are randomly distributed in the membrane and are relatively uniform in size. Fig. 2(b) shows the fiber diameter distribution of M-1, M-2 and M-3 which are exhibited in Fig. 2(a). Due to the fact that the increase of the amount of TEOS increases the solution viscosity, the M-1 composite fibers have an intensive diameter of 200–300 nm, and the diameters of M-2 and M-3 were larger than that of M-1. Fig. 2(c) represents the SEM images of the carbon fibers after further carbonization at 700 °C and then an etching treatment in HF solution. It is demonstrated that the diameters of all the three composite fibers shrink to 300–400 nm after carbonization and the etching treatment, which is attributed to the removal of PVP and F127. It also can be seen that the regular morphology of the fibers fades away gradually with increasing the etching time. Furthermore, the fiber structure of C-3 disappears almost completely after treatment for 24 h in HF solution, which results from the fact that the PFA framework is instable when the PVP and templates are both removed, especially when silica and F127 play more significant roles than PVP in supporting the whole fiber framework.
 | ||
| Fig. 2 (a) SEM photos (from left to right side) of the PFA–PVP/silica fiber mats named M-1, M-2 and M-3; (b) fiber diameter distribution (from left to right side) of the PFA–PVP/silica fiber mats named M-1, M-2 and M-3; (c) SEM images (from left to right side) of the intermediate products prepared from M-3 etched for 0 h, 12 h and 24 h. | ||
The mechanism of the preparation of porous carbon materials from the combination of FA, silica and F127, which have been put forward in previous reports, can be applied in this work.14–16 The mechanism process using both F127 and TEOS as templates or TEOS only is presented in Fig. 3. The addition of F127 could form micelles to a certain degree, to guide the combination of PFA oligomers and silica through hydrogen bonds, which makes the pore distribution of the resultant carbon material more centralized compared with those without F127. As expected, the carbon material with a wider pore distribution had superior electrochemical performance over the other materials.
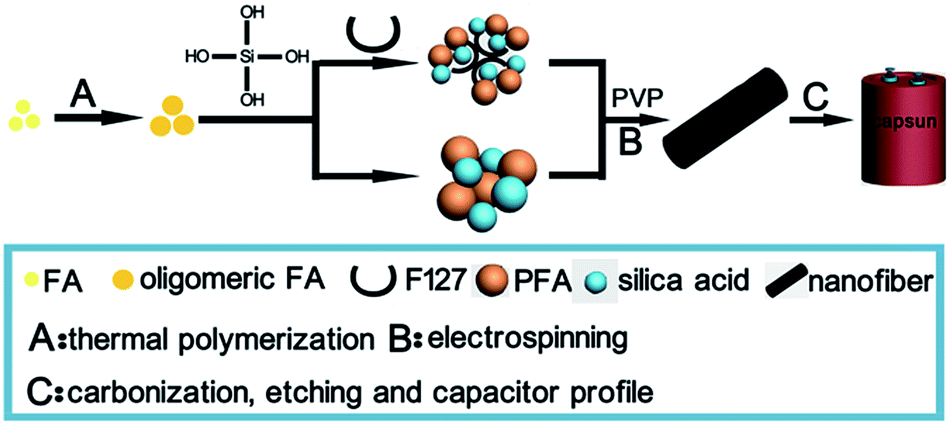 | ||
| Fig. 3 Schematic representation of the experimental process. | ||
The EDX data (results given in Table 2) of M-3 after carbonization and further etching for 0 h, 12 h and 24 h indicates that the silica component is the largest before etching. However, it decreases after treatment for 12 h, and is almost removed after etching for 24 h in HF. The measured atomic ratios of C, O and Si are 95.22%, 4.56% and 0.22% after 24h respectively, which could explain the SEM graphs (Fig. 2(c)).
| Element | At% | ||
|---|---|---|---|
| Etched for 0 h | Etched for 12 h | Etched for 24 h | |
| a The sample was carbonized at 700 °C. | |||
| C | 24.54 | 85.36 | 95.22 |
| O | 49.21 | 11.39 | 4.56 |
| Si | 26.25 | 3.26 | 0.22 |
The TGA results conform to FT-IR pattern. The TGA and derivative thermogravimetric (DTG, inset) curves of the initially prepared hybrid nanofibers (Fig. 4) exhibit several detectable steps and a total mass loss of ca. 70–80%. The first step showing a ca. 17% loss from 35 °C to 300 °C could be attributed to the desorption of physisorbed water, and the subsequent weight loss of about 18 wt% between 300 °C to 400 °C is assigned to the decomposition of PVP and F127 (observed in M-3).25,26 Additionally, the decomposition of PFA often occurs at 300–450 °C. The significant weight loss observed between 450 °C and 600 °C coincides with the combustion of organic constituents.15 The remaining component results from silica in the composites.
 | ||
| Fig. 4 TG and DTG curves (inset) of the as-electrospun nanofibers named M-1, M-2 and M-3 (in air). | ||
In addition, as shown in Table 3, the weight loss of the as-made samples after carbonization at 700 °C under a nitrogen atmosphere were measured. This phenomenon reveals that the PVP–PFA/silica composite fibers have a higher amount of residual carbon, and that the remaining amounts of carbon of the three samples named M-1, M-2 and M-3 are more than for the pure PVP fibers, but less than for the PFA resin.
| Sample | PVP nanofibers | PFA resin | M-1 | M-2 | M-3 |
|---|---|---|---|---|---|
| Before carbonization | 0.1116 g | 0.3264 g | 0.4385 g | 0.0651 g | 0.1200 g |
| After carbonization | 0.0025 g | 0.1342 g | 0.1556 g | 0.0251 g | 0.0484 g |
| Residue ratio | 2.2% | 41.1% | 35.5% | 38.6% | 40.3% |
Fig. 5 shows the X-ray diffraction (XRD) patterns of C-1, C-2 and C-3. Two broad and sharp peaks at about 24° and 43° are observed, corresponding to the {002} (2θ = 24°) crystal plane and the overlapping weaker {101}, {100} (2θ = 43°) plane. The absence of a sharp diffraction pattern implies that the porous carbons have some degree of graphitization and possess an amorphous structure.
 | ||
| Fig. 5 XRD patterns of the as-made C-1, C-2 and C-3 products. | ||
The TEM images displayed in Fig. 6 indicate the existence of wormlike mesopores on the surface of the C-3 material. The formation of a disordered mesoporous structure is attributed to the rapid solvent evaporation during the electrospinning process.27 As observed in Fig. 7, the nitrogen adsorption–desorption isotherms of the products show typical IV curves with obvious hysteresis loops. Additionally, the physicochemical parameters of the PFA-based carbon products are summarized in Table 4. Combining the graph and the table, for the materials carbonized from M-1, M-2 and M-3 without etching treatment, almost no surface area was detected. However, for the etched materials, a considerable surface area was found. This indicates that amphiphilic F127 forms micelles to lead the connection of PFA oligomers and silica, that certain amounts of mesopores are produced after the removal of F127, and that the rest of the micropores are mainly attributed to the etching of the silica template.28 With changing contents of TEOS and F127, the surface area increases from 307 to 897 m2 g−1, and the pore volume increases from 0.24 to 0.64 cm3 g−1. The results demonstrate that the existence of F127 accelerates the formation of mesopores in the PFA-based carbon materials.
 | ||
| Fig. 6 TEM image of the resultant C-3 carbon material. | ||
 | ||
| Fig. 7 N2 adsorption–desorption isotherms (inset) and calculated pore size distributions of the resultant carbon products C-1, C-2 and C-3. | ||
| Sample | SBETa/m2 g−1 | SBETb/m2 g−1 | Smeso/SBETb | Vmesob/cm3 g−1 | Vmeso/Vtotalb | Dmesob/nm |
|---|---|---|---|---|---|---|
| a This sample was achieved after carbonization.b This sample was obtained after carbonization and etching. “—” means that no concentrated mesopores were detected. | ||||||
| C-1 | Not detected | 307 | 66.9% | 0.24 | 78.2% | — |
| C-2 | Not detected | 633 | 49.0% | 0.36 | 63.0% | — |
| C-3 | 121 | 897 | 80.3% | 0.64 | 88.5% | 3.7 |
Fig. 8(a)–(e) present the CV curves of PVP fiber mats, PFA resin, C-1, C-2 and C-3 electrochemical capacitors in a 6 M KOH electrolyte at voltage scan rates of 2, 5, 10, 20 and 50 mV s−1 in the potential range of −1.0 to 0 V. Fig. 8(f) shows a comparison of three supercapacitors, C-1, C-2 and C-3, at the scan rate of 50 mV s−1 in the same voltage range. As seen in these figures, the CV curves display nearly rectangular shapes possessed by ideal supercapacitors, demonstrating the charge storage properties of the electric double layer capacitors (EDLCs). When the applied potential is scanned in the opposite direction, the current responds rapidly, which indicates that the charge–discharge process of the electrode has reversible kinetics. Besides, with increasing the scan rate, the current intensity increases, but the CV curves deviate from a rectangular shape. This is because the increase of the potential scan rate would increase the ionic charge transfer resistance in the channel, which further affects the performance of the EDLC.
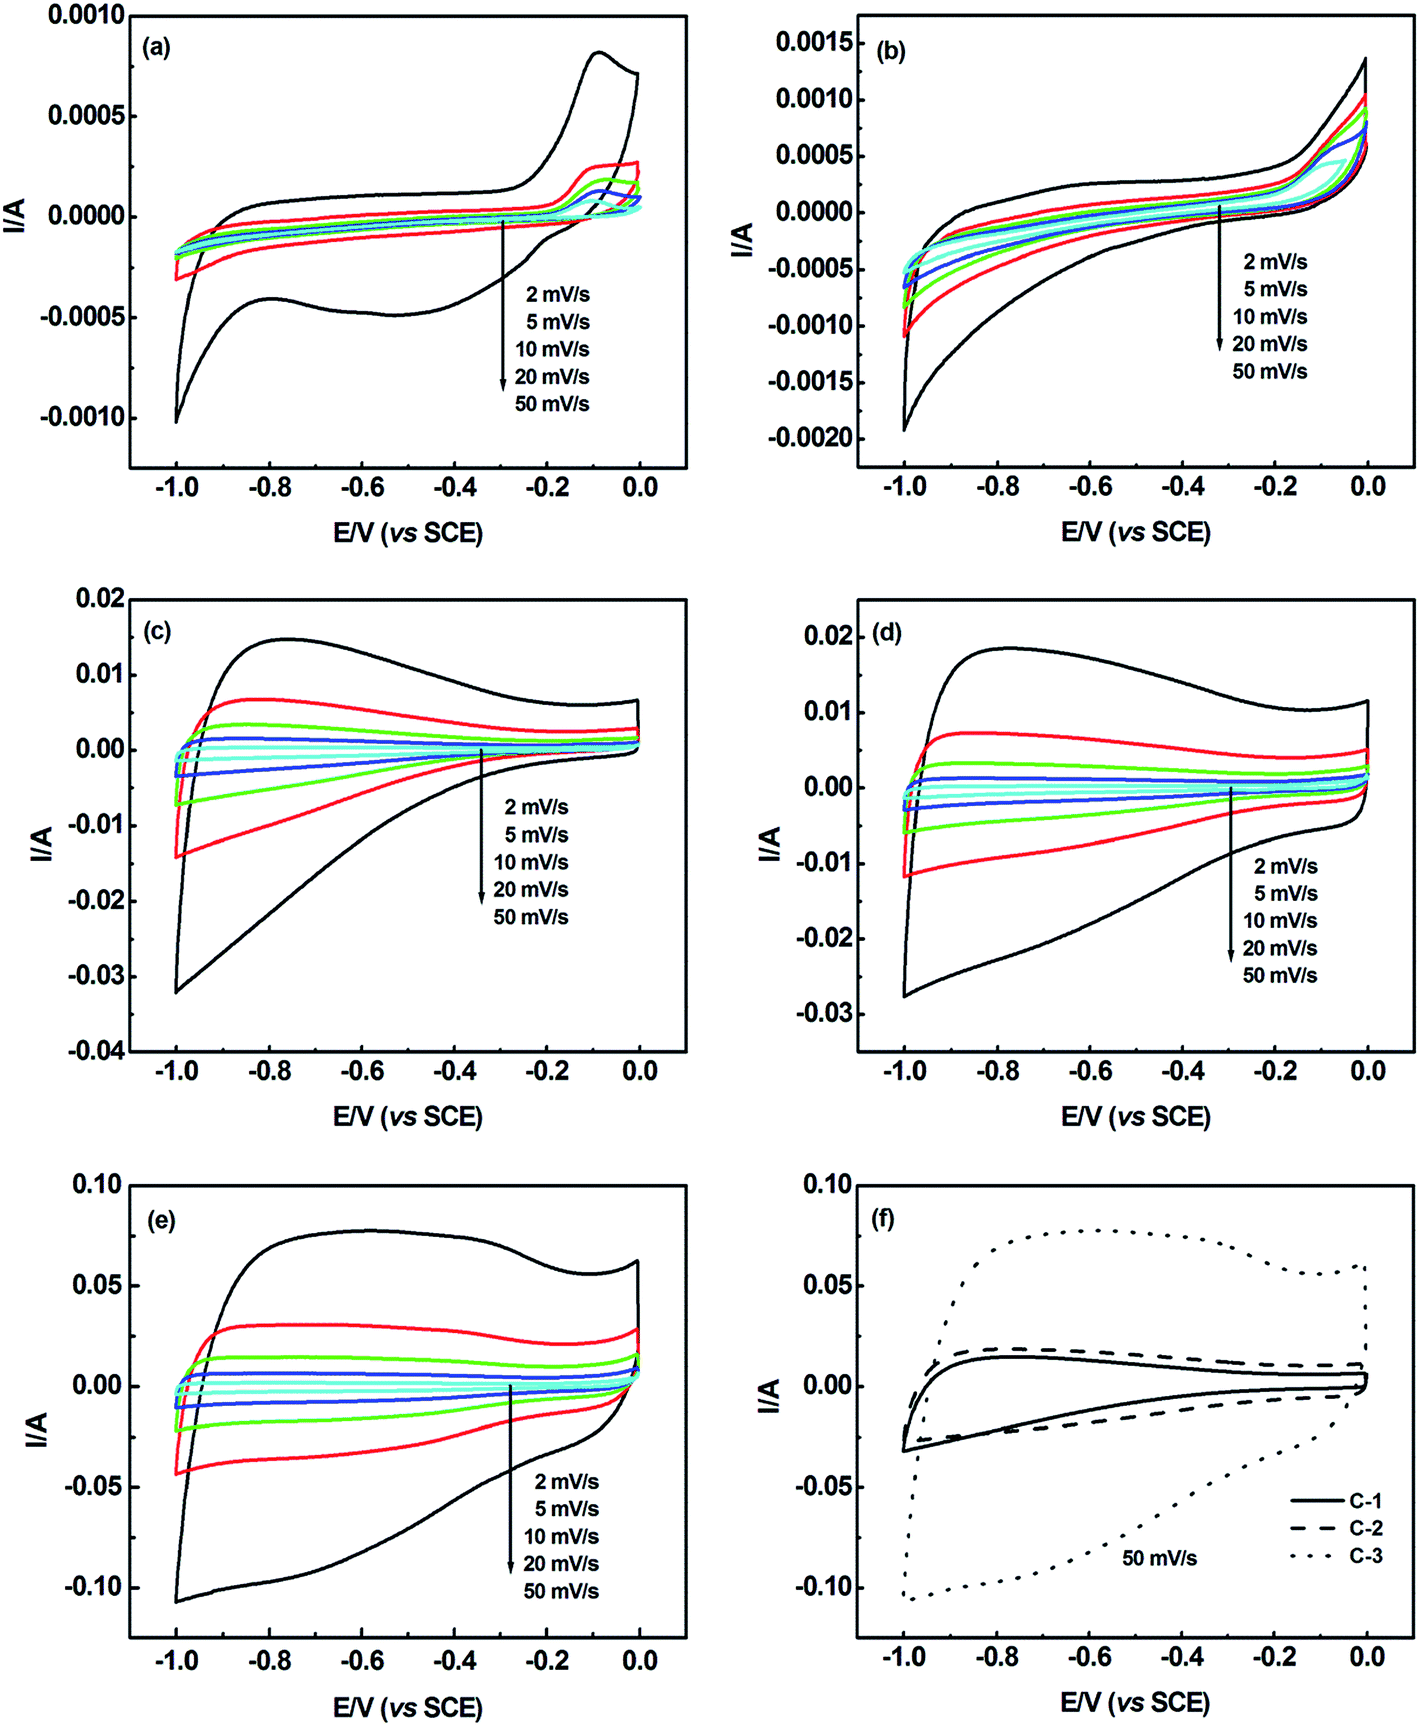 | ||
| Fig. 8 CV curves of (a) PVP fiber mats, (b) PFA resin, (c) C-1, (d) C-2 and (e) C-3 supercapacitors at different scan rates in the voltage range of −1.0 to 0 V, and (f) a comparison of three supercapacitors, C-1, C-2 and C-3, at the scan rate of 50 mV s−1 in the same voltage range. | ||
The specific capacitance and energy density (ΔG) of the three electrochemical capacitors are calculated as follows:
| Cm = C/m = It/(ΔVm) = (1/2)S/(ΔVΔVtm) |
| ΔG = (1/(2 × 3.6))CmΔV2 |
The specific capacitances of the PVP fiber mats, PFA resin, C-1, C-2 and C-3 were calculated from the CV curves. At scan rates of 2, 5, 10, 20 and 50 mV s−1, the specific capacitances of the PVP fibers are 0.3, 0.3, 0.3, 0.3 and 0.5 F g−1, respectively. The specific capacitances of the PFA resin are 1.8, 1.5, 1.0, 0.8 and 0.7 F g−1. The specific capacitances of C-1 are 68.4, 73.3, 73.0, 70.7 and 62.2 F g−1, respectively. The specific capacitances of C-2 are 72.0, 85.2, 96.6, 103.2 and 102.1 F g−1. Finally, for C-3, the specific capacitances are 137.0, 181.5, 199.4, 205.5 and 200.7 F g−1. The specific energy densities of 0, 0.1, 9.8, 14.3 and 28.5 Wh kg−1 corresponding to the PVP fiber mats, PFA resin, C-1, C-2 and C-3 were calculated according to the above formula within the voltage range of −1.0–0 V at the scan rate of 20 mV s−1. Summarizing the above results, it is obvious that the three as-prepared carbon materials show better electrochemical performance than the pure PVP fiber mats and PFA resin. Besides, C-3 possesses the highest specific capacitance due to the largest surface area, and C-1 has the lowest specific capacitance due to the smallest surface area. The above trend proves that not only the SSA but also the pore structure of the electrode materials influences the electrochemical behaviour. What’s more, C-1 possesses a lesser surface area and pore volume than C-2 and C-3. Also, C-3 has a greater surface area of mesopores whose size is above 3 nm, which could supply enough passages for electrolyte ions to transport than C-2, so that C-3 has a larger increase in specific capacitance. This confirms that the pore structure plays a more important role than the SSA in the supercapacitor performance.29,30
The EIS spectra of the three different materials are shown in Fig. 9, and all of the Nyquist plots exhibit a similar shape, with a semicircle in the high frequency region and a straight line in the low frequency region. As seen from the inset, the intercept of the semicircle with the horizontal axis (namely the real axis) in the high frequency region equals the solution resistance (Rs), which mainly results from the steric hindrance of the electrolyte ions. The semicircle diameter in the middle frequency region corresponds to the mass transfer resistance (RCT), which is mainly from the electron transfer resistance between the liquid and solid interface. The Rs values are about 0.17, 0.10 and 0.21 Ω for C-1, C-2 and C-3, respectively, and the RCT values are about 0.35, 0.40 and 0.39 Ω for C-1, C-2 and C-3, respectively. The results confirm that the solution resistance and the electron transfer resistance have no clear differences among the three materials; namely there is no obvious discrepancy among the three samples in the high and middle frequency regions. The straight line at the low frequency side is relative to the ion diffusion resistance of the electrode materials.31,32 Observed from the low frequency section, C-1 and C-2 have nearly the same slope and length, and C-3 has a bigger slope and shorter length, which means that C-1 and C-2 have a larger diffusion resistance, and that the C-3 supercapacitor is closer to being an ideal pure capacitive capacitor. Similar to the reason of the changing trend of the specific capacitance, this should also be a result of the higher proportion of mesopores of C-3 that are larger 3 nm, which are more efficient for ion transfer.
 | ||
| Fig. 9 Nyquist plots of C-1, C-2 and C-3 measured in the frequency range of 0.1–10000 Hz with the AC amplitude of 10 mV; the inset shows the magnified impedance plot of C-3 under the same conditions. | ||
Furthermore, the cyclic stability is of great significance for supercapacitors. Fig. 10 exhibits the specific capacitance vs. cycle number curves of the three samples in a 6 M KOH electrolyte, which were measured at the scan rate of 20 mV s−1. It is demonstrated that C-1, C-2 and C-3 have good cycling performance in KOH electrolyte, and 92%, 95% and 97% of the initial specific capacity of the three samples is maintained over 1500 cycles.
 | ||
| Fig. 10 Cycle-life plot of supercapacitors of carbon materials C-1, C-2 and C-3. | ||
Table 5 gives a comparison of the specific capacitance for various relevant carbon materials. C-3 is significantly higher than many other electrode materials that have been developed in recent years, and has a relatively high specific capacitance of 205.5 F g−1 at the scan rate of 20 mV s−1. Ultimately, the C-3 electrode material may be a promising material for supercapacitors.
| Main carbon source | Method | Specific capacitance/F g−1 | Reference |
|---|---|---|---|
| Phenolic resin | Electrospinning | 362, 256 | 33 and 35 |
| Polyacrylonitrile (PAN) | Electrospinning | 263.7, 170.2, 126.86, 91.95 | 34, 36, 37 and 39 |
| Furfuryl alcohol (FA) | Electrospinning | 205.5 | This study |
| Furfuryl alcohol (FA) | Acid catalysed polymerization | 100 | 38 |
Conclusions
In this work, porous carbon materials have been synthesized from poly(furfuryl alcohol) (PFA)/polyvinylpyrrolidone (PVP)/silica composite electrospun nanofibers through sol–gel, carbonization and etching procedures. The morphology and characterization of the nanofibers and the pore structures of the final carbon materials are evaluated by scanning electron microscopy, Fourier-transform infrared spectroscopy, transmission electron microscopy, N2 adsorption–desorption isotherm and X-ray diffraction etc. The results show that prolonging the etching time accelerates the rate of disappearance of electrospun nanofibers. The pore size distributions of C-1 and C-2 are broader than C-3, because C-3 has a centralized mesopore distribution. No matter what the electrospun solution component was, good electrochemical properties could be observed. Due to the larger surface area and increased number of passages for electrolyte ions to spread, C-3 has a greater specific capacitance than C-1 and C-2, up to 205.5 F g−1 at the scan rate of 20 mV s−1. Additionally, the C-3 supercapacitor exhibits a good cycling performance and retained 97% of the initial capacity over 1500 cycles at the scan rate of 20 mV s−1 within the applied potential range of −1.0–0 V. The characteristics of simple structure with worm-like pores, light weight and small volume of such an electrode material always result in a relatively low potential and capacitance, so that it can only act as the backup power supply for small appliances. However, the fact that the original material used for electrospinning is more expensive than activated carbons limits the commercial production of the electrode material.Acknowledgements
This work is supported by the International Science and Technology Cooperation Program of China (2012DFG91870, 2010DFA92820).References
- D. S. Tan, B. Liu, D. Chen and G. Z. Shen, RSC Adv., 2014, 4, 18391 RSC.
- A. Davies and A. P. Yu, Can. J. Chem. Eng., 2011, 89, 1342 CrossRef CAS.
- S. Sarangapani, B. Tilak and C. Chen, J. Electrochem. Soc., 1996, 143, 3791 CrossRef CAS PubMed.
- E. Frackowiak and F. Béguin, Carbon, 2001, 39, 937 CrossRef CAS.
- R. Kötz and M. Carlen, Electrochim. Acta, 2000, 45, 2483 CrossRef.
- C. Decaux, C. M. Ghimbeu, M. Dahbi, M. Anouti, D. Lemordant, F. Béguin, C. Vix-Guterl and E. Raymundo-Piñero, J. Power Sources, 2014, 263, 130 CrossRef CAS PubMed.
- H. Shi, Electrochim. Acta, 1996, 41, 1633 CrossRef CAS.
- D. Y. Qu and H. Shi, J. Power Sources, 1998, 74, 99 CrossRef CAS.
- H. T. Niu, J. Zhang, Z. L. Xie, X. G. Wang and T. Lin, Carbon, 2011, 49, 2380 CrossRef CAS PubMed.
- C. Ma, Y. Song, J. L. Shi, D. Q. Zhang, M. Zhong, Q. G. Guo and L. Liu, Mater. Lett., 2012, 76, 211 CrossRef CAS PubMed.
- E. Jo, J. G. Yeo, D. K. Kim, J. S. Oh and C. K. Hong, Polym. Int., 2014, 63, 1471 CrossRef CAS.
- L. C. Feng, N. Xie and J. Zhong, Materials, 2014, 7, 3919 CrossRef CAS PubMed.
- Y. Gao, V. Presser, L. F. Zhang, J. J. Niu, J. K. McDonough, C. R. Pérez, H. B. Lin, H. Fong and Y. Gogotsi, J. Power Sources, 2012, 201, 368 CrossRef CAS PubMed.
- D. Kawashima, T. Aihara, Y. Kobayashi, T. Kyotani and A. Tomita, Chem. Mater., 2000, 12, 3397 CrossRef CAS.
- Y. P. Zhai, B. Tu and D. Y. Zhao, J. Mater. Chem., 2009, 19, 131 RSC.
- G. L. Drisko, A. Zelcer, R. A. Caruso and G. J. Soler-Illia, Microporous Mesoporous Mater., 2012, 148, 137 CrossRef CAS PubMed.
- Y. M. Zhang, Z. Y. Yuan and Y. F. Zhou, Mater. Lett., 2013, 109, 124 CrossRef CAS PubMed.
- M. Peer, A. Qajar, R. Rajagopalan and H. C. Foley, Carbon, 2013, 51, 85 CrossRef CAS PubMed.
- L. Sun, C. J. Yan, Y. Chen, H. Q. Wang and Q. Y. Wang, J. Non-Cryst. Solids, 2012, 358, 2723 CrossRef CAS PubMed.
- Y. Zhang and A. L. Yarin, Langmuir, 2011, 27, 14627 CrossRef CAS PubMed.
- J. Y. Shen, M. J. Wang, Y. N. Wu and F. T. Li, RSC Adv., 2014, 4, 21089 RSC.
- M. Choura, N. M. Belgacem and A. Gandini, Macromolecules, 1996, 29, 3839 CrossRef CAS.
- R. L. Liu, Y. F. Shi, Y. Wan, Y. Meng, F. Q. Zhang, D. Gu, Z. X. Chen, B. Tu and D. Y. Zhao, J. Am. Chem. Soc., 2006, 128, 11652 CrossRef CAS PubMed.
- D. D. Asouhidou, K. S. Triantafyllidis, N. K. Lazaridis, K. A. Matis, S. S. Kim and T. J. Pinnavaia, Microporous Mesoporous Mater., 2009, 117, 257 CrossRef CAS PubMed.
- Y. Y. Zhao, H. Y. Wang, X. F. Lu, X. Li, Y. Yang and C. Wang, Mater. Lett., 2008, 62, 143 CrossRef CAS PubMed.
- H. G. Kang, Y. H. Zhu, J. H. Shen, X. L. Yang, C. Chen, H. M. Cao and C. Z. Li, Mater. Res. Bull., 2010, 45, 830 CrossRef CAS PubMed.
- Y. N. Wu, F. T. Li, Y. G. Wu, W. J. Jia, P. Hannam, J. L. Qiao and G. T. Li, Colloid Polym. Sci., 2011, 289, 1253 CAS.
- M. M. Teng, J. L. Qiao, F. T. Li and P. K. Bera, Carbon, 2012, 50, 2877 CrossRef CAS PubMed.
- X. J. He, P. H. Ling, M. X. Yu, X. T. Wang, X. Y. Hang and M. D. Zheng, Electrochim. Acta, 2013, 105, 635 CrossRef CAS PubMed.
- X. J. He, Y. J. Geng, J. S. Qiu, M. D. Zheng, X. Y. Zhang and H. F. Shui, Energy Fuels, 2010, 24, 3603 CrossRef CAS.
- C. R. Pérez, S. H. Yeon, J. Ségalini, V. Presser, P. L. Taberna, P. Simon and Y. Gogotsi, Adv. Funct. Mater., 2013, 23, 1081 CrossRef.
- J. L. Xue, Y. Zhao, H. H. Cheng, C. G. Hu, Y. N. Meng, H. B. Shao, Z. P. Zhang and L. T. Qu, Phys. Chem. Chem. Phys., 2013, 15, 8042 RSC.
- C. Ma, Y. J. Li, J. L. Shi, Y. Song and L. Liu, Chem. Eng. J., 2014, 249, 216 CrossRef CAS PubMed.
- Z. P. Zhou and X. F. Wu, J. Power Sources, 2013, 222, 410 CrossRef CAS PubMed.
- C. Ma, Y. Song, J. L. Shi, D. Q. Zhang, X. L. Zhai, M. Zhong, Q. G. Guo and L. Liu, Carbon, 2013, 51, 290 CrossRef CAS PubMed.
- Y. H. Hsu, C. C. Lai, C. L. Ho and C. T. Lo, Electrochim. Acta, 2014, 127, 369 CrossRef CAS PubMed.
- B. H. Kim, K. S. Yang, H. G. Woo and K. Oshida, Synth. Met., 2011, 161, 1211 CrossRef CAS PubMed.
- V. Ruiz and A. G. Pandolfo, Electrochim. Acta, 2010, 55, 7495 CrossRef CAS PubMed.
- B. H. Kim and K. S. Yang, J. Electroanal. Chem., 2014, 714–715, 92 CrossRef CAS PubMed.
| This journal is © The Royal Society of Chemistry 2014 |