Hui Zhaoa,
Daidi Tangab,
Jinsheng Zhao*b,
Min Wangb and
Jianmin Dou*b
aCollege of Chemical Engineering, China University of Petroleum (East China), Qingdao, 266580, P. R. China
bShandong Key Laboratory of Chemical Energy Storage and Novel Cell Technology, Liaocheng University, Liaocheng, 252059, P. R. China. E-mail: j.s.zhao@163.com; jmdou@lcu.edu.cn
First published on 6th November 2014
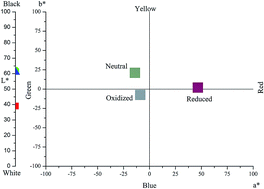
Two novel electrochromic monomers, 4,7-bis(4-methoxythiophen-2-yl)-[1,2,5]thiadiazolo[3,4-c]pyridine (MOTTP) and 4,7-bis(4-butoxythiophen-2-yl)-[1,2,5]thiadiazolo[3,4-c]pyridine (BOTTP), were synthesized and electropolymerized to give the corresponding polymers PMOTTP and PBOTTP, respectively. For the investigation of their electrochemical and electrochromic properties, the polymers were characterized using cyclic voltammetry (CV), UV-vis spectroscopy, step profiling, and scanning electron microscopy (SEM). The band gaps of the polymers were calculated based on spectroelectrochemical analysis, and were found to be 0.950 eV and 1.088 eV for PMOTTP and PBOTTP, respectively. Electrochromic investigations showed that PMOTTP and PBOTTP showed similar multichromic behaviors: saturated green color in the neutral state, highly transmissive blue in the oxidized state, and saturated red in the reduced state (red-green-blue, RGB). In addition, both polymers have excellent switching properties with more than 60% optical contrast in the NIR region and about a 0.5 s response time from neutral to oxide. Moreover, via electrochemical and spectral analyses both polymers were proven to be n-type dopable polymers. Hence, both polymers are promising materials to complete RGB electrochromic polymers for commercial applications.
Red, green and blue (RGB) are the three main colors for display technology since all other subtractive colors can be achieved by mixing these three.17 Among the RGB colors, neutral state green polymers with highly transmissive oxidized states are very difficult to obtain. This is because to obtain a neutral green polymer, two absorption bands are necessary, one in the red region of the spectrum, and the other in the blue region, leaving an absorption trough in the green region of the spectrum. Furthermore, the two absorption bands should be controlled with the same applied potential, and disappear simultaneously upon successive oxidation to give a bleached transmissive oxidation state.18 The band gaps of the neutral green to transmissive switching polymers are usually less than 1.2 eV, which can only be achieved by means of a donor–acceptor approach. Donor–acceptor systems lead to a narrower band gap because of resonances that enable a stronger double bond character between the donor and acceptor units.19 Since the report of the first neutral green polymer in 2004 (a soluble bithiophene-thienopyrazine copolymer from the Wudl group20 that had a non-transmissive oxidation state) a few green-to-transmissive polymers have been reported by the Reynolds group,21 the Toppare group,22 the Cihaner group,23 etc. These studies open the way for commercialization of electrochromic display devices. However, in the context of low cost and high performance display devices, the main demand is becoming to achieve multi-colored redox achievable states from a single polymer. To date, the examples of neutral state green polymeric materials have still been very rare,24 and examples with additional multicolor properties are welcome.
For the construction of D–A–D type monomers, ethylenedioxythiophene (EDOT) and thiophene derivatives are usually used as the donor units. Meanwhile, 1,2,3-benzotriazole, quinoxaline,25–27 thieno[3,4-b]pyrazine, 2,1,3-benzothiadiazole (BTD) and benzoselenadiazole (BSE)28 are the most preferred acceptor-type units. The [1,2,5]thiadiazolo[3,4-c]pyridine (PT) heterocycle has been employed as an electron-deficient unit in the synthesis of polymer photovoltaic materials and panchromatic organic sensitizers for dye-sensitized mesoscopic solar cells.29,30 Compared with the BTD unit, PT is a stronger acceptor20 due to the presence of the additional pyridine N-atoms.
The donor–acceptor type polymer (PTBT) synthesized with benzotriazole as the acceptor unit and thiophene as the donor unit displayed all three additive colors (RGB) at different oxidation states, and also showed both n- and p-dopable characteristics.31 The discovery of RGB displaying polymers make it possible for the construction of a single component electrochromic display device. Very limited progress concerning the synthesis of RGB displaying polymers has been made since the discovery of PTBT. By employing 3-alkoxy thiophene as the donor unit and PT as the acceptor unit, we report here the synthesis and electrochemical properties of two newly designed donor–acceptor type electrochromic polymers, poly[4,7-bis(4-methoxythiophen-2-yl)-[1,2,5]thiadiazolo[3,4-c]pyridine] (PMOTTP) and poly[4,7-bis(4-butoxythiophen-2-yl)-[1,2,5]thiadiazolo[3,4-c]pyridine] (PBOTTP). Both polymers are green in their neutral states, highly transmissive blue in their oxidized states, and saturated red in their reduced states. The effects of the length of the alkyl chains in the donor unit on the electrochemical and spectral behaviors of the resulting polymers are also discussed in detail.
:
1) gave 3,4-diamino-2,5-dibrompyridine as a white flocculent material (yield = 51%). Mp: 216–218 °C. 1H NMR (400 MHz, DMSO, δ/ppm): 7.53 (s, 1H, pyridic-H), 5.99 (s, 2H, N–H), 5.03 (s, 2H, N–H). 13C NMR (100 MHz, CDCl3, δ/ppm): 139.93, 139.13, 129.54, 126.67, 106.22. MS (C5N3Br2H5) m/z: calcd for 266.9; found 266.8. Anal. calcd for (C5N3Br2H5): C, 22.5; N, 15.7; Br, 59.9; H, 1.9. Found: C, 22.4; N, 15.7; Br, 60.0, H, 1.9.
:
1, v/v) to give a yellow solid. Mp: 115 °C. 1H NMR (300 MHz, CDCl3, δ/ppm): 8.552 (s, 1H, pyridic-H). 13C NMR (100 MHz, CDCl3, δ/ppm): 162.79, 160.88, 153.17, 139.18, 96.22. MS (C5SN3Br2H) m/z: calcd for 294.9; found 294.7. Anal. calcd for (C5SN3Br2H): C, 20.4; S, 10.9; N, 14.2; Br, 54.2; H, 0.3. Found: C, 20.3; S, 10.8; N, 14.3; Br, 54.3; H, 0.3.
:
2, v/v) to give MOTTP as a red solid (0.8 g, 67%). Mp: 186 °C. 1H NMR (400 MHz, CDCl3, δ/ppm): 8.77 (s, 1H, pyridic-H), 8.34 (d, 1H, thienyl-H), 7.77 (d, 1H, thienyl-H), 6.56 (d, 1H, thienyl-H), 6.42 (d, 1H, thienyl-H), 3.89 (d, 6H, –OCH3). 13C NMR (100 MHz, CDCl3, δ/ppm): 159.55, 159.17, 146.28, 140.50, 135.27, 123.34, 120.02, 103.19, 99.27, 57.56. MS (C13H11N3S3O2) m/z: calcd for 337.4; found 337.5. Anal. calcd for (C13H11N3S3O2): C, 46.3; N, 12.4; O, 9.5; S, 28.5; H, 3.3. Found: C, 46.5; N, 12.4; O, 9.4; S, 28.3; H, 3.4.
:
3, v/v) to give BOTTP as a red solid (0.76 g, 50%). Mp: 149 °C. 1H NMR (400 MHz, CDCl3, δ/ppm): 8.78 (s, 1H, pyridic-H), 8.38 (d, 1H, thienyl-H), 7.78 (d, 1H, thienyl-H), 6.55 (d, 1H, thienyl-H), 6.41 (d, 1H, thienyl-H), 4.03 (m, 4H, –OCH2), 1.81 (m, 4H, –CH2), 1.33 (m, 4H, –CH2), 0.99 (t, 6H, –CH3). 13C NMR (100 MHz, CDCl3, δ/ppm): 158.47, 154.97, 146.34, 139.66, 135.01, 123.89, 120.29, 103.62, 99.61, 70.22, 31.53, 19.47, 14.05. MS (C13H23N3S3O2) m/z: calcd for 349.5; found 349.4. Anal. calcd for (C13H23N3S3O2): C, 44.7; N, 12.0; O, 9.2; S, 27.5; H, 6.6. Found: C, 44.5; N, 12.1; O, 9.2; S, 27.7; H, 6.5.
:
1, by volume) solvent mixture containing 0.2 M tetrabutylammonium hexafluorophosphate (TBAPF6) as the supporting electrolyte and 0.005 M of the monomers. Voltammetry curves for the repeated scanning electropolymerization of MOTTP and BOTTP are shown in Fig. 1. The first cycle of the CV test corresponded to oxidation of the monomer and the onset oxidation potentials (Eonset) of MOTTP and BOTTP are 1.06 and 1.07 V, respectively. During the repetitive anodic potential scan, the generation of a new quasi-reversible redox couple (Eoxp = 0.77 V, Eredp = 0.62 V for MOTTP and Eoxp = 0.81, Eredp = 0.82 V for BOTTP) and the increase in the current intensity of this quasi-reversible redox peak indicated the formation of highly electroactive polymers on the surface of the working electrodes. The oxidation potential of MOTTP was lower than that of BOTTP since the electron donating effect of BOTTP decreased due to the sterically bulky groups introduced by the butyl chains , resulting in a less efficient overlap between the π-orbital of the oxygen atom and the conjugated system. It can thus be concluded that the redox reaction is highly sensitive to the steric and electronic effects of the substituent.35
![]() | ||
Fig. 1 Cyclic voltammogram curves of MOTTP (a) and BOTTP (b) in ACN–DCM (1 : 1) containing 0.2 M TBAPF6 at a scan rate of 100 mV s−1. | ||
The electrochemical behaviors of the polymer films (prepared on platinum wires by sweeping the potentials for three cycles) were characterized using CV at different scan rates between 25 and 300 mV s−1 in monomer-free electrolyte solution. The CV curves of PMOTTP and PBOTTP at different scan rates between 25 and 300 mV s−1 during the p-doping process are shown in Fig. 2a and b, respectively. A couple of redox peaks with an oxidation potential of 0.79 V and a reduction potential of 0.74 V were clearly observed during the p-doping process for PMOTTP. A couple of redox peaks for PBOTTP were located at 0.91 and 0.80 V. The scan rate dependence of the peak current density is illustrated in Fig. 2c. As seen in Fig. 2c, the peak current densities show a linear relationship as a function of scan rate for both polymers, which indicates that the electrochemical processes are not diffusion limited and are quasi-reversible even at high scan rates.8 The CV curves of PMOTTP and PBOTTP at a scan rate of 100 mV s−1 during the n-doping and p-doping processes are shown in Fig. 2d. A quasi-reversible p-style doping and a quasi-reversible n-style doping can be seen. In the reduction region, a sharp redox peak (Eoxp = −0.87 V, Eredp = −0.78 V for PMOTTP and Eoxp = −0.88, Eredp = −0.79 V for PBOTTP) is observed which indicates that the polymer has an n-dopable character. Furthermore, it is notable that the redox peaks of the n-doping/dedoping were much stronger than those of the p-doping/dedoping process. The results indicate that [1,2,5]thiadiazolo[3,4-c]pyridine (PT) is a strong electron acceptor and PMOTTP and PBOTTP are good n-type conjugated polymers. As clearly stated in literature,36 negatively doped waves in CV do not necessarily mean that a true n-type doping process is available. Hence, additional support must be given via spectroelectrochemistry studies.
The stability and robustness of the polymer films are quite important parameters for them to be amenable for use in numerous practical applications. The stability of each polymer film without purging the electrolyte solution with an inert gas was investigated in monomer-free electrolyte solution by applying potential pulses. The polymer films were prepared on Pt wires by sweeping the potentials for five cycles at 100 mV s−1 in an acetonitrile (ACN)–dichloromethane (DCM) (1
:
1, by volume) solvent mixture containing 0.2 M TBAPF6 and 0.005 M of the monomers, and their cyclic voltammograms were recorded with 1000 cycles at 200 mV s−1 in monomer-free electrolyte solution. The total charge involved during the electrochemical process was calculated for each voltammogram cycle. Fig. 3 shows the change in the CV curves for the PMOTTP and PBOTTP films between the 1st and 1000th cycles. As depicted in Fig. 3a, the loss of the total charge of PMOTTP was approximately 10% between the initial and 1000th cycles. For PBOTTP, the loss of the total charge was approximately 11% between the initial and 1000th cycles (see Fig. 3b). The stability test was carried out without the exclusion of air in order to test the environmental stability of the polymers, since the presence of air has been supposed to have a detrimental effect on the stability of materials.12 We suspect that the observed loss is most probably due to the degradation reactions catalyzed by the presence of oxygen and trace water in the environment. On the other hand, the electropolymerization procedure under environmental conditions may lead to the formation of oligomers, which impedes good film-forming properties and the adhesion to the substrate.
![]() | ||
Fig. 3 Electrochemical stability of PMOTTP (a) and PBOTTP (b) in monomer-free ACN–DCM (1 : 1) containing 0.2 M TBAPF6 after 1000 switching cycles by CV. | ||
:
1, by volume) solution containing 0.2 M TBAPF6 and 0.005 M of the relevant monomer on an ITO electrode with the same polymerization charge of 3.0 × 10⁻² C and were dedoped before characterization. The SEM images of these polymer films are shown in Fig. 4a. The PMOTTP film exhibits a compact morphology with a stack of granules. The diameters of the granules range from 4 to 24 μm. In contrast, the PBOTTP film exhibits an irregular coral-like porous structure grown with small granules, and the approximate diameters of the granules are in the range of 2–12 μm. These morphologies can facilitate the movement of doping anions into and out of the polymer film during the doping and dedoping processes, in good agreement with the good redox activity of the films.37
![]() | ||
| Fig. 4 SEM images of (a1) PMOTTP and (a2) PBOTTP, and step profiler images of (b1) PMOTTP and (b2) PBOTTP deposited potentiostatically onto ITO electrodes. | ||
The thickness and roughness of the polymer films were investigated using a step profiler. The thickness images are shown in Fig. 4b. As seen from Fig. 4b, the thicknesses of PMOTTP and PBOTTP were 830 nm and 1002 nm, respectively. The images of the step profiler measurements reveal that the polymer films have extremely rough surfaces with detectable pits, which is in good agreement with the morphologies shown in the SEM images. Fig. 4b also reveals that PMOTTP has a lower average roughness value compared to PBOTTP due to the compact morphology of PMOTTP.
![]() | ||
| Fig. 5 UV-vis absorption spectra of MOTTP and BOTTP in DCM. Inset: absorption spectra of the corresponding polymers deposited on ITO in their neutral states. | ||
The UV-vis absorption spectra of the neutral-state films are shown in the inset of Fig. 5. The location of the absorption maxima and intensity of the main π–π* peak give some insight into the polymer color. As seen from the inset of Fig. 5, both polymers presented two well-separated maximal absorption peaks in the visible region which were assigned to the strong π–π* transition and intramolecular charge transfer in the neutral state. The absorption peaks were located at 435 nm and 850 nm for PMOTTP and for PBOTTP were located at 432 nm and 848 nm, which are essential values for a neutral green state. A minimum absorption is observed at around 514 nm for PMOTTP, and the difference in the transmittances of the peaks at 435 and 850 nm is excellent for producing a highly saturated green color. PBOTTP exhibited a similar spectroelectrochemistry behavior. The Eg values of PMOTTP and PBOTTP based on λonset (1300 nm for PMOTTP, 1140 nm for PBOTTP) were calculated to be 0.95 eV and 1.088 eV, respectively (see Table 1). As shown in Table 1, PMOTTP has an apparent red shift in the low-energy absorption wavelengths and a lower band gap than PBOTTP. It is suggested that the introduction of the butyl group on the donor unit increased the repulsive steric effect on neighboring repeated units, which finally brought about a decrease in effective conjugation length in the homopolymer and a slightly higher band-gap.35 Moreover, the polymers experienced a red shift in the absorption maxima compared to the corresponding monomers, which is attributable to the inter-chain interaction caused by π-stacking of the polymers. The parameters of 4,7-bis(2,3-dihydrothieno[3,4-b][1,4]dioxin-7-yl)benzo[c][1,2,5]thiadiazole (PBDT)38 are also listed in Table 1 in order to compare it with the newly prepared polymers. In comparison, the optical band gaps of PMOTTP and PBOTTP are somewhat lower than that of PBDT which demonstrated that PMOTTP and PBOTTP were more outstanding D–A type conducting polymers than PBDT.38
| Compounds | Eonset (V) | λmax (nm) | vs. (Ag-wire) λonset (nm) | Ega (eV) | Egd (eV) | HOMOb (eV) | LUMOc (eV) |
|---|---|---|---|---|---|---|---|
| a Calculated from the low energy absorption edges (λonset), Eg = 1241/λonset.b HOMO = −e(Eonset + 4.4) (Eonset vs. SCE).c Calculated by the subtraction of the optical band gap from the HOMO level.d Eg is calculated based on DFT.e Data were taken from ref. 38. | |||||||
| MOTTP | 1.06 | 308 482 |
563 | 2.20 | 1.956 | −5.48 | −3.28 |
| BOTTP | 1.07 | 309 487 |
561 | 2.21 | 2.032 | −5.49 | −3.28 |
| PMOTTP | 0.039 | 435 850 |
1300 | 0.95 | — | −4.459 | −3.509 |
| PBOTTP | 0.035 | 432 848 |
1140 | 1.088 | — | −4.455 | −3.367 |
| PBDTe | — | 428 755 |
1043 | 1.191 | — | — | — |
To obtain the precise electrical band gaps of the monomers, DFT calculations were carried out on the density functional theory (DFT) level, employing the Gaussian 05 program. The ground-state electron density distributions of the highest occupied molecular orbital (HOMO) and lowest unoccupied molecular orbital (LUMO) are illustrated in Fig. 6. The values of the HOMO and LUMO are −5.627 and −3.666 for MOTTP, and −5.586 and −3.554 for BOTTP. The band gaps are calculated to be 1.956 and 2.032 for MOTTP and BOTTP respectively. These values were found to be lower than the values from the experimental data. This is mainly due to various effects, such as solvent effects, and to variation in the solid state compared to the gaseous states. However, the band gap of MOTTP based on DFT calculations is slightly lower than that of BOTTP, which is exactly consistent with the band gaps based on optical experiments.
![]() | ||
| Fig. 6 The ground-state electron density distributions of the highest occupied molecular orbital (HOMO) and lowest unoccupied molecular orbital (LUMO). | ||
In view of the device and high-performance display applications, the optical properties of the polymers should be manifested by using the changes in the optical absorption spectra under various voltage pulses. Potentiostatic deposition was performed in an ACN–DCM (1
:
1, by volume) solution containing 0.2 M TBAPF6 as a supporting electrolyte and 0.005 M of the monomers. The PMOTTP and PBOTTP films were electrodeposited onto ITO with the same polymerization charge of 2.0 × 10⁻² C at 1.20 V and 1.25 V, respectively. After polymerization, electrochemical dedoping was carried out at 0 V in monomer-free ACN–DCM (1
:
1, by volume) containing 0.2 M TBAPF6, and then the in situ electronic absorption spectra of the polymer films upon stepwise oxidation were investigated. Fig. 7 shows the spectroelectrochemistry and corresponding colors of the PMOTTP and PBOTTP films. As seen from Fig. 7, both polymers exhibited two transitions due to their donor–acceptor nature in the neutral state. The two transitions in the D–A type polymers were attributed to the transitions from the thiophene-based valence band to its antibonding counterpart (high-energy transition) and to the substituent-localized conduction band (low energy transition). Hence, interactions between donor and acceptor units (their match) determined the energy and intensity of these transitions.39 The intensities of the low energy transitions for the polymers are apparently higher than those of the corresponding high-energy transitions, as observed from the absorption peak in the visible region.
To further elucidate the optoelectronic properties of these thin polymer films, in situ spectroelectrochemical measurements were performed wherein the absorption spectra were measured as increasingly higher oxidizing potentials were applied across the polymer film. As shown in Fig. 7-a1, upon oxidation of the polymer PMOTTP, the intensity of the absorption of the two π–π* transition bands (centered at 435 and 850 nm) started to decrease simultaneously with a concomitant increase in the near-IR region (beyond 1400 nm), indicating the formation of polarons40 and bipolarons.41 In the fully oxidized state of the polymer PMOTTP (1.2 V), the newly formed lower energy electronic transitions lie sufficiently outside the visible region with little tailing from the NIR, which makes the polymer present a highly transmissive blue color in the oxidized states. In this case, PMOTTP can switch between the neutral green color to the highly transmissive blue color in the oxidized state. As shown in Fig. 7-b1, the PBOTTP film experienced a similar trend in change to that of PMOTTP as the potential stepped from 0 V (neutral state) to 1.25 V (oxidized state). The UV-vis spectra for PMOTTP and PBOTTP (Fig. 7) display well-defined isosbestic points at approx. 564 nm and 558 nm, respectively, indicating that the PMOTTP and PBOTTP polymers were being interconverted between two distinct forms on both occasions: the neutral form and radical cation.39
Conducting polymers with stable negatively doped states receive tremendous interest, since a more complicated device structure such as those of LEDs3 and ambipolar field effect transistors can be attained with these materials. In addition to reduction waves in CV, evidence for charge carrier formation upon reduction should also be studied by spectroelectrochemistry. Absorption spectra of the polymers at the reduction potential of −1.6 V were investigated to characterize the optical changes that occurred during the n-doping process and prove the introduction of charge carriers to the conjugated systems in the n-doped state. As shown in Fig. 7, upon the switch from the neutral to the reduced state, several similar changes have been seen for the UV-vis-NIR spectra of the two polymers, including a moderate absorption increase in the NIR region, a weakening or even disappearance of the absorption band at around 850 nm, a red-shift in the π–π* transition band, and the appearance of apparent and well-defined absorption peaks at around 500 nm in the visible region. The maximum absorption peaks were centered at 508 nm and 512 nm for PMOTTP and PBOTTP, respectively, which gives rise to a saturated red color in the reduced states of the polymers. Hence, with the strong absorption changes in the NIR region and the CV waves observed at negative potentials, it is clear that both PMOTTP and PBOTTP are displaying true n-type doping processes.37 It is interesting that these polymers are unique in the literature to date with their highly saturated green color in the neutral state, highly transmissive blue colour in the oxidized state and saturated red colour in the reduced state. To further establish the colors of the polymers, the colorimetric properties were characterized using CIE1976 color space (L*a*b*). The values of the relative luminance (L), hue (a) and saturation (b) were measured in the neutral, oxidized and reduced states of the polymers and are summarized in Table 2.
| Polymers | E, vs. (Ag wire) (V) | L | a | b | Colors |
|---|---|---|---|---|---|
| PMOTTP | 0 | 61 | −9 | 11 | Saturated green |
| 1.2 | 60 | −5 | −4 | Transmissive blue | |
| −1.6 | 42 | 43 | −1 | Red | |
| PBOTTP | 0 | 63 | −17 | 13 | Saturated green |
| 1.25 | 60 | −4 | −1 | Transmissive blue | |
| −1.6 | 43 | 25 | 2 | Red |
:
1, by volume) solution containing 0.2 M TBAPF6 as a supporting electrolyte. The optical contrasts, response times and coloration efficiencies of PMOTTP, PBOTTP and PBDT based on electrochromic switching at different given wavelengths are shown in Table 3. PBDT was used for comparison with the new polymers. The optical contrast (ΔT%), one of the crucial factors in appraising an electrochromic material, is defined as the percent transmittance change at a specified wavelength between the redox states. Fig. 8 shows the electrochromic switching properties of PMOTTP between 0 and 1.2 V and PBOTTP between 0 and 1.25 V at two different wavelengths in both visible and NIR regions. The optical contrasts of PMOTTP (24% at 430 nm, 70% at 1550 nm) and PBOTTP (32% at 435 nm, 61% at 1500 nm) are satisfactory. Compared with the structural analogue polymer PBDT, the newly prepared polymers have comparable optical contrasts in both the visible and the NIR region. The outstanding optical contrast in the NIR region is a very significant property for many NIR applications. After 1000 cycles of switching, the polymers kept working without significant loss in the percent transmittance contrast value. This indicated that the polymers have quite high optical stabilities, retaining 96% at 430 nm and 97% at 1550 nm for PMOTTP and 94% at 435 nm and 95% at 1500 nm for PBOTTP after 1000 cycles of switching.
Response time, another of the most important characteristics of electrochromic materials, is the necessary time for 95% of the full optical switch to occur (after which the naked eye could not sense the color change).42 PMOTTP has excellent switching times from neutral to oxide of 0.439 s at 430 nm and 0.438 s at 1550 nm. PBOTTP has comparable switching times of 0.510 s at 435 nm and 0.550 s at 1500 nm. In comparison, it can be easily found that the PMOTTP film showed a slightly faster switch time than that of PBOTTP. The faster switching response could be ascribed to the faster dopant ion diffusion during the switch time of the new polymers, which is faster than that of PBDT in NIR region and is comparable in the visible region.
The coloration efficiency (CE) is also an important characteristic for electrochromic materials, which is defined as the relation between the injected/ejected charge as a function of electrode area (ΔQ) and the change in optical density (ΔOD) at a specific dominant wavelength (λmax) as illustrated by the following equation:40
Footnote |
| † Electronic supplementary information (ESI) available: 1H NMR and 13C NMR spectra of the intermediates and target compounds. See DOI: 10.1039/c4ra11628c |
| This journal is © The Royal Society of Chemistry 2014 |