DOI:
10.1039/C4RA11586D
(Paper)
RSC Adv., 2015,
5, 3215-3223
One-step template-free electrodeposition of novel poly(indole-7-carboxylic acid) nanowires and their high capacitance properties†
Received
1st October 2014
, Accepted 4th December 2014
First published on 4th December 2014
Abstract
Poly(indole-7-carboxylic acid) (PICA) nanowires with conductivity of 5 × 10⁻² S cm−1 were prepared by a facile, one-step and template-free electrodeposition method. The hydrogen bond interactions between the N–H group and the carboxyl group facilitated the formation of PICA nanowires. The diameter of the PICA nanowires was about 40 nm confirmed by scanning electron microscopy. Fourier transformation infrared spectroscopy and 1H NMR spectroscopy confirmed that the polymerization occurred at the C2 and C3 position on the indole ring. The electrochemical capacitance properties of the PICA nanowires were investigated with cyclic voltammetry, galvanostatic charge–discharge, and electrochemical impedance spectroscope techniques. A remarkable specific capacitance of 373.2 F g−1 was obtained at a current density of 2.5 A g−1 in 1.0 M H2SO4 solution. PICA nanowires presented an excellent cycle life with 91% specific capacitance retention after 1000 charge–discharge processes. The energy density of the symmetric full cell based on two PICA electrodes was 7.03 W h kg−1 at a power density of 4500 W kg−1. These results implied that the PICA nanowires will be a promising electrode material for supercapacitors.
Introduction
Conducting polymers (CPs) as electrode materials of supercapacitors including polyaniline (PANI), polypyrrole (PPy), poly(3,4-ethylenedioxythiophene) (PEDOT) and their derivatives have been investigated intensely due to their high specific capacitance and low cost.1–8 The size and structural morphology of nano-material are known to have a significant effect on enhancing the performance of capacitance, and controlled nanostructures are thereby essential for achieving efficient electrode materials used in supercapacitors. From this perspective, CPs electrode materials with a variety of morphology have been explored, such as nanorods,9 nanocones,10 nanotubes,11,12 nanofibrous network13,14 and nanowires.15–17 However, the reported synthesis of the nano-materials involved complicated preparation processes and costly materials.
Among the reported methods to prepare various nano-architectures, the hydrogen bond interaction is regarded as a main driving force in forming three-dimensional nano-scaled CPs.18 This method is simpler relative to the hard template method owing to omitting the membrane as a hard template and the post-treatment of removing template. As a new class of CPs, polyindole family is of much interest because of its several advantages, especially fairly good thermal stability and high redox activity and stability.19–22 The most attractive properties of polyindole are that the properties and structural morphology can be tuned by various functional groups.23–25 Poly(indole-7-carboxylic acid) (PICA), which contains an electron-withdrawing carboxyl group in the 7-position of indole ring, is a new interesting CPs. Due to the presence of carboxyl group, the intermolecular hydrogen bond benefits the formation of CPs nanostructures,25 which provides a simple method to prepare the electrode material of nanostructural CPs. At the same time, as the electrode material of supercapacitors, it is very significant and necessary to study the performance of PICA because the presence of carboxyl group on polyindole backbone has additional advantages as follows. Firstly, the electron-withdrawing carboxyl group substitution can decrease the LUMO level of polymers, diminishing their band gap.26,27 Secondly, the stability and capacitance performance of such electrode are possibly preferable due to the presence of carboxyl group.28–31 Thirdly, the N–H group and carboxyl group on indole unit form intramolecular/intermolecular hydrogen bonds, viz. possibly several hydrogen bond interactions (Scheme 1),32 directly affect electrochemical properties of the resulting polymers since such an interaction changes the structure of polymer molecule.33,34
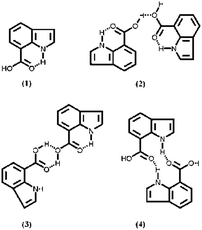 |
| | Scheme 1 Several possibly hydrogen bond interactions for indole-7-carboxylic acid. | |
In the present work, novel PICA nanowires have been prepared by a facile, one-step and template-free electrodeposition method. The structural characterization, morphology and thermal stability of the as-formed PICA films were investigated. And the capacitive behaviors and performances of as-prepared PICA were also tested by cyclic voltammetry, galvanostatic charge–discharge and electrochemical impedance spectroscopy techniques.
Experimental
Materials
Indole-7-carboxylic acid (ICA, analytical-grade) and indole-6-carboxylic acid (analytical-grade) were purchased from Shanghai Vita Chemical Reagent Co., Ltd. China. Acetonitrile (ACN), dimethyl sulfoxide (DMSO) and deuterium substituted dimethyl sulfoxide (CD3SOCD3) were purchased from Beijing Chemical Plant, China and used after reflux distillation. Sulfuric acid (98%, Jinan Chemical Reagent Co.) was used as received without further purification. Dopant salt LiClO4 was used as received. Doubly distilled water was used throughout the work.
Apparatus
The electrochemical experiments were carried out using a CHI 660B potentiostat/galvanostat (Shanghai Chenhua Instrumental Co., Ltd., China). Glass carbon (GC) electrode as the substrate electrode was purchased from Tianjin Aidahengsheng Technology Co., Ltd. China. For the GC electrode, only one surface of the glassy carbon disc (3 mm diameter, 0.07 cm2 surface area) was exposed, other places and edge of the glassy carbon were sealed with Teflon. The counter electrode and the reference electrode were platinum wire (1 mm diameter) and saturated calomel electrode (SCE), respectively. Infrared spectra were recorded with a Bruker Vertex 70 Fourier transform infrared (FT-IR) spectrometer with samples in KBr pellets. The 1H NMR spectra were recorded on a Bruker AV 400 NMR spectrometer. UV-Vis spectra were measured with a Perkin-Elmer Lambda 900 ultraviolet-visible-near-infrared spectrophotometer. For UV-Vis analysis, the polymer was dedoped with 25% ammonia for 3 days and then washed repeatedly with doubly distilled water, finally, it was dried in vacuo at 60 °C for 24 h. Thermogravimetric analysis (TGA) was performed with a Pyris Diamond TG/DTA thermal analyzer (Perkin-Elmer). Scanning electron microscope (SEM) measurements were carried out by using scanning electron microscope (JSM-5600, JEOL). Impedance spectra were performed by using a 5210 lockin amplifier (Princeton Applied Research) coupled with a PAR 263A potentiostat. An AC amplitude of 10 mV was used and the data were collected in the frequency range 105 to 10−2 Hz. The conductivity of as-formed PICA film was measured on a pressed pellet of the polymer by the conventional four-probe technique where copper was used as the electrode and silver conducting gel was used to fix the copper wire on the polymer.
Electrode preparation
Before electrodeposition, GC surface was polished with 0.3 μm alumina slurry, and then rinsed thoroughly with doubly distilled water in ultrasonic bath. Generally, high quality polymer films can be prepared by the potentiostatic method, such as polyaniline,35 polythiophenes,36 polyindole and its derivatives,37,38 etc. Therefore, in order to characterize the properties of polymer films, the potentiostatic method was used to prepare polymer films. The polymer films were grown potentiostatically on GC substrates at 1.2 V in ACN solution containing 50 mM ICA and 0.1 M LiClO4, the chronoamperometric curve was shown in Fig. S1.† The mass of polymer films (Wp) was calculated according to eqn (1):23| |
 | (1) |
Here, Wp is calculated by using the charge (Qdep), assuming a 100% current efficiency (η) (the total charge passed through the cell during the polymer film growth process). M is the molecular weight of ICA, F is the Faraday constant (96![[thin space (1/6-em)]](https://www.rsc.org/images/entities/char_2009.gif) 485 C mol−1). Z is the number of electrons transferred per monomer attached to the polymer, in which Z = 2 + f.39,40 The partial charge f is called the doping level, the calculated f was about 0.23, assuming a 100% current efficiency, according to eqn (2):40
485 C mol−1). Z is the number of electrons transferred per monomer attached to the polymer, in which Z = 2 + f.39,40 The partial charge f is called the doping level, the calculated f was about 0.23, assuming a 100% current efficiency, according to eqn (2):40
| |
 | (2) |
where
Qd is the total charge used for PICA deposition, and
Qo is the total charge of oxidized species in the PICA films (Fig. S2
†).
In order to validate the reproducibility of mass through calculation of eqn (1), we used Pt sheet with a surface area of 5 cm2 as working electrode to obtain a sufficient amount of polymer for weighing. Note that the electrodeposition time was well controlled and the solution of ACN containing ICA was always colorless during the controlled potentiostatic process. The Pt sheet coated polymer films were dried under vacuum at 60 °C for 24 h after washing repeatedly. The mass of PICA deposited on Pt sheet was weighed out using a micro-analytical balance. The calculated standard deviation is 3.8% through five parallel experiments. Fig. S3† shows the deposition mass vs. deposition charge for PICA nanowires at 1.2 V. Their liner relationship was y = 0.702x − 0.0921 (R2 = 0.993). According to the comparison of the adjusted slope, the mass calculated through eqn (1) is about 8.2% higher than that obtained by weighing method. In this paper, the mass calculated through eqn (1) was used to obtain the specific capacitance.
Capacitance calculation
Specific capacitance values (C) of the materials were calculated from cyclic voltammograms by means of eqn (3):41,42| |
 | (3) |
where E1 and E2 are the cutoff potentials in cyclic voltammetry, i(E) is the instantaneous current, 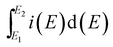 is the total voltammetric charge obtained by integration of the positive and negative sweeps in the cyclic voltammograms, v is the scan rate, and m is the mass of the individual sample.
When the charge–discharge method was used, the specific capacitance can be calculated according to the eqn (4):43
| |
 | (4) |
where
C is specific capacitance (F g
−1),
I and
t are the discharge current and time, respectively,
V is the potential range, and
m is the mass of PICA.
For the symmetric full cell based on two PICA electrodes, the power density (P, W kg−1) and energy density (E, W h kg−1) values can be calculated by the following relationships.44
| |
 | (5) |
| |
 | (6) |
where,
C is the specific capacitance of the symmetric full cell (Fig. S4
†),
V is the voltage window (V), and Δ
t is the discharge time.
Results and discussions
Cyclic voltammograms of ICA
The successive cyclic voltammograms (CVs) of monomer are usually used to determine the electrochemical polymerization process of monomer and redox process of its polymer. Fig. 1 shows the successive CVs of 0.05 M ICA in ACN containing 0.1 M LiClO4 at 50 mV s−1. The processes involved were the oxidation of the monomer and the polymer in the positive scan, and the reduction of the polymer during the negative scan. The broad peaks were attributed to the redox processes of polymer, and the large increase in anodic current at the positive potential was ascribed to the electropolymerization reaction of monomer. As seen from the first scan, the oxidation of ICA started at 1.18 V versus SCE. Subsequently, a polymer film was formed on the working electrode surface. The increase in the redox wave currents implied that the amount of the polymer on the electrode was increasing.
 |
| | Fig. 1 Cyclic voltammograms of 0.05 M ICA in ACN containing 0.1 M LiClO4 at a scan rate of 50 mV s−1 (j = current density). | |
Structural characterizations
In order to obtain substantial polymer films, Pt sheet with a surface area of 5 cm2 was employed as working electrode and the electrodeposition time was kept for 4 hours, the chronoamperometric curve was showed in Fig. S5.† When the initial deposition time was within 10 min, the solution of ACN containing ICA was colorless and PICA polymer was completely deposited on the surface of electrode. When the growth time was prolonged, oligomers were formed and started to dissolve into solution, which induced the solution color gradually change and finally become dark. This was because the electrical resistance of as-formed polymer film increased when polymer films increased to certain thickness, which resulted in the formation of oligomers with short chain. In Fig. 1, the potential shift of the wave current maximum provides information about the increase of the electrical resistance in the polymer film and the over-potential needed to overcome the resistance.45 The resistance increase of the electrode makes against the oxidation of monomer, namely, the high resistance of the electrode leads to the decrease of monomer oxidation rate that can be observed from Fig. S5.† According to literature,46 the applied potential steers the chain length of the resulting product. Low oxidation potential will produce short chain lengths due to the fact that the oxidation level of the intermediates is low.46 Therefore, the resistance increase in polymer film leads to the formation of oligomers with shorter chains.
The PICA film in the dedoped state was green and thoroughly soluble in DMSO, tetrahydrofuran and partly soluble in ethanol and acetone. Therefore, the UV-Vis spectra of ICA and dedoped PICA dissolved in DMSO were examined, as shown in Fig. 2. The ICA monomer showed strong absorption at 244 nm and 313 nm (Fig. 2a). On the contrary, the spectrum of dedoped PICA films showed a strong absorbance at 263 nm and a broad absorption in the range of 300–450 nm with several absorptions at 346 nm, 373 nm, 409 nm and 430 nm (Fig. 2b). Generally, a longer absorption wavelength in spectra usually indicates a longer polymer sequence. Therefore, these spectral results confirmed the formation of a conjugated polymer with a broad molar mass distribution.
 |
| | Fig. 2 UV-Vis spectra of ICA (a) and dedoped PICA (b) in DMSO. | |
Vibrational spectra can provide structural information on conducting polymers. The comparison of the evolution of the vibrational modes appearing in conducting polymers and monomer usually facilitates the interpretation of polymerization mechanism. The typical transmission FT-IR spectra of ICA monomer and PICA are shown in Fig. 3. The intense band at 1680 cm−1 was related to the stretching vibration of the C![[double bond, length as m-dash]](https://www.rsc.org/images/entities/char_e001.gif) O group (Fig. 3A), which shifted to 1684 cm−1 in the polymer (Fig. 3B). The broad band at 2535 cm−1 corresponded to –OH stretching vibration and shifted to 2549 cm−1. In addition, the band at 943 cm−1 was the characteristic absorption of –OH out-of-plane deformation, which shifted to 949 cm−1 for polymer. And then, the band at 1442 cm−1 was pertinent to C–O stretching vibration, which shifted to 1422 cm−1 in the spectrum of PICA film. The band at 1115 cm−1 was the vibrational modes of the dopant ClO4− in polymer. Two bands at 752 cm−1 and 756 cm−1 in the spectra of both monomer and polymer film, which were assigned to the three adjacent C–H deformation vibration of ring hydrogens on benzenic ring, respectively, suggested that benzene ring on PICA unit was 1,2,3-tri-substitution. This proved that the polymerization of ICA occurred at the pyrrole ring. In addition, the narrow peak of N–H bond at 3425 cm−1 observed in the monomer was the characteristic absorption of the N–H bond, which was broader and shifted to 3430 cm−1 in the spectrum of PICA. This band, together with the band at 1603 cm−1, was ascribed to the elongation and the deformation vibrations of the N–H bond, respectively. This result implied that there were still N–H bonds on the PICA main chain. Thus, nitrogen species could not be the polymerization sites, and polymerization should happen at the C2 and C3 positions.
O group (Fig. 3A), which shifted to 1684 cm−1 in the polymer (Fig. 3B). The broad band at 2535 cm−1 corresponded to –OH stretching vibration and shifted to 2549 cm−1. In addition, the band at 943 cm−1 was the characteristic absorption of –OH out-of-plane deformation, which shifted to 949 cm−1 for polymer. And then, the band at 1442 cm−1 was pertinent to C–O stretching vibration, which shifted to 1422 cm−1 in the spectrum of PICA film. The band at 1115 cm−1 was the vibrational modes of the dopant ClO4− in polymer. Two bands at 752 cm−1 and 756 cm−1 in the spectra of both monomer and polymer film, which were assigned to the three adjacent C–H deformation vibration of ring hydrogens on benzenic ring, respectively, suggested that benzene ring on PICA unit was 1,2,3-tri-substitution. This proved that the polymerization of ICA occurred at the pyrrole ring. In addition, the narrow peak of N–H bond at 3425 cm−1 observed in the monomer was the characteristic absorption of the N–H bond, which was broader and shifted to 3430 cm−1 in the spectrum of PICA. This band, together with the band at 1603 cm−1, was ascribed to the elongation and the deformation vibrations of the N–H bond, respectively. This result implied that there were still N–H bonds on the PICA main chain. Thus, nitrogen species could not be the polymerization sites, and polymerization should happen at the C2 and C3 positions.
 |
| | Fig. 3 FT-IR spectra of ICA (A) and doped PICA (B) obtained potentiostatically at 1.2 V. | |
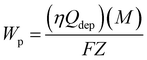
In order to get deep insight into the polymer structure and the polymerization mechanism of ICA, the 1H NMR spectra of ICA and PICA were recorded (Fig. 4 and Fig. S6†). Compared with the monomer (Fig. 4A), the corresponding proton lines in the conjugated polymer were much broader (Fig. 4B), which was possibly caused by the wide molar mass distribution of PICA and/or the changes in proton spin-lattice relaxation. According to the literature,47 the multiplicities of the remaining signals were consistent with the expansions from some of the more complex signals arising from the spectra. In Fig. 4B, the chemical shifts of 12.77 and 12.68 were assigned to the protons of carboxylic group, and the chemical shift of 12.14 was ascribed to the N–H bond in PICA. This meant that the COOH group and N–H bond were still present on the main chain of the polymer, in well accordance with the FTIR results. At the same time, the proton peaks of the COOH group and N–H bond were different from those of poly(indole-5-carboxylic acid).48 This was possibly ascribed to the more complex structure of PICA due to the presence of the intramolecular/intermolecular hydrogen bonds (Scheme 1). In addition, the peaks between δ 9.15 and δ 8.42 were derived from the proton in the C4 of the benzene ring, the peaks between δ 8.20 and δ 7.94 were the protons in the C6 of the benzene ring, and the peak at δ 7.47 arose from the protons in the C5 of the benzene ring. In the spectrum of the monomer, the two peaks at δ 7.11 and δ 6.54 were the protons in the C2 and C3 of the pyrrole ring, respectively, which were disappeared in the spectrum of PICA. All these peaks in the spectrum of the polymer proved the electropolymerization of ICA occurred at C2 and C3 positions. In view of the presence of the hydrogen bonds, the probable structures of PICA were assumed (Scheme 2).
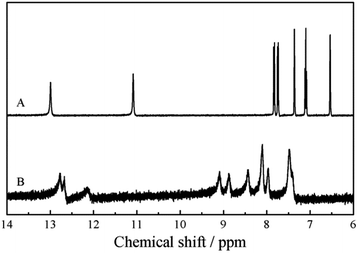 |
| | Fig. 4 1H NMR spectra of ICA (A) and dedoped PICA (B) in CD3SOCD3. | |
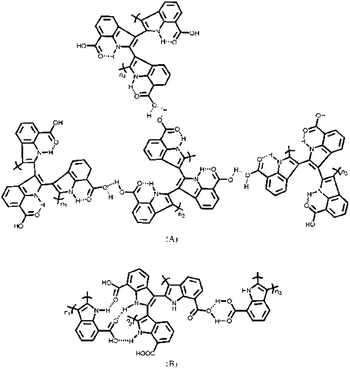 |
| | Scheme 2 The probable two structures (A and B) of PICA obtained via the coupling of the monomer at C2 and C3 positions. | |
Thermal analysis
The thermal stability of conducting polymers is very important for their potential application. TGA is a significant dynamic way of detecting the degradation behaviors. The weight loss of a polymer sample was measured continuously under a nitrogen stream in the temperature range of 300–1100 K, whereas the temperature was changed at a constant rate of 10 K min−1. As seen from Fig. 5, TGA curve had a four-step weight-loss behavior. Before 420 K, the weight losses of the polymer were about 5.2%, possibly due to the evaporation of water or other moisture trapped in the polymer. The decomposition between 420 K and 625 K was 12.7%, which was possibly caused by the degradation of doping ions. There was a prominent decomposition between 625 K and 695 K, up to 20.5%, which was attributed to the degradation of –COOH group.48 However, the weight loss was 10.6% from 695 K to 1100 K. These results indicated the good thermal stability of PICA nanowires.
 |
| | Fig. 5 TG curves of doped PICA films obtained potentiostatically at 1.2 V. | |
Morphology and conductivity
Generally, hetero-cycle compounds possessing the strong hydrogen bond interaction may form well three-dimensional nano-scaled CPs. We know that polyindole and its derivatives without hydrogen bond interaction are difficult to produce nanostructure, for example, polyindole,49 poly(5-methoxyindole),50 poly(5-methylindole),51 poly(5-nitroindole),38 poly(5-bromoindole).52 However, carboxyl-substituted polyindole can produce nanostructures because of the presence of intermolecular hydrogen bond.25 PICA nanowires were easily prepared by a potentiostatic method at room temperature. It was further proved that the hydrogen bonds between the molecules benefited the formation of CPs nanostructure. As-obtained PICA nanowires adhered strongly to the electrode. The dynamic growing processes of the PICA nanowires were characterized by time-coursed SEM measurements (Fig. 6A–D). The deposited masses of PICA were 0.19 μg, 0.69 μg, 6.6 μg and 12.7 μg for 1 s, 3 s, 25 s and 50 s, respectively. It was found that the small particles were initially formed at the earlier stages (Fig. 6A), which acted as the nuclei for subsequently producing PICA nanowires. When the deposition time was 3 s, many short nanowires started to form (Fig. 6B). Further prolonging the growth time to 25 s, the PICA nanowires stacked and intertwisted (Fig. 6C). After 50 s, the PICA nanowires became dense (Fig. 6D). The SEM showed that average diameter of PICA nanowires was about 40 nm, and the cumulus and intertwist of PICA nanowires resulted in the formation of a heterogeneous and porous morphology. As the supercapacitors electrode, this morphological structure showed following advantages: (1) the micro-sized pores help de-polarisation of the ion concentration and hence a high speed of charge–discharge, and the nano-sized pores result in a high interfacial area and therefore a high specific capacitance. (2) The porous network PICA creates efficient diffusion paths for electrolyte ions, which would significantly accelerate intercalation of ions and enhance utilization rate of electrode materials.
 |
| | Fig. 6 SEM images of PICA nanostructures electrodeposited for 1 s (0.19 μg) (A), 3 s (0.69 μg) (B), 25 s (6.6 μg) (C) and 50 s (12.7 μg) (D). | |
The conductivity of pressed PICA pellets was measured to be 5.0 × 10⁻² S cm−1, which was higher than the values of poly(indole-5-carboxylic acid) reported previously (1.0 × 10⁻² S cm−1 and 3.16 × 10⁻³ S cm−1).48,53
Electrochemical properties of PICA electrode
The electrochemical behavior of the PICA electrode was studied in 1.0 M H2SO4 solution at different potential scan rates (Fig. 7A). Two redox processes of PICA were well defined, viz., the first process appeared in the potential region about 0.8 V and below, and the second process was in the potential region about 0.8 V and above. According to literature,28 the first process involved electronic exchanges only and was pH independent, the second redox mechanism was associated with proton exchange and was sensitive to the pH values. Therefore, the alternation between deprotonation and protonation during the doping and dedoping process was characterized by the exchange of one proton and one electron per monomer unit. In addition, the redox peak current density increased linearly as the scan rate increased from 5 to 200 mV s−1 (Fig. 7B) but nonlinearly as the square root of scan rate (Fig. 7C), indicating that the electrochemical behavior of PICA electrode was an adsorption controlled process rather than diffusion-controlled. Fig. 7D shows the variation in the specific capacitance of PICA electrode as a function of scan rates, respectively. It can be found that the specific capacitance decreases with the increase of scan rates from 5 to 200 mV s−1. The specific capacitance was 385.5 F g−1 at a scan rate of 5 mV s−1 and then decreased to 283.3 F g−1 at 200 mV s−1, with a decrease of 26.5%. The high specific capacitance at high scan rates shows that PICA is a promising electrode material for supercapacitors applications.
 |
| | Fig. 7 (A) CVs of PICA electrode in 1.0 M H2SO4 solution at different potential scan rates (j = current density), (B) peak current densities as a function of scan rates, (C) peak current densities as a function of the square root of scan rates, (D) specific capacitance of PICA electrode as a function of scan rates. Mass loading: 3.7 μg. | |
Fig. 8A shows charge–discharge curves of PICA electrode at different current densities. The charge–discharge curves were similar in shape between 0.1 and 1.0 V, indicating that the PICA electrode can be stably performed in the range of current densities.54 Fig. 8B shows the specific capacitance of PICA electrode calculated by eqn (4) at different current densities. The specific capacitance reached 373.2 F g−1 at a current density of 2.5 A g−1, and retained at 318.7 F g−1 when a high current density of 25 A g−1 was used.
 |
| | Fig. 8 (A) Galvanostatic charge–discharge curves of PICA electrode in 1.0 M H2SO4 solution at different current density, (B) specific capacitance as a function of current density, (C) power density of the symmetric full cell based on two PICA electrodes as a function of energy density, (D) specific capacitance of PICA electrode in 1.0 M H2SO4 solution as a function of the mass loading at a current density of 15 A g−1. Mass loading of each electrode is fixed at 3.7 μg for (A)–(C). | |
For further investigation of the capacitive performance of PICA electrode in the electrolyte, the power density and energy density values of the symmetric full cell based on two PICA electrodes were obtained (Fig. 8C). An energy density of 8.74 W h kg−1 was obtained at a power density of 225 W kg−1. Even at a power density of 4500 W kg−1, the energy density still reached 7.03 W h kg−1. Fig. 8D shows the specific capacitance of PICA electrode as a function of its mass. As seen from Fig. 8D, the specific capacitance decreased with an increasing specific mass of polymers. For example, the specific capacitance was decreased to 238.4 F g−1 from 403.2 F g−1 when the mass of PICA was increased to 31.3 μg from 1.4 μg. This was because the thickness of polymer films increased with the mass loading when the surface area of the working electrode was fixed. The increase in thickness will induce the results as follows: (1) increase in film resistance, (2) decrease the effective polymer contributing on specific capacitance value.
In order to further evaluate the electrochemical behaviors of PICA electrode, an electrochemical impedance spectroscopy (EIS) test was carried out at 0.9 V. Fig. 9 shows the impedance spectra of PICA electrode in 1.0 M H2SO4 solution. As seen from Fig. 9A, the impedance curves show a flattened semicircle in the high frequency region and a nearly vertical straight line in the low frequency region. The intercepts of the Nyquist curves on the real axis were about 5.2 ohm, which was the impedance of the electrolyte. In addition, the diameter of the impedance arc was about 0.2 ohm, which indicated the small charge-transfer resistance of PICA electrode. In the phase angle plot (Fig. 9B), the approaching to pure capacitive behavior at low frequency is usually identified with phase angle approaching to the −90°. The phase angle of PICA electrode reached −87.9° at 0.01 Hz. This indicated that the PICA electrode had a good capacitive performance.
 |
| | Fig. 9 Impedance spectra of PICA electrode in 1.0 M H2SO4 solution: (A) Nyquist plots; (B) Bode-phase angle plots. Electrode potential: 0.9 V, mass loading: 3.7 μg. | |
To further evaluate the cycle life of PICA electrode, galvanostatic charge–discharge measurement was carried out at a current density of 15 A g−1 for 1000 cycles. Fig. 10 shows the specific capacitance of PICA electrode during a total of 1000 cycles. As seen from Fig. 10, the specific capacitance of the electrode was 323 F g−1 at the first cycle, and then slowly decreased to 297 F g−1 at the 100th cycle, subsequently, achieved a stable capacitance value of 294 F g−1, with a total decrease of 9% after 1000 cycles.
 |
| | Fig. 10 Galvanostatic charge–discharge life of PICA in 1.0 M H2SO4 solution at a constant current density of 15 A g−1, the voltage range is from 0.10 to 1.0 V. Mass loading: 3.7 μg. | |
Here, the electrochemical performances of poly(indole-6-carboxylic acid) were tested under the same condition, the results were shown in Fig. S7.† In Fig. S7,† the specific capacitance of poly(indole-6-carboxylic acid) was 358.7 F g−1 at 2.5 A g−1, which was lower than that of PICA (373.2 F g−1). And after 1000 cycles, the specific capacitance decay of poly(indole-6-carboxylic acid) was 12.5%, which was higher than that of PICA (9%). This was possibly that the peculiar structures formed through the intramolecular and intermolecular hydrogen bonds benefited the performance enhancement of poly(indole-7-carboxylic acid) (Scheme 2). At the same time, the capacitance performance of PICA nanowires was compared with several important CPs, such as PANI, PPy and PEDOT, the result was shown in Table 1. As seen from Table 1, PANI powders and PANI hollow nanotubes prepared by Miao et al. had a maximum specific capacitance of 216 F g−1 and 601 F g−1, respectively. Unfortunately, the decay of their specific capacitance was up to 48% and 38% after only 500 cycles, respectively.55 The specific capacitances of PPy nanobelts, nanobricks and nanosheets prepared by Dubal et al. were 294, 334 and 532 F g−1. However, the specific capacitance decay of PPy nanosheets reached 19% after 1000 cycles.56 Li et al. reported a stable PEDOT nanorods with 9.1% capacitance loss after 1000 cycles, but its specific capacitances was only 109.1 F g−1.57 By comparison, PICA nanowire structures exhibited superior specific capacitance and excellent long-life electrochemical stability.
Table 1 Capacitance performance comparison of PICA nanowires with about several important CPs
| CPs |
Potential window/V |
Electrolytes |
Csa/F g−1 |
Decay/% |
Ref. |
| In the three-electrode system. Specific capacitance decay after 500 cycles. Specific capacitance decay after 1000 cycles. |
| PANI powder |
0.8 |
1.0 M H2SO4 |
216 |
48%b |
55 |
| PANI hollow nanotubes |
601 |
38%b |
| PPy nanobelts |
1.0 |
0.5 M H2SO4 |
294 |
— |
56 |
| PPy nanobricks |
334 |
— |
| PPy nanosheets |
532 |
19%c |
| PEDOT blocks |
0.6 |
1.0 M KCl |
36.7 |
54.1%c |
57 |
| PEDOT particles |
72.5 |
32.3%c |
| PEDOT nanorods |
109.1 |
9.1%c |
| PICA nanowires |
0.9 |
1.0 M H2SO4 |
373.2 |
9%c |
This work |
Conclusions
In this paper, novel PICA nanowires with conductivity of 5 × 10⁻² S cm−1 were prepared by a simple electrochemical deposition method. The diameter of PICA nanowire was about 40 nm. According to FTIR and 1H NMR, PICA nanowire was grown mainly via the coupling of the monomer at C2 and C3 positions. TGA results indicated good thermal stability of PICA films. As supercapacitors electrode, the PICA electrode exhibited excellent electrochemical stability, high specific capacitance and energy density. Namely, the specific capacitance was as high as 373.2 F g−1 at a current density of 2.5 A g−1 in 1.0 M H2SO4 solution. The energy density of the symmetric full cell based on two PICA electrodes reached 7.03 W h kg−1 at a power density of 4500 W kg−1. The capacitance retention was 91% after 1000 cycles at a current density of 15 A g−1. These intriguing features make it quite a suitable and promising electrode material for supercapacitors.
Acknowledgements
This work was supported by the National Natural Science Foundation of China (grant number: 51203070, 51303073, 51463008), Jiangxi Provincial Postdoctoral Preferential Foundation (2013KY14), Postdoctoral Foundations of Nanchang City and Jiangxi Science and Technology Normal University (3000035608), Jiangxi Provincial Department of Education for postgraduate (YC2014-S435), Ganpo Outstanding Talents 555 projects (2013), the Training Plan for the Main Subject of Academic Leaders of Jiangxi Province (2011), the Natural Science Foundation of Jiangxi Province (grant number: 20142BAB206028 and 20142BAB216029), the Science and Technology Landing Plan of Universities in Jiangxi province (KJLD12081).
Notes and references
- S. Ghosh and O. Inganäs, Adv. Mater., 1999, 11, 1214–1218 CrossRef CAS
 .
. - D. Aradilla, F. Estrany and C. Alemán, J. Phys. Chem. C, 2011, 115, 8430–8438 CAS .
- G. A. Snook, P. Kao and A. S. Best, J. Power Sources, 2011, 196, 1–12 CrossRef CAS PubMed .
- C. Zhou, Y. Zhang, Y. Li and J. Liu, Nano Lett., 2013, 13, 2078–2085 CrossRef CAS PubMed .
- B. Muthulakshmi, D. Kalpana, S. Pitchumani and N. G. Renganathan, J. Power Sources, 2006, 158, 1533–1537 CrossRef CAS PubMed .
- K. Wang, J. Huang and Z. Wei, J. Phys. Chem. C, 2010, 114, 8062–8067 CAS .
- C. Zhou and S. Kumar, Chem. Mater., 2005, 17, 1995–2002 Search PubMed .
- R. K. Sharma, A. C. Rastogi and S. B. Desu, Electrochem. Commun., 2008, 10, 268–272 CrossRef CAS PubMed .
- Y. Li, B. Wang, H. Chen and W. Feng, J. Power Sources, 2010, 195, 3025–3030 CrossRef CAS PubMed .
- B. Rajesh, K. R. Thampi, J. M. Bonard, N. Xanthopoulos, H. J. Mathieu and B. Viswanathan, J. Phys. Chem. B, 2004, 108, 10640–10644 CrossRef CAS PubMed .
- R. Liu, S. I. Cho and S. B. Lee, Nanotechnology, 2008, 19, 215710–215718 CrossRef PubMed .
- Z. Wang, R. Guo, G. Li, H. Lu, Z. Liu, F. Xiao, M. Zhang and Y. Tong, J. Mater. Chem., 2012, 22, 2401–2404 RSC .
- A. S. Arico, P. Bruce, B. Scrosati, J. M. Terascon and W. V. Schalkwikj, Nat. Mater., 2005, 4, 366–367 CrossRef CAS PubMed .
- A. Manthiram, A. V. Murugan, A. Sarkar and T. Muraliganth, Energy Environ. Sci., 2008, 1, 621–638 CAS .
- K. Wang, J. Huang and Z. Wei, J. Mater. Chem., 2010, 20, 1117–1121 RSC .
- Y. Y. Cao and T. E. Mallouk, Chem. Mater., 2008, 20, 5260–5265 CrossRef CAS .
- A. M. Youssef, RSC Adv., 2014, 4, 6811–6820 RSC .
- M. Muthukumar, C. K. Ober and E. L. Thomas, Science, 1997, 277, 1225–1232 CrossRef CAS .
- E. B. Maarouf, D. Billaud and E. Hannecart, Mater. Res. Bull., 1994, 29, 637–643 CrossRef CAS .
- P. C. Pandey and R. Prakash, J. Electrochem. Soc., 1998, 145, 4103–4107 CrossRef CAS PubMed .
- P. S. Abthagir, K. Dhanalakshmi and R. Saraswathi, Synth. Met., 1998, 93, 1–7 CrossRef CAS .
- P. S. Abthagir and R. Saraswathi, Org. Electron., 2004, 5, 299–308 CrossRef PubMed .
- W. Q. Zhou, Y. K. Du, H. Zhang, J. Xu and P. Yang, Electrochim. Acta, 2010, 55, 2911–2917 CrossRef CAS PubMed .
- G. Nie, X. Han, J. Hou and S. Zhang, J. Electroanal. Chem., 2007, 604, 125–132 CrossRef CAS PubMed .
- G. Nie, Z. Bai, J. Chen and W. Yu, ACS Macro Lett., 2012, 1, 1304–1307 CrossRef CAS .
- H. A. M. Van Mullekom, J. A. J. M. Vekemans, E. E. Havinga and E. W. Meijer, Mater. Sci. Eng., R, 2001, 32, 1–40 CrossRef .
- P. Soudan, P. Lucas, H. A. Ho, D. Jobin, L. Breau and D. Bélanger, J. Mater. Chem., 2001, 11, 773–782 RSC .
- H. Talbi, D. Billaud, G. Louarn and A. Pron, Spectrochim. Acta A, 2001, 57, 423–433 CrossRef CAS .
- X. Fan, Y. Lu, H. Xu, X. Kong and J. Wang, J. Mater. Chem., 2011, 21, 18753–18760 RSC .
- B. Xu, S. Yue, Z. Sui, X. Zhang, S. Hou, G. Cao and Y. Yang, Energy Environ. Sci., 2011, 4, 2826–2830 CAS .
- S. Ghosh, X. An, R. Shah, D. Rawat, B. Dave, S. Kar and S. Talapatra, J. Phys. Chem. C, 2012, 116, 20688–20693 CAS .
- R. Ikan and E. Rapaport, Tetrahedron, 1967, 23, 3823–3827 CrossRef CAS .
- V. Noël and H. N. Randriamahazaka, Electrochem. Commun., 2012, 19, 32–35 CrossRef PubMed .
- H. Akpinar, A. G. Nurioglu and L. Toppare, J. Electroanal. Chem., 2012, 683, 62–69 CrossRef CAS PubMed .
- K. R. Prasad and N. Munichandraiah, J. Electrochem. Soc., 2002, 149, A1393–A1399 CrossRef CAS PubMed .
- G. Q. Shi, S. Jin, G. Xue and C. Li, Science, 1995, 267, 994–996 CrossRef CAS PubMed .
- J. Xu, G. Nie, S. Zhang, X. Han, J. Hou and S. Pu, J. Polym. Sci., Part A: Polym. Chem., 2005, 43, 1444–1453 CrossRef CAS .
- J. K. Xu, W. Q. Zhou, J. Hou, S. Z. Pu, L. S. Yan and J. W. Wang, J. Polym. Sci., Part A: Polym. Chem., 2005, 43, 3986–3997 CrossRef CAS .
- P. A. Christensen and A. Hamnett, Techniques and mechanisms in electrochemistry, Blackie Academic, London, 1994 Search PubMed .
- A. L. Dyer and J. R. Reynolds, Handbook of Conducting Polymers, ed. T. A. Skotheim and J. R. Reynolds, CRC Press, New York, 3rd edn, 2007 Search PubMed .
- M. E. Plonska-Brzezinska, M. Lewandowski, M. Błaszyk, A. Molina-Ontoria, T. Luciński and L. Echegoyen, ChemPhysChem, 2012, 13, 1–9 CrossRef PubMed .
- D. Z. Mo, W. Q. Zhou, X. M. Ma, J. K. Xu, D. H. Zhu and B. Y. Lu, Electrochim. Acta, 2014, 132, 67–74 CrossRef CAS PubMed .
- M. D. Stoller and R. S. Ruoff, Energy Environ. Sci., 2010, 3, 1294–1301 CAS .
- H. Wu, H. Pang and X. Lou, Energy Environ. Sci., 2013, 6, 3619–3626 CAS .
- T. F. Otero and E. de Larreta-Azelain, Polymer, 1988, 29, 1522–1527 CrossRef CAS .
- C. C. B. Bufon, J. Vollmer, T. Heinzel, P. Espindola, H. John and J. Heinze, J. Phys. Chem. B, 2005, 109, 19191–19199 CrossRef PubMed .
- J. K. Xu, J. Hou, W. Q. Zhou, G. M. Nie, S. Z. Pu and S. S. Zhang, Spectrochim. Acta A, 2006, 63, 723–728 CrossRef PubMed .
- G. M. Nie, T. Cai, S. S. Zhang, Q. Bao and J. K. Xu, Electrochim. Acta, 2007, 52, 7097–7106 CrossRef CAS PubMed .
- W. Q. Zhou, Y. K. Du, F. F. Ren, C. Y. Wang, J. K. Xu and P. Yang, Int. J. Hydrogen Energy, 2010, 35, 3270–3279 CrossRef CAS PubMed .
- G. M. Nie, Y. Zhang, J. K. Xu and S. S. Zhang, J. Electroanal. Chem., 2008, 622, 121–127 CrossRef CAS PubMed .
- J. K. Xu, J. Hou, S. S. Zhang, R. Zhang, G. M. Nie and S. Z. Pu, Eur. Polym. J., 2006, 42, 1384–1395 CrossRef CAS PubMed .
- J. K. Xu, J. Hou, S. Z. Pu, G. M. Nie and S. S. Zhang, J. Appl. Polym. Sci., 2006, 101, 539–547 CrossRef CAS .
- S. R. Sivakkumar, N. Angulakshmi and R. Saraswathi, J. Appl. Polym. Sci., 2005, 98, 917–922 CrossRef CAS .
- M. Yang, B. Cheng, H. Song and X. Chen, Electrochim. Acta, 2010, 55, 7021–7027 CrossRef CAS PubMed .
- Y. E. Miao, W. Fan, D. Chen and T. X. Liu, ACS Appl. Mater. Interfaces, 2013, 5, 4423–4428 CAS .
- D. P. Dubal, S. H. Lee, J. G. Kim, W. B. Kim and C. D. Lokhande, J. Mater. Chem., 2012, 22, 3044–3052 RSC .
- Y. Li, B. C. Wang, H. M. Chen and W. Feng, J. Power Sources, 2010, 195, 3025–3030 CrossRef CAS PubMed .
Footnotes |
| † Electronic supplementary information (ESI) available: The chronoamperometric curves of ICA, the mensuration about the total charges of oxidized species in the PICA films, deposition mass vs. deposition charge for PICA nanowires, the galvanostatic charge–discharge curves and specific capacitances of the symmetric full cell based on two PICA electrodes at different current density, the electrochemical properties of poly(indole-6-carboxylic acid). See DOI: 10.1039/c4ra11586d |
| ‡ Xiumei Ma and Weiqiang Zhou contributed equally to this work. |
|
| This journal is © The Royal Society of Chemistry 2015 |
Click here to see how this site uses Cookies. View our privacy policy here. 


 is the total voltammetric charge obtained by integration of the positive and negative sweeps in the cyclic voltammograms, v is the scan rate, and m is the mass of the individual sample.


