DOI:
10.1039/C4RA11421C
(Paper)
RSC Adv., 2015,
5, 5046-5052
Application of near infrared spectroscopy for the rapid determination of epimedin A, B, C and icariin in Epimedium
Received
29th September 2014
, Accepted 1st December 2014
First published on 2nd December 2014
Abstract
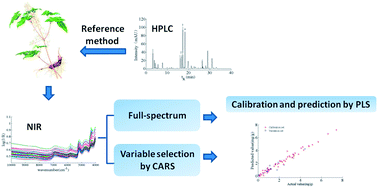
A method for rapid quantitative analysis of epimedin A, B, C and icariin in Epimedium was developed based on Fourier transform near infrared (FT-NIR) spectroscopy, and by adopting high performance liquid chromatography-diode array detection (HPLC-DAD) as the reference method. Multivariate calibrations models were built by partial least squares regression (PLSR) based on the full absorbance spectra (10
000–4000 cm−1) or only the most informative key variables selected by the competitive adaptive reweighted sampling (CARS) method. In comparison, the accuracy of the CARS-PLSR method was apparently higher than full spectrum-PLSR for four kinds of investigated flavonoids. For CARS-PLSR, the coefficients of determination (R2) for prediction were 0.8969, 0.8810, 0.9273 and 0.9325 and the root mean square errors of prediction (RMSEP) were 0.1789, 0.2572, 1.2872 and 0.3615 for epimedin A, B, C and icariin, respectively. The good performance indicates that the combination of NIR spectroscopy with CARS-PLSR is an effective method for determination of epimedin A, B, C and icariin in Epimedium with fast, economic and nondestructive advantages compared to traditional chemical methods.
1. Introduction
Epimedium (Yinyanghuo) is a popular traditional Chinese medicine with a long history in China. Almost fifty varieties of Epimedium are distributed around the world and twenty-three varieties are found in China, the geographical distribution center of Epimedium.1 Five official species were designated in Chinese Pharmacopoeia, including Epimedium brevicornum Maxim., E. sagittatum Maxim., E. pubescens Maxim., E. wushanense T. S. Ying and E. koreanum Nakai.2 The aerial part is of great value in the treatment of cardiovascular diseases, osteoporosis and improvement of sexual function.2–5
Flavonoids are generally considered as the major active constituents of Epimedium, and over 141 flavonoids, including flavone and its derivatives, have been found from 17 Epimedium species.6 Among them, epimedin A, B, C and icariin, which make up more than 52% of total flavonoids in epimedium, are perceived as major bioactive components.7 Four flavonoids exhibit a promising therapeutic efficacy of antitumor, cardiac-cerebral vascular disease, anti-oxidant, antidepressants and antiobesity.4,8,9 Quantitative and qualitative studies about Epimedium have been extensively investigated. Many analytical techniques, such as HPLC,7 capillary zone electrophoresis (CZE)10 and micellar electrokinetic chromatography (MEKC),11 have been applied for the investigation of epimedin A, B, C and icariin simultaneously. However, these methods are time-consuming, laborious and need additional reagents in sample processing. To address these issues, it is necessary to develop new methods for determining the four flavonoids in Epimedium.
As a rapid, economical and nondestructive analytical technique, FT-NIR spectroscopy has been widely applied in quality evaluation and quality control of food, agriculture, and pharmaceutical products, such as honey,12 tea13 and honeysuckle.14 It is applied based on molecular overtone and combination vibrations of the fundamental –OH, –CH, and –NH bonds, which are the main recordable phenomena in the radiation region (12
500–4000 cm−1) of near-infrared spectrum.15 However, NIR spectra are often highly correlated due to the strongly overlapped and broad absorption bands,16 so the data are often calibrated with the classical partial least squares regression (PLSR).17,18 A calibration process on the basis of full-range spectra is time consuming and adverse to fulfilling the high-speed features of NIR spectroscopy. Instead, the selected informative wavelengths instead of full-spectrum can result in a better quantitative calibration model.19,20 Li et al. demonstrated that CARS performed a competitive selection of some key wavelengths which were interpretable to the chemical property of interest, by comparing CARS21 with a moving window (MW)22 and a Monte Carlo uninformative variable elimination (MC-UVE)23 selection method.
This study combined CARS with PLSR algorithm to determine epimedin A, B, C and icaniin in Epimedium. CARS was applied to select key wavelengths from the full-range of NIRS. The objectives of this work include two aspects: (I) to establish the relationships between the NIR spectroscopy spectra and the content of the four flavonoids, (II) to discuss the benefits of selecting the most informative spectral variable (with CARS-PLSR compared with full spectrum-PLSR) for calibration accuracy and model parsimony.
2. Materials and methods
2.1. Materials and reagents
Seventy-five batches of commercial samples of Epimedium were collected from 18 different provinces in China. HPLC-grade acetonitrile (Merck, Darmstadt, Germany), methanol (Hanbang Chemicals, Jiangsu Province, China), dehydrated alcohol (Huihong Chemicals, Hunan Province, China), and phosphoric acid (Kermel, Tianjin, China) were purchased. Deionised water was purified with a Milli-Q system (Millipore, Bedford, MA, USA). Epimedin A, epimedin B, epimedin C and icariin were purchased from Beijing Century Aoke Biotechnology Co. Ltd.
2.2. Sample preparation
The dried aerial parts of the samples, a total of seventy-five batches, were pulverized with small high-speed universal grinder and passed through a 60 mesh sieve. The powdered samples were oven-dried at 65 °C for 4 h according to the ref. 7. The dried samples were kept in ziplock bags and stored in dark place prior to further analysis.
One gram pulverized sample was weighed accurately and mixed with 25 mL 80% ethanol solution in a 100 mL conical flask. The mixture was sonicated for 30 min at the extraction temperature of 40 °C. The supernatant was filtered and the filtrate was collected as the crude extract. The crude extract was transferred to a 250 mL volumetric flask, and adjusted to 250 mL (Vsolution) with 80% ethanol solution. The solution was filtered through 0.45 μm membranes before HPLC analysis.
2.3. HPLC analysis
Quantitative analysis of epimedin A, B, C and icaniin in Epimedium was performed on a Dionex ultimate 3000 series instrument (California, USA), which consists of a binary pump, a diode-array detector (DAD), an automatic injector, an autosampler and a column compartment. The HPLC separation was achieved on a SinoChrom ODS-BP column (5 μm, 250 mm × 4.6 mm, Elite, Dalian, China). The mobile phase consisted of (A) 0.1% phosphoric aqueous acid and (B) acetonitrile in a gradient mode as follows: 22–33% (v/v) B at 0–15 min, 33–35.4% B at 15–20 min, 35.4–50% B at 20–25 min, 50–50% B at 25–35 min, 50–22% B at 35–37 min, 22% B at 37–40 min. The injection volume was 10 μL and the flow rate was 1.0 mL min−1. The column compartment was kept at 25 °C. DAD detection was accomplished at 270 nm. Chromatographic peaks of epimedin A, B, C and icariin were identified according to the retention time and the UV spectrum with the reference standards. The external standard method was applied to quantification of the four flavonoids.
2.4. NIR spectral measurement
The FT-NIR reflectance spectra were collected using an Antaris II FT-NIR spectrophotometer (Thermo Electron Co., USA) with an integrating sphere. Each spectrum was recorded between 10
000 cm−1 and 4000 cm−1 with a resolution of 8 cm−1 by co-adding 32 scans and all the spectra were recorded as the logarithm of the reciprocal reflectance, log(1/R). Samples were measured at intervals of 3.856 cm−1, and spectrum of each sample had 1557 data points (i.e. spectral variables). About 0.5 g of dry Epimedium powder was filled into the sample cup, which was the standard accessory as sample's holder, in the standard procedure. The spectrum of each Epimedium sample was collected three times at indoor temperature (25 ± 1) °C. The average of the three spectra collected from the same Epimedium sample was used for further analysis.
2.5. Spectral preprocessing
In order to build reliable, accurate and stable models, mathematical spectral pre-treatments to reduce background information and noises beside sample information are necessary. In this work, four data pre-processing methods, including moving window smoothing, multiplicative scattering correction (MSC), standard normal transformation (SNV) and Savitzky–Golay first-derivative (S/G 1st der), and their various combinations were investigated comparatively. Smoothing was applied to modify the magnitude of absorption peaks and shift the position of the asymmetric absorption band. MSC eliminated the effects of the solid scattering on the spectrum. The SNV was a mathematical transformation method which centred and scaled individual spectra. S/G 1st derivative was used to correct baseline effects in spectra.
2.6. Multivariate calibration approach
PLSR analysis is extensively used for multivariate regression in spectroscopic analysis. In PLSR, the spectral data matrix (X) and the target chemical properties matrix (Y) are considered simultaneously.24 Before the modeling, Kennard and Stone algorithm (K–S),25 which aims at covering the multidimensional space in an uniform manner by maximizing the Euclidean distances between already selected objects and the remaining objects, was applied to selecting calibration set and prediction set.
In PLSR model, there are some of spectral variables that contain irrelevant information or noise for modeling Y. Eliminating these variables from the pertinent information is conducive to improving the model. In this work, CARS algorithm21 was used to select the key wavelengths that had large absolute regression coefficients in PLSR model. In CARS, the first step was to sample in the model space combined with Monte Carlo strategy. Then, enforced wavelength reduction and adaptive reweighted sampling (ARS) were employed to remain informative variables. In enforced wavelength reduction procedure of one variable subset, the variables were indexed by absolute values of regression coefficients. It was demonstrated that a large absolute regression coefficient indicates an important variable in a model.26,27 A number of variables with small absolute regression coefficients were removed. CARS uses exponentially decreasing function (EDF) to remove the variables which are less important. In this step, the runs of EDF are set to N, which means that finding an optimal variable subset would undergo N runs to iteratively filter the variables with small absolute regression coefficients. In the ith run of EDF, the number of remaining variables is calculated as follows:
where
k is the constant parameter controlling the curve of EDF and
p is the total number of variables. It is related to the curvature of the EDF and has positive correlation with the speed of the deceasing curve. It is determined by the following two conditions: (I) when
i = 0, all the
p variables are taken for modeling, which indicates that
r0 =
p, (II) when
i =
N, only 2 variables are remained to obtain
rN = 2, where
N is the total number of iterations. With the above conditions,
k can be computed as:
|
 | (2) |
where ln denotes the natural logarithm.
Following EDF-based enforced wavelength reduction, ARS was employed in CARS to further eliminate wavelengths by mimicking the ‘survival of the fittest’ principle on which Darwin's evolution theory is based. Finally, 10-fold cross-validation was applied to choose the optimal subset of variables with the lowest root mean square error of cross validation (RMSECV). The performance of the calibration model was evaluated in terms of the RMSE of calibration (RMSEC) and determination coefficient (R2) for calibration set (Rc2) in the calibration process. The RMSE of prediction (RMSEP) and determination coefficient (R2) for prediction set (Rp2) were used to evaluate the performance of the prediction set in the prediction process. Based on the guideline of Williams.28 R2 indicates the percentage of the variance in the Y variable that is accounted for by the X variable. R2 value greater than 0.90 denotes a good prediction, and 0.82–0.90 is considered to be indicative of a good prediction, whereas 0.66–0.81 indicates an approximate quantitative prediction.
2.7. Data processing
All the codes and computations were written and performed in MATLAB (Version 2013A, the MathWorks, Inc) on a general-purpose computer with Intel(R) Core(TM) i3 2.27 GHz CPU and 2 GB RAM. The Microsoft Windows 7 was the operating system of the computer. The MATLAB code of data processing is available for academic research in the website: http://www.mathworks.com/matlabcentral/fileexchange/authors/498750.
3. Results and discussion
3.1. Content determination by HPLC
A robust HPLC reference method has been established prior to quantitative analysis of epimedin A, B, C and icariin by NIR. Fig. 1 shows the separations of an Epimedium extract under the chromatographic condition in Section 2.3. Four flavonoids we are concerned are baseline separated. The methodology parameters and calibration curves of the HPLC method were optimized before the real samples analyses, and the results are listed in Table 1. The results of the method validation, including precision, accuracy, linearity and calibration curve, are satisfactory. Therefore, the reference values obtained with this HPLC system are accurate and can be used in subsequent NIR calibration.
 |
| Fig. 1 Representative HPLC-DAD chromatogram at optimized conditions (the peaks marked with 1–4 were epimedin A, B, C and icariin, respectively). | |
Table 1 Methodology parameters and calibration curves of the HPLC method
Compounds |
Retention time (min) |
Calibration curves |
R |
Linear range (μg mL−1) |
Limit of detection (μg mL−1) |
Repeatability (RSD%, n = 6) |
Recovery (%, n = 3) |
Epimedin A |
16.15 |
y = 16.392x − 3.2226 |
0.9999 |
0.25–80 |
0.013 |
0.11 |
105 |
Epimedin B |
16.84 |
y = 19.838x − 3.0745 |
0.9999 |
0.28–120 |
0.007 |
0.11 |
108 |
Epimedin C |
17.37 |
y = 20.607x − 3.5987 |
0.9999 |
0.50–250 |
0.005 |
0.16 |
90 |
Icariin |
18.39 |
y = 23.581x − 5.7396 |
0.9999 |
0.25–250 |
0.004 |
0.13 |
92 |
3.2. Near infrared spectra
Fig. 2 shows the original NIR spectra at wavenumbers 10
000–4000 cm−1 of 75 Epimedium samples. It can be found that the intense absorption bands are mainly distributed in the region of 7200–4000 cm−1. In the NIR region, bands around 6876 cm−1 arise from first overtones of O–H stretching bands14 while those at 5178 cm−1 is due to combination O–H stretching and O–H bending.29 The peaks at 5780 and 5670 cm−1 are assigned to the first overtone of C–H stretching vibrations of methyl, methylene and ethylene groups.30,31 The O–H and C–H bonds are abundant in the molecular structures of epimedin A, B, C and icariin. The NIR spectra contain the chemical information of interest in Epimedium samples sufficiently. However, due to the high degree of band overlap, it is difficult to find the distinct difference in the raw NIR spectra among samples by naked eye. Therefore, it is necessary to introduce chemometric methods to further explore the relationship between the NIR spectra and the internal chemical information.
 |
| Fig. 2 NIR spectra of the Epimedium samples (N = 75). | |
3.3. Selecting the preprocessing methods
Full-spectrum PLSR models were established with different pretreatment methods, including smoothing, MSC, SNV, S/G 1st-der and their various combinations, to reach the minimum RMSEP. The calculated results of calibration and prediction processes are shown in Table 2. As can be seen, in the cases of epimedin A and icariin, the optimal math treatment was SNV, removing slope variations on individual spectrum basis. For epimedin B the best treatment was smooth + MSC. The best treatment for epimedin C was MSC, compensating for different scatter and particle sizes.25 The methods used for different compounds are dissimilar. The reason for this outcome might be that the four flavonoids were related to different effective information of spectral data. Different preprocessing methods reflect the information corresponding to different flavonoids.
Table 2 Optimization of spectral pretreatments in the calibration models of the four flavonoids
|
|
MSC |
SNV |
Smooth + MSC |
Smooth + SNV |
MSC + S/G 1d |
SNV + S/G 1d |
Epimedin A |
RMSEC |
0.1031 |
0.1307 |
0.0979 |
0.1216 |
0.0486 |
0.0596 |
Rc2 |
0.9818 |
0.9715 |
0.9836 |
0.9753 |
0.9961 |
0.9940 |
RMSEP |
0.2214 |
0.2190 |
0.2759 |
0.2568 |
0.2700 |
0.2609 |
Rp2 |
0.8790 |
0.8566 |
0.8120 |
0.8029 |
0.8065 |
0.8278 |
Epimedin B |
RMSEC |
0.1044 |
0.1034 |
0.1785 |
0.1872 |
0.1836 |
0.1882 |
Rc2 |
0.9909 |
0.9912 |
0.9734 |
0.9710 |
0.9731 |
0.9715 |
RMSEP |
0.3999 |
0.4302 |
0.3901 |
0.3855 |
0.4387 |
0.4628 |
Rp2 |
0.7166 |
0.6435 |
0.7303 |
0.7139 |
0.5106 |
0.4852 |
Epimedin C |
RMSEC |
0.4417 |
0.5509 |
0.5706 |
0.5084 |
0.3370 |
0.7789 |
Rc2 |
0.9904 |
0.9850 |
0.9840 |
0.9873 |
0.9948 |
0.9723 |
RMSEP |
2.1433 |
2.3207 |
2.3316 |
2.5840 |
2.5263 |
2.2491 |
Rp2 |
0.7360 |
0.6905 |
0.6875 |
0.6162 |
0.4221 |
0.5406 |
Icariin |
RMSEC |
0.3725 |
0.1987 |
0.2369 |
0.3426 |
0.3255 |
0.3200 |
Rc2 |
0.9567 |
0.9878 |
0.9825 |
0.9638 |
0.9671 |
0.9684 |
RMSEP |
0.7065 |
0.4810 |
0.5680 |
0.5518 |
0.8590 |
0.8405 |
Rp2 |
0.7541 |
0.8789 |
0.8410 |
0.8406 |
0.6466 |
0.6408 |
3.4. Full-spectrum PLSR models
Under the condition of optimized spectra pre-treatments, the full-spectrum PLSR models for epimedin A, B, C and icariin were developed. 10-fold cross-validation was applied to the evaluation of the obtained models. The set of calibration samples was divided into 10 subsets for their calibration, of which nine were taken for the calibration set and one for the prediction set. The process was repeated ten times, so that all of the subsets pass through the calibration and prediction set. Fig. 3 corresponding to the full-spectrum PLSR models shows the correlation of the values obtained by the reference analysis method and the values predicted by the NIR for epimedin A, B, C and icariin. The red star marked points referred to calibration samples, and the blue round marked points referred to validation samples. The prediction results for prediction set generated by the PLSR models are listed in Table 3. RMSEP were 0.2190, 0.3855, 2.1433, 0.4810 and Rp2 were 0.8566, 0.7139, 0.7360, 0.8789 for epimedin A, B, C and icariin, respectively. Good performance for epimedin A and icariin content determination was achieved by NIR spectra. However, the performance for epimedin B and C was only approximate quantitative predictions, which may be caused by two reasons. For one thing, the relatively poor performance is attributed to the heterogeneity of the sample set, as optimal calibration requires limited but sufficient set heterogeneity.32 For another, the full NIR spectra contain 1557 variables and uninformative variables are included, which lead to the PLSR process complex and affect the predictive performance of calibration models. Thus we proposed CARS to eliminate the uninformative variables prior to application of PLSR.
 |
| Fig. 3 Correlation diagrams between the NIR predicted values based on full spectra-PLSR and the reference values of the flavonoids content ((a), (b), (c), (d) represent epimedin A, B, C and icariin, respectively). | |
 |
| Fig. 4 Correlation diagrams between the NIR predicted values based on CARS-PLSR and the reference values of the flavonoids content ((a), (b), (c), (d) represent epimedin A, B, C and icariin, respectively). | |
Table 3 Statistics of estimates from NIRS using either full spectra-PLS regression or CARS-PLS regression
Flavonoids |
nLVsa |
nVARb |
Calibration set (N = 60) |
External validation set (N = 15) |
Rc2 |
RMSEC |
Rp2 |
RMSEP |
nLVs denotes the number of latent variables. nVAR stands for the number selected variables. |
Full spectrum-PLS regression |
Epimedin A (mg g−1) |
16 |
1557 |
0.9715 |
0.1307 |
0.8566 |
0.2190 |
Epimedin B (mg g−1) |
18 |
1557 |
0.9710 |
0.1872 |
0.7139 |
0.3855 |
Epimedin C (mg g−1) |
18 |
1557 |
0.9904 |
0.4417 |
0.7360 |
2.1433 |
Icariin (mg g−1) |
18 |
1557 |
0.9878 |
0.1987 |
0.8789 |
0.4810 |
![[thin space (1/6-em)]](https://www.rsc.org/images/entities/char_2009.gif) |
CARS-PLS regression |
Epimedin A (mg g−1) |
12 |
47 |
0.9567 |
0.1441 |
0.8969 |
0.1789 |
Epimedin B (mg g−1) |
16 |
50 |
0.9559 |
0.1001 |
0.8810 |
0.2572 |
Epimedin C (mg g−1) |
14 |
47 |
0.9517 |
0.5295 |
0.9273 |
1.2872 |
Icariin (mg g−1) |
11 |
44 |
0.9426 |
0.2655 |
0.9325 |
0.3615 |
3.5. CARS for variable selection
As described in Li's previous work,21 the number of Monte Carlo sampling runs does not have significant influence on the performance of CARS. Thus, the number of sampling runs was set to 100 as default during the calculation process. During CARS, RMSECV decreased as the wavelengths with more information were retained while other unimportant ones were eliminated. Once any key wavelength was removed, RMSECV value would rise sharply. So the critical point with the lowest RMSECV corresponded to the optimal wavelengths subset, which implied that the valuable information could be retained better only when variables are appropriately reserved. Finally, there were 47, 50, 47 and 44 wavelengths selected for epimedin A, B, C and icariin, respectively. Fig. 5 illustrates the distribution of the selected variables by CARS. It can be seen that the informative wavelengths of all four flavonoids are widely distributed in the wavenumbers of 9977–8242 cm−1 and 6892–4018 cm−1, which may be seen as a proof for the characteristics of strong overlap, broad absorption bands and high correlation in NIR spectra.16 Simultaneously, the wavenumbers selected for epimedin A, B and C are similar, while the ones corresponding to icariin is somewhat different. This phenomenon may be on account that the structure of icariin is, to some extent, differ from epimedin A, B and C. Epimedin A, B and C have more structural similarity. It indicates that CARS has the ability to effectively extract informative variables relevant to the four different flavonoids from NIR spectra.
 |
| Fig. 5 Position of the identified key wavenumbers in the NIRS of Epimedium (spectrum averaged from 75 samples and scaled for illustration); (a), (b), (c), (d) stand for epimedin A, B, C and icariin, respectively. | |
CARS-PLSR models for 4 flavonoids were developed under the conditions of the most appropriate wavelengths selected by CARS and the same optimized spectra pre-treatments corresponding to PLSR models. The results of the CARS models are shown in Table 3 and Fig. 4. Through comparison of the full-spectrum PLSR models with CARS-PLSR ones, it is clearly showed that the irrelevant variables can be removed effectively and the predictive precision can be improved markedly by CARS method. RMSEP decreased from 0.2190, 0.3855, 2.1433 and 0.4810 to 0.1789, 0.2572, 1.2872 and 0.3615; Rp2 increased from 0.8566, 0.7139, 0.7360 and 0.8789 to 0.8969, 0.8810, 0.9273 and 0.9325 for epimedin A, B, C and icariin, respectively. After using the key variables, the performance for epimedin C obtain the most obvious improvement from an approximate quantitative prediction to an excellent prediction, followed by epimedin B. At the same time, one can see that the performance for epimedin C and icariin were improved to excellent predictions and superior to epimedin A and B. The reason may be that the contents of epimedin A and B are too low (epimedin A 0.0355–3.1552 mg g−1, epimedin B 0.044–5.3131 mg g−1), and it is difficult to measure more accurately. In general, the results proved that CARS method could obtain more accurate and parsimonious model for determination of epimedin A, B, C and icariin in Epimedium using NIR spectroscopic methods.
4. Conclusions
A FT-NIR method was developed to determine the epimedin A, B, C and icariin in Epimedium with a HPLC-DAD method as the reference method. After the removal of the irrelevant variables in the original NIR spectra, more efficient and parsimonious models based on CARS-PLSR were obtained compared with the full-spectrum PLSR ones. The good performance of CARS-PLSR models showed a potential application of CARS on rigorously selecting NIR informative variables. It can be concluded from the overall results that NIR spectroscopy combined with PLSR is a rapid and nondestructive method for the determination of epimedin A, B, C and icariin in Epimedium. However, more work has to be done, in order to improve the accuracy and robustness of the models, especially for epimedin A and B.
Acknowledgements
The authors gratefully thank National Natural Science Foundation of China for support of the projects (no. 21175157 and 21375151), China Hunan Provincial science and technology department for support of the project (no. 2012FJ4139) and Central South University for special support of the basic scientific research project (no. 2010QZZD007).
References
- L. X. Zhang, Z. M. Zhang, J. H. Huang, Y. S. Jin and H. M. Lu, Anal. Methods, 2013, 5, 5331–5338 RSC.
- Chinese Pharmacopoeia Commission, Chinese Pharmacopoeia I., Chemical Industry Press, Beijing, 2005, p. 229 Search PubMed.
- M. N. Makarova, O. N. Pozharitskaya, A. N. Shikov, S. V. Tesakova, V. G. Makarov and V. P. Tikhonov, J. Ethnopharmacol., 2007, 114, 412–416 CrossRef CAS PubMed.
- X. Zhang, Y. Li, X. Yang, K. Wang, J. Ni and X. Qu, Life Sci., 2005, 78, 180–186 CrossRef CAS PubMed.
- F. H. Meng, Y. B. Li, Z. L. Xiong, Z. M. Jiang and F. M. Li, Phytomedicine, 2005, 12, 189–193 CrossRef CAS PubMed.
- H. Ma, X. He, Y. Yang, M. Li, D. Hao and Z. Jia, J. Ethnopharmacol., 2011, 134, 519–541 CrossRef CAS PubMed.
- H. Zhang, T. Yang, Z. Li and Y. Wang, Ultrason. Sonochem., 2008, 15, 376–385 CrossRef CAS PubMed.
- Y. Li, Z. Xiong and F. Li, J. Chromatogr. B: Anal. Technol. Biomed. Life Sci., 2005, 821, 235–239 CrossRef CAS PubMed.
- T. Z. Liu, C. Y. Chen, S. J. Yiin, C. H. Chen, J. T. Cheng, M. K. Shih, Y. S. Wang and C. L. Chern, Food Chem. Toxicol., 2006, 44, 227–235 CrossRef CAS PubMed.
- J. J. Liu, S. P. Li and Y. T. Wang, J. Chromatogr. A, 2006, 1103, 344–349 CrossRef CAS PubMed.
- S. F. Wang, Y. Q. Wu, Y. Ju, X. G. Chen, W. J. Zheng and Z. D. Hu, J. Chromatogr. A, 2003, 1017, 27–34 CrossRef CAS PubMed.
- O. Escuredo, M. C. Seijo, J. Salvador and M. I. Gonzalez-Martin, Food Chem., 2013, 141, 3409–3414 CrossRef CAS PubMed.
- Q. S. Chen, J. W. Zhao, X. Y. Huang, H. D. Zhang and M. H. Liu, Microchem. J., 2006, 83, 42–47 CrossRef CAS PubMed.
- W. L. Li, Y. F. Wang and H. B. Qu, Vib. Spectrosc., 2012, 62, 159–164 CrossRef CAS PubMed.
- X. Wei, N. Xu, D. Wu and Y. He, Food Bioprocess Technol., 2013, 7, 184–190 CrossRef PubMed.
- M. Blanco, J. Cruz and M. Bautista, Anal. Bioanal. Chem., 2008, 392, 1367–1372 CrossRef CAS PubMed.
- M. Vohland, M. Ludwig, S. Thiele-Bruhn and B. Ludwig, Geoderma, 2014, 223–225, 88–96 CrossRef CAS PubMed.
- J. Li, Y. Jiang, Q. Fan, Y. Chen and R. Wu, Spectrochim. Acta, Part A, 2014, 125, 278–284 CrossRef CAS PubMed.
- D. Wu, X. Chen, P. Shi, S. Wang, F. Feng and Y. He, Anal. Chim. Acta, 2009, 634, 166–171 CrossRef CAS PubMed.
- Y. H. Yun, Y. Z. Liang, G. X. Xie, H. D. Li, D. S. Cao and Q. S. Xu, Analyst, 2013, 138, 6412–6421 RSC.
- H. Li, Y. Liang, Q. Xu and D. Cao, Anal. Chim. Acta, 2009, 648, 77–84 CrossRef CAS PubMed.
- B. W. M. Daszykowski and D. L. Massart, Anal. Chim. Acta, 2002, 468, 91–103 CrossRef.
- Q. J. Han, H. L. Wu, C. B. Cai, L. Xu and R. Q. Yu, Anal. Chim. Acta, 2008, 612, 121–125 CrossRef CAS PubMed.
- F. Chauchard, R. Cogdill, S. Roussel, J. M. Roger and V. Bellon-Maurel, Chemom. Intell. Lab. Syst., 2004, 71, 141–150 CrossRef CAS PubMed.
- R. D. M. A. Candolfia, D. Jouan-Rimbaud, P. A. Hailey and D. L. Massart, J. Pharm. Biomed. Anal., 1999, 21, 115–132 CrossRef.
- Y. H. Yun, D. S. Cao, M. L. Tan, J. Yan, D. B. Ren, Q. S. Xu, L. Yu and Y. Z. Liang, Chemom. Intell. Lab. Syst., 2014, 130, 76–83 CrossRef CAS PubMed.
- D. J.-R. A. Garrido Frenicha, D. L. Massartb, S. Kuttatharmmakulb, M. Martinez Galeraa and J. L. Martinez VidaP, Analyst, 1995, 120, 2787–2792 RSC.
- P. Williams, Near-Infrared Technology–Getting the Best Out of Light, PDK Grain, Nanaimo, Canada, 2003 Search PubMed.
- D. Cozzolino, I. Murray, A. Chree and J. R. Scaife, LWT--Food Sci. Technol., 2005, 38, 821–828 CrossRef CAS PubMed.
- N. Sinelli, L. Cerretani, V. D. Egidio, A. Bendini and E. Casiraghi, Food Res. Int., 2010, 43, 369–375 CrossRef CAS PubMed.
- W. L. Li, L. H. Xing, Y. Cai and H. B. Qu, Vib. Spectrosc., 2011, 55, 58–64 CrossRef CAS PubMed.
- L. Cécillon, B. G. Barthès, C. Gomez, D. Ertlen, V. Genot, M. Hedde, A. Stevens and J. J. Brun, Eur. J. Soil Sci., 2009, 60, 770–784 CrossRef PubMed.
|
This journal is © The Royal Society of Chemistry 2015 |
Click here to see how this site uses Cookies. View our privacy policy here.