DOI:
10.1039/C4RA11407H
(Paper)
RSC Adv., 2014,
4, 58077-58082
A nitroaromatic fluorescence sensor from a novel tripyrenyl truxene†
Received
28th September 2014
, Accepted 29th October 2014
First published on 29th October 2014
Abstract
A new fluorophore containing a truxene core and three ethynyl pyrene peripheries is successfully synthesized by Sonogashira coupling. This compound exhibits superior emission properties compared to the parent truxene with quantum yields of 71 and 53% in CHCl3 and aqueous THF, respectively. In CHCl3, it shows a selective fluorescence quenching towards 2-nitrophenol with a detection limit of 1.54 ppm. When dissolved in aqueous THF, however, its fluorescence signal is selectively quenched by picric acid with a detection limit of 0.15 ppm. Since the absorption bands of these analytes overlap with the excitation wavelength of the fluorophore, the inner filter effect may be a significant cause of the fluorescent quenching. However, there is no constant correlation between the fraction of photons absorbed by the fluorophore and the emission integrals, therefore, other quenching mechanisms might also play important roles. The Stern–Volmer plots at different temperatures indicate a static or contact quenching of the fluorophore, which could be caused by the π–π interaction between the fluorophore and the electron-deficient analytes.
1. Introduction
Nitroaromatic compounds (NACs) such as nitrobenzene (NB), trinitrobenzene (TNB) and picric acid (PA) are widely used as industrial solvents, insecticides, dyes, and herbicides, while trinitrotolulene (TNT) is the explosive chemical commonly involved in terrorist or criminal activities.1–5 For bioenvironmental issues, contamination of NACs in water and soil can be seriously dangerous, especially to the chemically sensitive animals and plants.6,7 In terms of human exposure, NACs are known to cause the formation of methemoglobin upon acute exposure, while chronic exposure can cause anemia, bladder tumors, and liver damage.8–10 Therefore, the detection and quantitation of these hazardous compounds contaminating in environment or ecosystem is of great importance.
Various analytical techniques such as gas chromatography coupled mass spectrometry (GC-MS), ion-mobility spectroscopy (IMS), and surface enhanced Raman spectroscopy (SARS) have been used for detections of NACs. However, these techniques usually require costly equipment, complicated instrument operation, tedious sample preparation, and well-trained instrument users. Compared to those techniques, fluorescence spectroscopy requires less-expensive instrument, yet provides high selectivity and comparable sensitivity in short response time. As the portable fluorometers have become commercially available, the real-time monitoring and on-site detection can also be performed. For these reasons, there have been a number of works on the development of efficient fluorescent sensors with selectivity towards NACs.11–17 Some of the precedent works relied on the fluorogenic responses of inorganic–organic hybrid nonospheres,14 Ag nanocluster–DNA hybrid,15 upconversion luminescence nanoparticles,16 and p-phenylenevinylene derivatives17 towards nitroaromatic explosives. During our research study involving the synthesis of fluorescent signal transducers and sensors, we became interested in various derivatives of truxene or 10,15-dihidro-5H-diindenal[1,2-α;1′,2′-c]-fluorene due to their well-defined and rigid structures, high thermal stability, and strongly emissive properties.18 Several truxene derivatives have been prepared and applied as optoelectronic materials19–21 and fluorescent sensors.18,22,23 In this paper, we report the synthesis and characterization of a new pyrenyl truxene 1 (Fig. 1) with an aim of using it as a fluorescent sensor for nitroaromatic compounds. The ethynyl pyrene groups could extend the conjugation of the truxene core and serve as binding sites for electron-poor analytes. The n-butyl substituent at the 5, 10, and 15-positions of truxene could prevent the π–π stacking and enhance the solubility of this compound in common organic solvent.
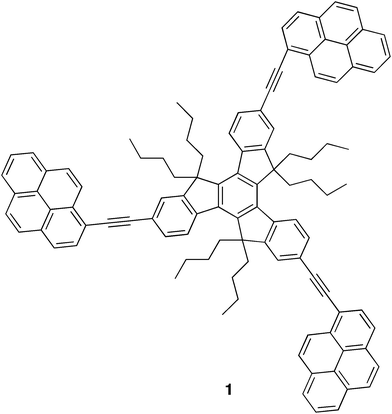 |
| | Fig. 1 Structure of fluorophore 1. | |
2. Experimental
2.1. Materials and instruments
All reagents and solvents used in the reactions were reagent grade purchased from Sigma-Aldrich (USA), Fluka® (Switzerland), or Merck® (Germany). Truxene was prepared from 3-phenylpropionic acid according to a literature procedure.23 Solvents for reaction workup and chromatography were bulk commercial grade and distilled prior to use. Analytical thin layer chromatography (TLC) was carried out on Merck Kieselgel 60 F254 aluminium-backed silica plates (Merck KgaA, Darmstadt, Germany). Flash column chromatography was performed using Merck Kieselgel 60G silica gel and eluting with the solvent system stated. Water refers to distilled water.
All 1H NMR and 13C NMR spectra were determined on a Varian Mercury NMR spectrometer, which operated at 400 MHz for 1H and 100 MHz for 13C nuclei (Bruker 400 MHz NMR spectrometer). Mass spectra were recorded on a Microflex MALDI-TOF mass spectrometer (Bruker Daltonics) using doubly recrystallized a-cyano-4-hydroxycinnamic acid (CCA) and dithranol as a matrix. Absorption spectra were measured by using Shimadzu UV-2550 UV-vis spectrophotometer. Fluorescence spectra were recorded on a Varian Cary Eclipse spectrofluorometer. The maximum absorption wavelength was used as the excitation wavelength of each fluorophore and the emission was recorded from 390 to 600 nm. A solution of fluorophore was prepared in CHCl3 and aqueous THF.
2.2. Synthesis
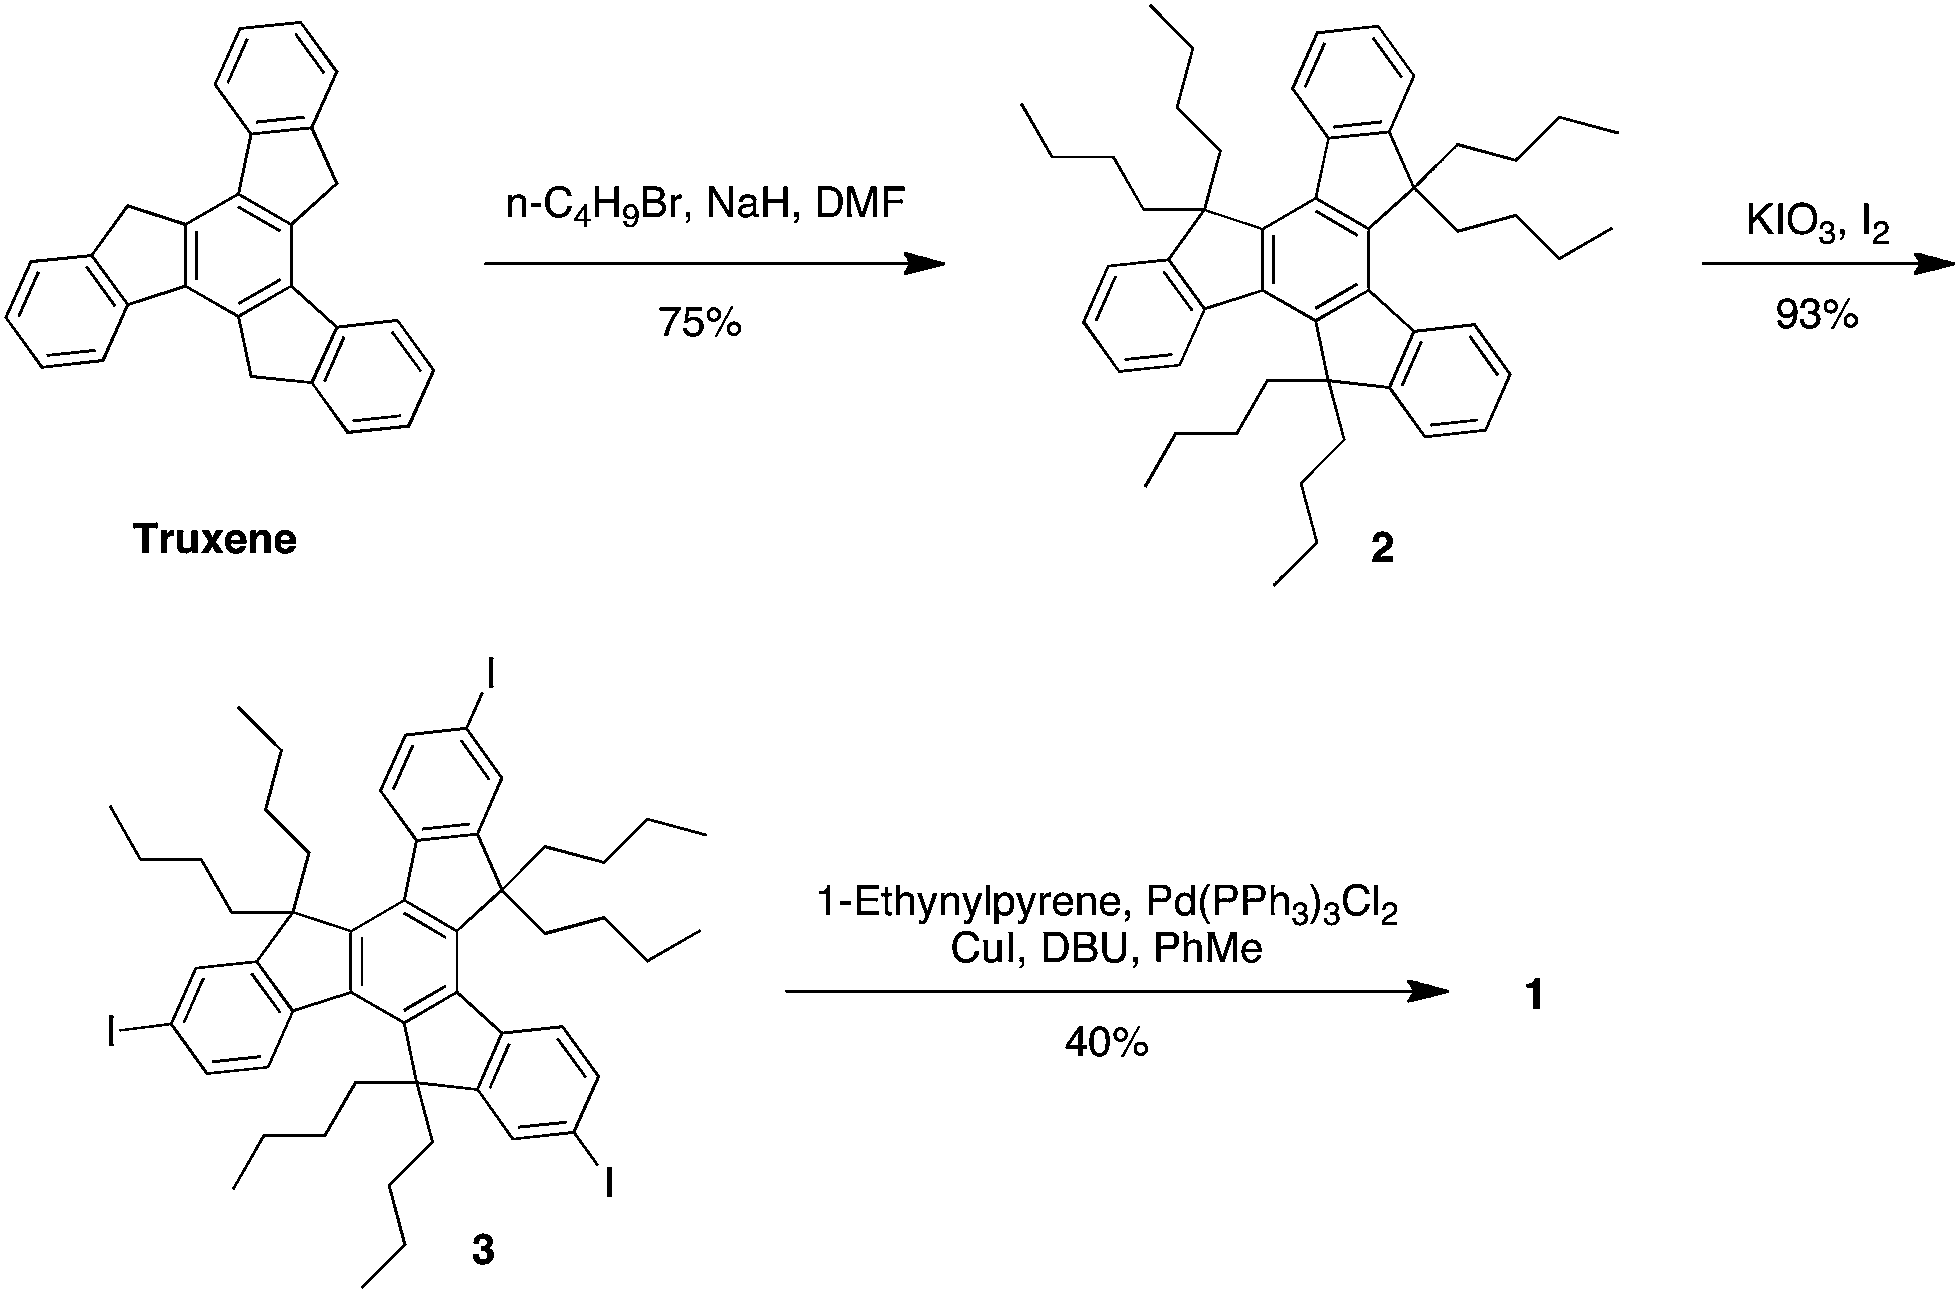
5,5,10,10,15,15-Hexabutyl-truxene (2). This compound was prepared according to a literature procedure24 with a slight modification as the use of n-BuLi in anhydrous THF at −78 °C was replaced by NaH in DMF at 0 °C. Thus, sodium hydride (2.2 g, 54.49 mmol) was added to a stirred solution of truxene (1.5 g, 4.54 mmol) in DMF (50 mL) at 0 °C under nitrogen atmosphere. The solution was allowed to warm until room temperature and stirred for 30 min, then followed by an addition of n-butyl bromide (5.8 mL). The reaction mixture stirred overnight at room temperature was poured into water and extracted with EtOAc. The combined organic layer was dried over MgSO4, filtered, and concentrated in vacuo. The crude product was purified by flash column chromatography using hexane as an eluent to yield 2 as white solid (2.3 g, 75%). mp 193–194 °C. IR (KBr) νmax cm−1: 2956, 2918, 2858, 1463, 1372, 1033. 1H NMR (CDCl3): δ 8.38 (d, J = 7.4 Hz, 3H), 7.46 (dd, J = 7.1 and 1.3 Hz, 3H), 7.40–7.35 (m, 6H), 3.02–2.94 (m, 6H), 2.12–2.07 (m, 6H), 0.91–0.85 (m, 12H), 0.52–0.42 (m, 30H). 13C NMR (CDCl3) δ 153.7, 145.0, 140.4, 138.5, 126.4, 126.0, 124.7, 122.3, 55.6, 36.7, 26.6, 22.9, 13.8. MALDI-TOF calcd for C51H66, 678.52, found, 677.85 (M).
5,5,10,10,15,15-Hexabutyl-2,7,12-triiodo-truxene (3). This compound was prepared according to a literature procedure25 with a slight modification as the use of HIO3 was replaced by KIO3. Thus, CCl4 (1 mL) was added to a solution of 2 (0.26 g, 0.38 mmol) in a 100![[thin space (1/6-em)]](https://www.rsc.org/images/entities/char_2009.gif) :40:1.5 mixture of CH3COOH–H2SO4–H2O (5 mL). KIO3 (0.08 g, 0.32 mmol) and I2 (0.5 g, 1.91 mmol) were then added to the reaction mixture allowed to heat to 80 °C and stirred for 4 h. The reaction mixture was cooled to room temperature and poured into water. The crude product obtained by filtration was purified by precipitation in ethanol to afford 3 as white powder (3.7 g, 93%); mp 312–314 °C. IR (KBr) νmax cm−1: 2953, 2915, 2849, 1453, 1353, 1180, 873, 823, 788. 1H NMR (CDCl3): δ 8.07 (d, J = 8.4 Hz, 3H), 7.76 (s, 3H), 7.71 (d, J = 8.4 Hz, 3H), 2.88–2.81 (m, 6H), 2.05–2.00 (m, 6H), 0.92–0.84 (m, 12H), 0.52–0.41 (m, 30H). 13C NMR (CDCl3) δ 156.4, 145.6, 140.0, 138.2, 135.8, 132.1, 126.8, 93.2, 56.1, 36.9, 26.9, 22.7, 13.8. Elemental analysis: calcd for C51H63I3: C 57.96, H 6.01, I 36.03; found: C 57.56, H 6.03, I 36.41.
:40:1.5 mixture of CH3COOH–H2SO4–H2O (5 mL). KIO3 (0.08 g, 0.32 mmol) and I2 (0.5 g, 1.91 mmol) were then added to the reaction mixture allowed to heat to 80 °C and stirred for 4 h. The reaction mixture was cooled to room temperature and poured into water. The crude product obtained by filtration was purified by precipitation in ethanol to afford 3 as white powder (3.7 g, 93%); mp 312–314 °C. IR (KBr) νmax cm−1: 2953, 2915, 2849, 1453, 1353, 1180, 873, 823, 788. 1H NMR (CDCl3): δ 8.07 (d, J = 8.4 Hz, 3H), 7.76 (s, 3H), 7.71 (d, J = 8.4 Hz, 3H), 2.88–2.81 (m, 6H), 2.05–2.00 (m, 6H), 0.92–0.84 (m, 12H), 0.52–0.41 (m, 30H). 13C NMR (CDCl3) δ 156.4, 145.6, 140.0, 138.2, 135.8, 132.1, 126.8, 93.2, 56.1, 36.9, 26.9, 22.7, 13.8. Elemental analysis: calcd for C51H63I3: C 57.96, H 6.01, I 36.03; found: C 57.56, H 6.03, I 36.41.
Fluorophore 1. A mixture of 3 (0.30 g, 0.28 mmol), Pd(PPh3)2Cl2 (18 mg, 0.03 mmol), CuI (5.0 mg, 0.03 mmol), 1-ethynylpyrene (0.23 g, 1.02 mmol) in toluene (10 mL) and 1,8-diazabicyclo[5.4.0]undec-7-ene (DBU) (0.23 mL) was stirred at room temperature for 24 h. The reaction mixture was concentrated in vacuo, the residue was eluted through a flash column chromatography using hexane to give 1 as a dark yellow solid (15 mg, 40%); mp: >300 °C. IR (KBr) νmax cm−1: 2918, 2849, 1453, 1374, 840, 710. 1H-NMR (CDCl3) δ 8.82 (d, J = 9.1 Hz, 3H), 8.51 (d, J = 8.7 Hz, 3H), 8.35–8.03 (m, 24H), 7.86–7.84 (m, 6H), 3.11–3.04 (m, 6H), 2.30–2.22 (m, 6H), 1.09–0.93 (m, 12H), 0.55–0.49 (m, 30H). 13C-NMR (CDCl3) δ 154.1, 146.4, 140.7, 138.4, 132.1, 131.52, 131.47, 131.36, 130.37, 129.9, 128.6, 128.4, 127.48, 126.45, 125.9, 125.83, 125.78, 125.5, 125.0, 124.8, 124.6, 121.6, 118.2, 96.2, 89.4, 56.0, 36.9, 29.8, 26.8, 23.1, 14.0. MALDI-TOF calcd for C105H90 1351.71, found: 1352.91 (M + 1).
3. Results and discussion
3.1. Synthesis
The synthesis of fluorophore 1 began with the preparation of truxene from the commercially available dihydrocinnamic acid with PPA using a procedure described by Yuan et al.19 In order to improve the solubility and prevent the aggregation by π–π stacking, a multiple alkylation at the three methylene units of truxene core was achieved by treatment with NaH and n-butyl bromide in DMF to provide the hexabutylated truxene core 2 in 75% yield (Scheme 1). Selective iodination of 2 with KIO3 and I2 afforded the triiodo 3 in an excellent yield of 93% after crystallization in ethanol. Sonogashira coupling of 3 with 1-ethynylpyrene was achieved using Pd(PPh3)2Cl2 and CuI catalytic system, to furnish compound 1 in 40% yield. Structural elucidation was completed by several spectroscopic techniques involving IR, 1H-NMR, 13C-NMR, and MALDI-TOF.
 |
| | Scheme 1 Synthesis of fluorophore 1 from truxene. | |
3.2. Photophysical properties
The UV-vis spectrum of 1 in CHCl3 and 10% H2O in THF are relatively similar. They show two maximum absorption peaks at 388 and 412 nm in CHCl3 solution, and 386 and 410 nm when dissolved in 10% H2O in THF (Fig. 2 and Table 1). However, the molar extinction coefficients in two solvents are significantly different, probably due to the lower solubility of the compound in aqueous THF. The two absorption maxima suggested two distinctly different conformations due to the rotation of the bond between the truxene and pyrene pendant which may allow a full or partial conjugation. The fluorophore also possesses two maximum emission peaks at 415 to 442 nm in CHCl3 solution with a high quantum yield of 71%. The emission spectrum of the fluorophore in 10% H2O in THF remained quite similar to that of the CHCl3 solution but the quantum efficiency decreased to 53%. This indicated that the compound may aggregate in aqueous solution resulting in self-quenching and lower quantum yield. In addition, the higher polar solvent could stabilize the fluorophore in the excited state, causing higher degree of geometrical relaxation and loss of energy in non-radiative pathways. In comparison with the parent truxene, the absorption and emission of fluorophore 1 shifted towards visible range which can benefit its applications as naked-eye fluorescent chemosensor for detection of nitroaromatic compounds.
 |
| | Fig. 2 Normalized absorption and emission spectra of 1 in CHCl3 and aqueous THF. | |
Table 1 Photophysical property of truxene and 1 in CHCl3 and 10% H2O in THF
| Compound |
Absorption |
Emission |
| λmax (nm) |
logε (M−1 cm−1) |
λmax (nm) |
Φ (%) |
| 2-Aminopyridine in 0.1 M H2SO4 (Φ = 60%) was used as the standard. Quinine sulfate in 0.1 M H2SO4 (Φ = 54%) was used as the standard. |
| Truxene (CHCl3) |
275 |
4.21 |
359 |
<0.01 |
| Truxene (THF–H2O) |
273 |
4.23 |
357 |
6a |
| 1 (CHCl3) |
388, 412 |
5.27 |
415, 442 |
71b |
| 1 (THF–H2O) |
386, 410 |
4.95 |
415, 440 |
53b |
3.3. Selectivity screening for nitroaromatic compounds
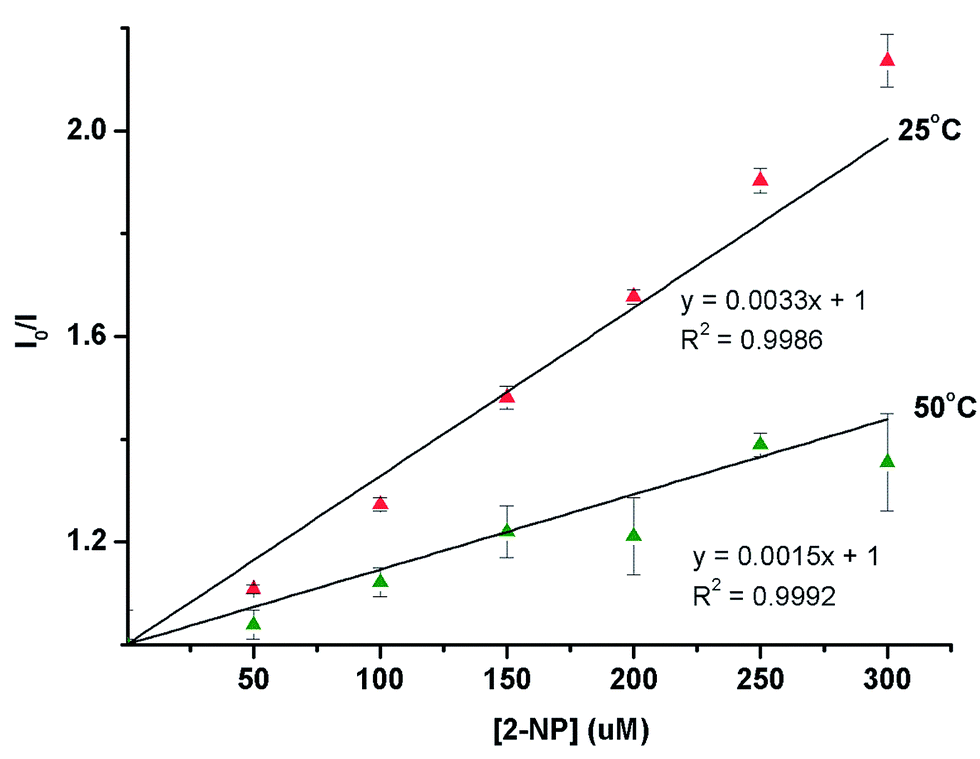
Next, we investigated the sensing selectivity of 1 in CHCl3 (1 μM) and aqueous THF towards various analytes including nitroaromatic compounds such as 2,4,6-trinitrotoluene (TNT), 2,4-dinitrotoluene (DNT), 2,4-dinitrophenol (DNP), picric acid (PA), 2- or 3- or 4-nitrophenol (NP), nitrobenzene (NB), 4-nitrobenzoic acid (NBA), and non-nitroaromatic analogs such as benzoic acid (BA), benzophenol (BP) and 2-chlorobenzoic acid (CBA). The fluorescence signal of 1 in CHCl3 could be selectively quenched by 2-NP (Fig. 3), whereas the selectivity towards PA was observed for the aqueous THF solution (Fig. 4). For the detection of 2-NP in CHCl3, a Stern–Volmer plot revealed a linear relationship between the fluorescence quenching ratio (I0/I) and the concentration of 2-NP in the range below 250 μM. With the Stern–Volmer constant of 3.2 × 10³ M−1, a detection limit for 2-NP at three-time-noise was determined as 1.54 ppm.
 |
| | Fig. 3 Fluorogenic responses and emission spectra (inset) of 1 (1 μM) towards various analytes (1 mM) in CHCl3. | |
 |
| | Fig. 4 Fluorogenic responses and emission spectra (inset) of 1 (1 μM) towards various analytes (0.1 mM) in 10% aq. THF. | |
On the other hands, the quenching efficiency by PA in aqueous THF could be enhanced by the addition of water but the water content above 50% led to detrimental aggregation that diminished the initial fluorescence signal (Fig. S1†). Upon an optimization of the water content, the highest quenching efficiency was obtained when 10% of water in THF was used as the solvent (Fig. S2†). A variation of PA concentration led to a Stern–Volmer constant of 3.6 × 10⁴ M−1, from which the detection limit for PA at 0.15 ppm was obtained.
3.4. Investigation of sensing mechanism
The electronic absorption properties of 1, 2-nitrophenol, and picric acid are summarized in Table 2 (for the corresponding spectra see Fig. S14 and S15†), it is likely that the selective fluorescence quenching towards 2-NP and PA might result from the inner filter effect (IFE) or the competitive absorption by these analytes. We thus performed an empirical analysis in order to determine whether the fluorescence quenching was caused solely by the IFE. Hence, we constructed a plot between the absorbance fractions of 1 (A1/(A1 + ANAC))26 against the ratios of emission integrals in the presence and absence of analytes (Fig. 5). The data indicated that the fluorescent response decreased when fraction of photons absorbed by 1 was lowered, but the decreasing rates of these two parameters were unequal. Therefore, there should be other quenching mechanisms apart from the IFE taking place in these systems, for instance, π-stacking and subsequent photo-induced electron transfer.
Table 2 Absorption properties of 1, 2-NP and PA in CHCl3 and aqueous THF
| |
Compound |
λmax (nm) |
ε at λmax (M−1 cm−1) |
ε at λexcited (M−1 cm−1) |
| CHCl3 |
1 |
388 |
187,328 |
187,328 |
| 2-Nitrophenol |
353 |
865 |
373 |
| aq. THF |
1 |
386 |
88,768 |
88,768 |
| Picric acid |
377 |
6972 |
6440 |
 |
| | Fig. 5 A plot between fraction of photons absorbed by 1 versus the quenching efficiencies calculated by the integrated emission intensities in the absence and presence of analytes. | |
Since the ionization of PA depends on the pH of the aqueous medium, the fluorescent quenching efficiencies of 1 by picric acid in THF with 10% buffer of various pHs were investigated. Data from Fig. S16† indicated that the sensitivity was independent to the pH of the medium. This suggested that the sensing mechanism should not involved the ionization of PA. The mechanism by which fluorophore 1 interacts with 2-NP and PA was further examined from the Stern–Volmer plots at different temperatures (Fig. 6 and 7). It was found that the quenching efficiency decreased as the temperature increased from 25 to 50 °C. This suggested a static mode of quenching in which the pyrene units in the fluorophore may interact with electron-deficient analysts by means of π-stacking. This complex may dissociate upon increasing of the temperature, thus resulting in lower quenching efficiencies.
 |
| | Fig. 6 Stern–Volmer plots for the fluorescent responses of 1 towards 2-nitrophenol in CHCl3 at 25 and 50 °C. | |
 |
| | Fig. 7 Stern–Volmer plots for the fluorescent responses of 1 towards picric acid in 10% H2O in THF at 25 and 50 °C. | |
4. Conclusion
A new truxene derivative with three ethynylpyrene pendants was successfully synthesized via the Sonogashira coupling. The compound exhibits the absorption and emission maxima at longer wavelengths than the parent pyrene due to the extended conjugated systems. The quantum efficiency is also enhanced to 71 and 53% in CHCl3 and aqueous THF, respectively. In CHCl3, the compound showed a selective fluorescence quenching in the presence of 2-nitrophenol with a limit of detection of 1.54 ppm, whereas the selectivity in aqueous THF shifted towards picric acid with a detection limit of 0.15 ppm. An investigation on the fractions of photons absorbed by the fluorophore in the presence of analytes versus the quenching efficiencies suggested that the inner filter effect was responsible for the fluorescence quenching, but other mechanisms might also take place. The Stern–Volmer plots at different temperatures revealed that the signal turn-off involved a static quenching, presumably due to the π–π interaction between the fluorophore and analytes.
Acknowledgements
This work is supported by the Higher Education Research Promotion and National Research University Project of Thailand, Office of the Higher Education Commission (AM1006A-56), the Ratchadapiseksomphot Endowment Fund of Chulalongkorn University (RES560530125-AM), and the Nanotechnology Center (NANOTEC), NSTDA, Ministry of Science and Technology, Thailand, through its program on Center of Excellence Network. P.S. thanks the financial support from the Commission on Higher Education (CHE) under the program Strategic Scholarships for Frontier Research Network for the joint Ph. D Program Thai Doctoral degree and Pibulsongkram Rajabhat University.
Notes and references
- S. J. Toal and W. C. Trogler, J. Mater. Chem., 2006, 16, 2871 RSC.
- M. E. Germain and M. J. Knapp, Chem. Soc. Rev., 2009, 38, 2543 RSC.
- K.-S. Ju and R. E. Parales, Microbiol. Mol. Biol. Rev., 2010, 74, 250 CrossRef CAS PubMed.
- Y. Wang, A. La, Y. Ding, Y. Liu and Y. Lei, Adv. Funct. Mater., 2012, 22, 3547 CrossRef CAS.
- X. Deng and D. Wu, RSC Adv., 2014, 4, 42066 RSC.
- V. Bhalla, H. Arora, H. Singh and M. Kumar, Dalton Trans., 2013, 42, 969 RSC.
- S. Zhang, L. Ding, F. Lü, T. Liu and Y. Fang, Spectrochim. Acta, Part A, 2012, 97, 31 CrossRef CAS PubMed.
- H. Du, G. He, T. Liu, L. Ding and Y. Fang, J. Photochem. Photobiol., A, 2011, 217, 356 CrossRef CAS PubMed.
- S. Shanmugaraju, S. A. Joshi and P. S. Mukherjee, J. Mater. Chem., 2011, 21, 9130 RSC.
- S. Kumar, N. Venkatramaiah and S. Patil, J. Phys. Chem. C, 2013, 117, 7236 CAS.
- H. Bai, C. Li and G. Shi, Sens. Actuators, B, 2008, 130, 777 CrossRef CAS PubMed.
- G. He, N. Yan, J. Yang, H. Wang, L. Ding, S. Yin and Y. Fang, Macromolecules, 2011, 44, 4759 CrossRef CAS.
- T. Khayamian, M. Tabrizchi and M. T. Jafari, Talanta, 2003, 59, 327 CrossRef CAS.
- Y. Ma, S. Huang and L. Wang, Talanta, 2013, 116, 535 CrossRef CAS PubMed.
- N. Enkin, E. Sharon, E. Golub and I. Willner, Nano Lett., 2014, 14, 4918 CrossRef CAS PubMed.
- Y. Ma and L. Wang, Talanta, 2014, 120, 100 CrossRef CAS PubMed.
- N. Dey, S. K. Samanta and S. Bhattacharya, ACS Appl. Mater. Interfaces, 2013, 5, 8394 CAS.
- N. Earmrattana, M. Sukwattanasinitt and P. Rashatasakhon, Dyes Pigm., 2012, 93, 1428 CrossRef CAS PubMed.
- M.-S. Yuan, Q. Wang, W.-J. Wang, T.-B. Li, L. Wang, W. Deng, Z.-T. Du and J.-R. Wang, Dyes Pigm., 2012, 95, 236 CrossRef CAS PubMed.
- K. M. Choi, K.-Y. Kim, T.-D. Kim, R. R. Das, B. K. Choi, J. J. Park, J.-M. Kim and K.-S. Lee, J. Nanosci. Nanotechnol., 2010, 10, 6916 CrossRef CAS PubMed.
- S.-C. Yuan, Q. Sun, T. Lei, B. Du, Y.-F. Li and J. Pei, Tetrahedron, 2009, 65, 4165 CrossRef CAS PubMed.
- M.-S. Yuan, Q. Wang, W. Wang, D.-E. Wang, J. Wang and J. Wang, Analyst, 2014, 139, 1541 RSC.
- M.-S. Yuan, Z.-Q. Liu and Q. Fang, J. Org. Chem., 2007, 72, 7915 CrossRef CAS PubMed.
- H. Zhou, X. Zhao, T. Huang, R. Lu, H. Zhang, X. Qi, P. Xue, X. Liu and X. Zhang, Org. Biomol. Chem., 2011, 9, 1600 CAS.
- S. Diring and R. Ziessel, Tetrahedron Lett., 2009, 50, 1203 CrossRef CAS PubMed.
- The number of absorbed photons was calculated from the concentration and molar absorptivity at excitation wavelength of 1. The fraction of photons absorbed by 1 was calculated based on the total number of photons absorbed by 1 and each analyte..
Footnote |
| † Electronic supplementary information (ESI) available. See DOI: 10.1039/c4ra11407h |
|
| This journal is © The Royal Society of Chemistry 2014 |
Click here to see how this site uses Cookies. View our privacy policy here.