Synthesis of TiO2 hollow spheres using titanium tetraisopropoxide: fabrication of high efficiency dye sensitized solar cells with photoanodes of different nanocrystalline TiO2 sub-layers

Maziar Marandi*a, Samira Feshkia, Mahboubeh Naeimi Sani Sabeta, Zakie Anajafia and Nima Taghaviniab
aPhysics Department, Faculty of Science, Arak University, Arak 38156, Iran. E-mail: m-marandi@araku.ac.ir; Fax: +98 863 4173406; Tel: +98 863 4173318
bPhysics Department, Sharif University of Technology, Tehran 14588, Iran. E-mail: taghavinia@sharif.edu; Fax: +98 21 66022711; Tel: +98 21 66164570

Received 25th August 2014 , Accepted 30th October 2014

First published on 30th October 2014


Abstract

In this research TiO2 hollow spheres with different diameters were prepared using titanium tetraisopropoxide (TTIP) as the TiO2 precursor. Carbon spheres with average sizes of 230, 325 and 450 nm were prepared as the templates by hydrothermal method. Then TiO2 was deposited on the surface of the carbon spheres through a liquid phase deposition (LPD) process. This two dimensional growth was performed in an appropriate concentration of TTIP and different LPD times. Finally the TiO2 hollow spheres were achieved for specific LPD times by burning the carbon templates. Two kinds of TiO2 nanocrystals with sizes around 20 nm were hydrothermally grown in acidic (pH = 1.5) and basic (pH = 10) autoclaving pHs. These nanocrystals were deposited onto FTO glass substrates and applied in the photoanode of dye sensitized solar cells. The layers were transparent and demonstrated a strong bonding to the FTO substrates. Three kinds of TiO2 hollow spheres with external diameters around 310, 435 and 550 nm were also selected and used in a modified paste preparation process. They were finally deposited on the surface of transparent sub-layers of the TiO2 NCs to enhance the light scattering. According to the results, an energy conversion efficiency of 9.7% was achieved for the cell with 2TA-1Sc photoanode. This photoanode was composed of two sub-layers of TiO2 NCs prepared in acidic autoclaving pH and a layer of scattering hollow spheres. An efficiency of 9.4% was also attained for the cell with 1TB-1Sb photoanode including one layer of TiO2 NCs prepared in basic autoclaving pH and a layer of scattering hollow spheres. These efficiencies represented an increase of about 39% and 118% compared to those of the cells with 2TA and 1TB photoanodes, respectively.

Introduction

Dye sensitized solar cells (DSSCs) have attracted more interest in recent years. This is due to their rather high energy conversion efficiency, low cost materials and ease of fabrication.1–4 After introduction of DSSCs by Michael Gratzel in 1991,1 several studies have been performed to increase the energy conversion efficiency.5−13 The major challenge has been improving the light collection efficiency and electronic properties.14–16 Numerous works have been carried out on different dye sensitizers,17–20 synthesis of different shapes of nanostructures such as nanoparticles, nanorods and nanotubes for application in the photoanode of DSSCs,11–13,21–24 paste preparation and deposition methods,25–27 controlling the light scattering inside the cells,28–31 optimization of the hole transport electrolyte32–35 and improvement of the counter electrode.36–40

Among them, one of the main approaches to enhance the energy conversion efficiency is using some sorts of sub-micrometer size nanostructures for light scattering. This could mainly increase the path length of the incident photons inside the nanocrystalline photoanode of the DSSCs and improve the light harvesting efficiency. Several researches have been done on the synthesis of different light scattering TiO2 and ZnO structures and their influence on the efficiency.41–43 These sub-micrometer size structures are grown either directly44–48 or by application of some templates of soft materials. The templates could be finally sacrificed to form hollow scattering structures.49–53 TiO2 hollow spheres are one of the well-scattering structures due to their multiple light diffractions and reflections.54 This structure could be prepared using sub-micrometer size carbon or polystyrene templates or even by template-free methods.53–62 In the template-free methods, the size distribution of TiO2 hollow spheres is quite wide with sizes in the range of 200 nm to several micrometers.47,48,61 This may fail the possibility of optimizing the light scattering by controlling the diameter of the hollow spheres. The mentioned optimization could be well-performed when the TiO2 hollow spheres are synthesized using the carbon or polystyrene templates.52,58 Nevertheless, there are some interesting reports on fabrication of high performance DSSCs with TiO2 hollow spheres of wide size distribution60 or in contrast with nearly uniform sizes.56–58 The TiO2 precursors which are frequently used are tetrabutyl titanate (TBT), titanium tetrachloride (TiCl4) and diammonium titanium hexafluoride ((NH4)2TiF6) as reported in the literatures.53–60 The last precursor could also create rather complicated synthesis method for the TiO2 hollow spheres.60 There are also a few reports on using titanium tetraisopropoxide (TTIP) for the synthesis of the TiO2 hollow spheres.56 There, the polystyrene spheres are used as the templates for the LPD process. As we know, TiO2 NCs are applied in the photoanode of the DSSCs for the effective dye adsorption and sensitization.61 The usual nanocrystals which are used are conventional P25 or hydrothermally grown TiO2 NCs.53–62 The composing NCs and the thickness of the photoanode film are commonly fixed in different reports.53–62 Finally the energy conversion efficiencies which are improved by application of scattering structures fall in the range of 4.5% to 9.0% as reported in the literatures.53–62

In this research carbon spheres with average sizes of 230, 325 and 450 nm were synthesized by hydrothermal method as the templates. Afterward, a thin layer of TiO2 was deposited on the surface of the carbon spheres by liquid phase deposition method. Here, Titanium tetraisopropoxide (TTIP) was used as the precursor for the hydrolysis process and TiO2 formation. Finally, the well-formed TiO2 hollow spheres were achieved for special LPD times after burning the carbon templates. Three kinds of TiO2 hollow spheres with different outer diameters and shell thickness were selected and applied as the scattering component in DSSCs. TiO2 nanocrystals (NCs) with sizes around 20 nm were also prepared by hydrothermal method in two different acidic (pH = 1.5) and basic (pH = 10) autoclaving pHs. The NCs were used in preparation of 18 wt% and 34 wt% TiO2 pastes and applied in the photoanode of the DSSCs. The photoanode layers made of these nanocrystals were well-transparent and tightly bonded to the FTO substrates. The paste of TiO2 hollow spheres was also prepared by a modified procedure. Finally a layer of TiO2 hollow spheres was deposited on the surface of the nanocrystalline TiO2 sub-layers of the photoanodes as the scattering layer. The effect of increased light scattering inside the cells for two different kinds of TiO2 transparent sub-layers with different thicknesses were investigated and discussed. The best cell demonstrated an energy conversion efficiency of 9.7% with optimized photoanode structure.

Experimental

Preparation of TiO2 hollow spheres

Carbon spheres with different sizes were synthesized by a hydrothermal method.63 Briefly, an aqueous solution of glucose with different concentrations of 0.5 M, 1.0 M and 1.5 M was prepared in the first step. Then it was transferred to a 100 ml Teflon-lined stainless steel autoclave and heated at 180 °C for 8 h. The dark-brown precipitate was centrifuged and washed with ethanol and DI water for several times. Finally the carbon spheres were dried at 70 °C for 5 h. TiO2 Hollow Spheres were prepared by liquid phase deposition (LPD) of TiO2 on the surface of the carbon sphere templates. 0.2 g of the as-prepared carbon spheres was added to 20 ml ethanol solution and fully dispersed. Then 0.002 mol of Titanium tetraisoperpoxide (TTIP) was added to this solution. The mixture was stirred at room temperature for 24 h, 48 h and 72 h for the LPD process. The C/TiO2 precipitate was centrifuged and washed with ethanol and DI water and dried at 40 °C for 10 h. Finally the precipitate was heated at 450 °C to remove the carbon templates and form the pure TiO2 structures.

Synthesis of TiO2 nanocrystals

TiO2 NCs were prepared by hydrothermal method in acidic (pH = 1.5) and basic (pH = 10) autoclaving pHs. For preparation of TiO2 NCs in acidic autoclaving pH,64 0.2 mole of acetic acid was added to 0.2 mole of titanium tetraisopropoxide (TTIP) and vigorously stirred. Then 19.6 ml of DI water was added for the hydrolysis process and homogenized. Afterward, a quantity of 0.26 ml of HNO3 was added and heated at 80 °C for 75 min. The final solution was transferred to a Teflon lined stainless steel autoclave and heated at 230 °C for 12 h.

For the synthesis of TiO2 NCs in basic solution 0.018 mole of TTIP was added to 9.6 ml of DI water and stirred. Then it was centrifuged and mixed with 10 ml of DI water. The pH of the solution was set on 10.0 by adding some drops of Triethylamine (TEA) 0.6 M and transferred to proper autoclave. Finally the solution was heated at 130 °C and 230 °C for 4 h and 10 h, respectively.

Fabrication of DSSCs

Two kinds of TiO2 NCs synthesized in acidic and basic autoclaving pHs were used in preparation of 18 wt% and 34 wt% TiO2 pastes, respectively. The pastes were prepared based on using terpineol and ethyl cellulose as reported earlier.64–67 Three kinds of TiO2 hollow spheres were also separately used for paste preparations with similar procedure. The only exception was removing some strong ultrasonic process which could destroy the structures. Finally one or two layers of different TiO2 NCs were deposited on glass/FTO substrates by doctor-blade method. An over layer of TiO2 hollow spheres were also deposited as the scattering layer. Each layer was dried at 120 °C to be stable for the next deposition. The photoanodes were finally annealed at 325 °C, 375 °C, 450 °C and 500 °C for 5 min, 5 min, 15 min and 15 min, respectively. The dye adsorption process was performed using a 0.3 mM ethanolic solution of dye N719 for 24 h. The other cell fabrication steps i.e. the preparation of Platinum counter electrodes by 50 mM H2PtCl6 solution, cell assembling using 60 μm thermoplastic spacer, injection of I/I−3 electrolyte and final sealing were successively performed.

Characterization

SEM images were taken using a T-Scan scanning electron microscope. Transmission electron microscope (TEM) images were obtained using a Philips EM 208 TEM. Optical spectroscopy was performed by a Mecasys Optizen spectrophotometer. The X-ray diffraction pattern was also recorded by a Philips Xpert-pro system with a Cu Kα radiation source. The current–voltage characteristics were measured under AM 1.5, 100 mW cm−2 simulated light radiation. The electrochemical impedance spectroscopy was performed with an Eco Chemie Autolab potentiostat.

Results and discussion

Carbon spheres with different sizes were synthesized by a hydrothermal method. Then they were used for preparation of the TiO2 hollow spheres for application in the photoanode of the DSSCs. Fig. 1 demonstrates the SEM images of the carbon spheres prepared at different concentrations of the glucose solution. According to the results, the carbon structures are well-spherical while their average size is increased with the glucose concentration. The size distribution histograms of the carbon spheres are also shown in the inset of the Fig. 1(a), (c) and (e). It could be seen that the dominant sizes of carbon spheres are about 230 nm, 320 nm and 435 nm for the glucose concentration of 0.5 M, 1.0 M and 1.5 M, respectively. Carbon spheres were then used as the templates in a liquid phase deposition (LPD) process. As mentioned earlier, the carbon templates were quite dispersed in sufficient amount of ethanol and LPD process was carried out using titanium tetraisopropoxide (TTIP) as the TiO2 precursor. In this stage, a thin layer of TiO2 was supposed to be formed on the surface of the carbon spheres. Finally, the carbon cores were sacrificed by performing a calcination process to get submicron-scale TiO2 hollow spheres.
image file: c4ra09244a-f1.tif
Fig. 1 SEM images of the carbon spheres prepared in different glucose concentrations of 0.5 M (a and b), 1.0 M (c and d) and 1.5 M (e and f). The insets in (a), (c) and (e) demonstrate the corresponding size distribution histograms of the carbon spheres.

Fig. 2 shows the SEM images of the TiO2 structures prepared by using 230 nm carbon spheres in different LPD times. The carbon templates were burned in the furnace at 450 °C. According to the Fig. 2(a)–(e), spherical shape TiO2 structures are properly formed in the LPD times of 24 h and 48 h. Besides, there are several perforated TiO2 spheres which are created by evolution of CO2 during the removal of the carbon core spheres. According to the Fig. 2(b), the internal and external diameters of the TiO2 hollow spheres formed in LPD time of 24 h are about 150 and 260 nm, respectively. As the internal diameter is smaller than the size of applied carbon templates it could be concluded that the TiO2 hollow spheres are shrank during the calcination process. The results are different for preparation of TiO2 structures in LPD time of 48 h. Based on the Fig. 2(c), the external diameter of the TiO2 hollow spheres is around 310 nm in this state. The thickness of the shell is also estimated about 80 nm using the image of the perforated TiO2 spheres as shown in Fig. 2(d). It could be deduced that the longer LPD times have resulted in larger TiO2 hollow spheres. Fig. 2(e) represents the SEM image of the TiO2 structures formed in the LPD time of 72 h. It could be seen that the structures have considerably lost their spherical shapes. There are just a small amount of the remnants of the spherical structures and also many formless configurations. The reason sounds to be related to the strong damage which is created during the removal of the templates in this higher thickness of the TiO2 shells. It is also possible that some new agglomerations are separately formed during this longer LPD time.


image file: c4ra09244a-f2.tif
Fig. 2 SEM images of the TiO2 structures grown on the surface of 230 nm carbon templates at LPD times of 24 h (a and b), 48 h (c and d) and 72 h (e) after burning the templates.

Fig. 3 demonstrates the SEM images of the TiO2 structures prepared by using 320 nm carbon spheres in different LPD times. According to the results, the spherical configuration of templates is preserved in LPD time of 24 h (Fig. 3(a)). It could be repeatedly seen that there are some perforated TiO2 hollow spheres due to the evolution of CO2 gas during the calcination. Besides, the internal diameter is roughly around 190 nm. This could show the obvious shrinkage of TiO2 hollow spheres through the calcination. The external diameter is also about 435 nm which results in a shell thickness around 120 nm for these TiO2 hollow spheres. Nevertheless, the spherical structures are not obtained for longer LPD times. According to the Fig. 3(b) and (c), there are several shapeless TiO2 structures and also remnants of the spherical configurations. The average size of the formless TiO2 structures is larger for the preparation in LPD time of 72 h. This could be due to the higher amount of TiO2 formed during the LPD process. The shapeless structures seem to be constructed due to the damages during the removal of the carbon cores and also the template-free formation of TiO2 in longer LPD times.


image file: c4ra09244a-f3.tif
Fig. 3 SEM images of the TiO2 structures grown on the surface of 320 nm carbon templates at LPD times of 24 h (a), 48 h (b) and 72 h (c). The images are recorded after burning the carbon templates.

Fig. 4 shows the SEM images of the TiO2 structures prepared by applying 435 nm carbon templates in different LPD times. According to the Fig. 4(a), TiO2 hollow spheres are well-formed in the LPD time of 24 h. The internal diameter is roughly between 350–380 nm which shows the thermal shrinkage. The external diameter is also around 520 nm as shown in the Figure. As a result the shell thickness could be estimated about 80 nm for these TiO2 hollow spheres. The spherical TiO2 structures are slightly connected to each other as they have followed the morphology of the carbon sphere templates. Nevertheless, the spherical configurations are considerably lost in longer LPD times as shown in Fig. 4(b) and (c). The size of the shapeless structures is larger in LPD time of 72 h due to the higher amount of TiO2 formation.


image file: c4ra09244a-f4.tif
Fig. 4 SEM images of the TiO2 structures grown on the surface of 435 nm carbon templates at LPD times of 24 h (a), 48 h (b) and 72 h (c) after burning the templates.

Fig. 5 demonstrates the TEM images of the TiO2 hollow spheres prepared by using 435 nm carbon spheres in LPD time of 24 h. According to the Fig. 5(a), there are several TiO2 hollow spheres with sizes around 540 nm inside a large cluster. The shell thickness could also be more accurately estimated from the image shown in Fig. 5(b). As shown in this image, the shell thickness is about 75 nm for a typical TiO2 hollow sphere. The external diameter of this hollow sphere is also around 525 nm. As a result the shell thickness and size are in correspondence with those of the SEM images.


image file: c4ra09244a-f5.tif
Fig. 5 TEM images of the TiO2 hollow spheres prepared by using 435 nm carbon spheres in LPD time of 24 h (a and b). The insets of the figures demonstrate the same images in small size.

Finally, three different kinds of TiO2 hollow spheres were selected and applied as the scattering components in the photoanode of the DSSCs. The first one was the hollow spheres prepared by using 230 nm carbon spheres in LPD time of 48 h. These structures with external diameter of around 310 nm were called as Sa. The second type was the TiO2 hollow spheres prepared by applying 320 nm carbon spheres in LPD time of 24 h. As mentioned earlier, these structures had an external diameter about 435 nm and were called as Sb. The last scattering TiO2 structure was the hollow spheres prepared by using 435 nm carbon templates in LPD time of 24 h. These hollow spheres with external diameters around 550 nm were also named as Sc in the experiments.

Fig. 6 shows the X-ray diffraction pattern of the Sb–TiO2 hollow spheres. It can be seen that there are nine peaks located at 2θ of 25.3°, 37.8°, 48.2°, 53.9°, 55.1°, 62.7°, 68.7°, 70.4° and 75.0°. These peaks belong to the (101), (004), (200), (105), (211), (204), (116), (220) and (215) crystalline planes of the anatase phase of TiO2 using the JCPDS card no. 71-1167. The corresponding crystallite size is also estimated from the full width at half maximum (FWHM) of the (101) XRD peak. It could be roughly said that the TiO2 hollow spheres are formed by aggregation of several TiO2 nanoparticles with sizes around 28 nm.


image file: c4ra09244a-f6.tif
Fig. 6 XRD pattern of the TiO2 hollow spheres prepared by using 320 nm size carbon spheres in 24 h LPD time.

As mentioned in experimental section, two kinds of TiO2 pastes were prepared by using hydrothermally grown TiO2 NCs in acidic (paste A) and basic (paste B) autoclaving pHs. These pastes were deposited on transparent conducting oxide (TCO) substrates as one and two semi-transparent TiO2 layers to form the photoanode of the DSSCs. The photoanodes composed of TiO2 nanocrystals prepared in acidic autoclaving pH were called as 1TA (1 layer) and 2TA (2 layers). Besides, the photoanodes made of TiO2 nanocrystals prepared in basic autoclaving pH were named as 1TB (1 layer) and 2TB (2 layers). A layer of TiO2 hollow spheres was finally deposited on the top of nanocrystalline TiO2 sub-layers. This layer was called as 1Sa, 1Sb and 1Sc depending on the external diameter of the hollow spheres as mentioned earlier. The names of the photoanodes with scattering layer were formed by addition of 1Sa, 1Sb and 1Sc to the name of the nanocrystalline sub-layers. Based on the naming rule, two categories of the photoanodes i.e. 1TA, 1TA-1Sa, 1TA-1Sb, 1TA-1Sc, 2TA, 2TA-1Sa, 2TA-1Sb, 2TA-1Sc and 1TB, 1TB-1Sa, 1TB-1Sb, 1TB-1Sc, 2TB, 2TB-1Sa, 2TB-1Sb were prepared and investigated. The higher numbers of the sub-layers were not included due to the cracks which were created within the layers after the annealing process.

Fig. 7(a) and (b) demonstrate the SEM images of the nanocrystalline TiO2 sub-layers prepared in acidic and basic autoclaving pHs. The size distribution histograms of the particles are also shown in the inset of the Figures. According to the Fig. 7(a), most of the TiO2 NCs prepared in acidic autoclaving pH have sizes around 20 nm. Nevertheless, the dominant size of the TiO2 nanoparticles prepared in basic autoclaving pH is about 15 nm as shown in the Fig. 7(b). The cross-sectional SEM image of the 1TA-1Sb photoanode is also shown in Fig. 6(c). It could be seen that the scattering layer of TiO2 hollow spheres is formed on the top with a thickness of 8 μm. The underlying layer of TiO2 NCs could also be observed with a thickness around 7 μm.


image file: c4ra09244a-f7.tif
Fig. 7 SEM images of the TiO2 layers composed of the nanocrystals prepared in acidic (a) and basic (b) autoclaving pHs. The insets of the figures show the size distribution histograms of these TiO2 nanocrystals. The cross-sectional SEM image of the multilayer 1TA- 1Sb photoanode (c).

Two categories of the photoanodes were finally dye loaded and applied in the dye sensitized solar cells. Fig. 8(a) demonstrates the absorbance of the dye N719 solutions which are fully desorbed from the surface of the 1TA, 1TA-1Sa, 1TA-1Sb, and 1TA-1Sc photoanodes. It could be seen that the amount of dye adsorption is increased when TiO2 hollow spheres are applied in the photoelectrodes. Besides, the increase is small for the over-layers of 1Sb and 1Sc while it is higher for the 1Sa scattering layer. It could be deduced that the dye adsorption is enhanced for the smaller sizes of the TiO2 hollow spheres. This could be attributed to the higher surface area of the layer made of these small-size TiO2 configurations.


image file: c4ra09244a-f8.tif
Fig. 8 Absorbance of the dye N719 which is fully desorbed from the surface of the photoanodes with one (a) and two (b) transparent sub-layers of TiO2 NCs prepared in acidic autoclaving pH and one over-layer of different TiO2 hollow spheres. Similar curves for the absorbance of the desorbed dye from the surface of the photoanodes with one (c) and two (d) transparent sub-layers of TiO2 NCs prepared in basic autoclaving pH. The dye desorption is performed in 3 ml of 0.1 M solution of NaOH in a mixed solvent of ethanol and water (water/ethanol = 1[thin space (1/6-em)]:[thin space (1/6-em)]1, v/v).

Fig. 8(b) demonstrates the absorbance of the dye N719 solutions which are fully desorbed from the surface of the 2TA, 2TA-1Sa, 2TA-1Sb and 2TA-1Sc photoanodes. It could be observed that the 2TA photoanode has the least amount of dye adsorption. Besides, the existence of scattering layer has generally increased the amount the dye adsorption. According to the results, the dye adsorption of the photoanodes is increased as the size of applied TiO2 hollow spheres is decreased. It could be seen that the highest dye adsorption belongs to the 2TA-1Sa photoanode. This is due to the smaller size of the Sa scattering hollow spheres and their higher surface area. Besides, the 2TA-1Sb photoanode demonstrates higher amount of dye adsorption compared to that of the 2TA-1Sc electrode. It should be finally noticed that the amount of dye adsorption for 2TA, 2TA-1Sa, 2TA-1Sb and 2TA-1Sc photoanodes is obviously higher than that of the 1TA category of the photoanodes. This is due to the higher thickness of the nanocrystalline TiO2 sub-layer which creates higher surface area for dye adsorption.

Fig. 8(c) demonstrates the absorbance of the dye solutions which are desorbed from the surface of the 1TB, 1TB-1Sa, 1TB-1Sb and 1TB-1Sc photoanodes. The same curves are shown for the 2TB, 2TB-1Sa, 2TB-1Sb and 2TB-1Sc photoelectrodes in Fig. 8(d). It could be seen that the trend of changes in dye adsorptions is the same with what was observed for the 1TA and 2TA categories of the photoanodes. Nevertheless, the dye adsorption is higher for the photoanodes made of TiO2 NCs prepared in acidic autoclaving pHs (TA category). The reason could be attributed to the different surface area of the nanocrystalline TiO2 scaffold made of these two different kinds of TiO2 nanocrystals. The whole series of results demonstrate that the maximum increase in dye adsorption is less than 25% for the photoanodes with 1Sa scattering over-layers. Nevertheless, this increase is less than 15% for the photoelectrodes with 1Sb and 1Sc scattering layers.

Fig. 9 shows the transmission spectra of two categories of the photoanodes before the dye loading process. As represented in Fig. 9(a) and (b), the 1TA and 2TA photoanodes demonstrate a high level of transparency. According to the results, the transmission in 600 nm wavelength is about 72% and 65% for 1TA and 2TA photoanodes, respectively. It could be concluded that the 2TA photoanode is slightly more opaque than the 1TA electrode. Besides, the optical transmission is zero for the 1TA-1Sa, 1TA-1Sb, 1TA-1Sc, 2TA-1Sa, 2TA-1Sb and 2TA-1Sc photoanodes in the wavelength range of 200–1000 nm. This could show that the incident light is totally scattered by the monolayer of the TiO2 hollow spheres of the photoanodes. The appearance of the photoelectrodes with scattering layer was also white which confirms the transmissions. The same trend of changes is observed for the optical transmission of the photoanodes made of TiO2 nanocrystals which were grown in basic autoclaving pHs. Fig. 9(c) and (d) represent the transmission spectra of the 1TB, 1TB-1Sa, 1TB-1Sb, 1TB-1Sc and 2TB, 2TB-1Sa, 2TB-1Sb and 2TB-1Sc photoanodes. According to the results 1TB and 2TB photoanodes are well-transparent. The value of transmission in 600 nm wavelength is about 76% and 65% for these two photoanodes, respectively Besides, the transmission is nearly zero for the other photoelectrodes i.e. the ones with the scattering layer of the TiO2 hollow spheres. This could repeatedly show the high level of light scattering in these photoelectrodes. Fig. 9(e) shows the diffuse reflectance spectra (DRS) of the 1Sa, 1Sb and 1Sc layers of TiO2 hollow spheres and also 1TA and 1TB films of the TiO2 nanocrystals. It could be observed that the different layers of hollow spheres have perfectly scattered the incident light. The amount of diffuse reflectance is more than 90% in a wide range of wavelengths from 400–800 nm. This amount is negligible and less than 10% for both 1TA and 1TB photoelectrodes. This result is in well-correspondence with the results of transmission spectroscopy.


image file: c4ra09244a-f9.tif
Fig. 9 Optical transmittance of the photoanodes with one (a) and two (b) transparent sub-layers of TiO2 NCs prepared in acidic autoclaving pH and one over-layer of different sizes of TiO2 hollow spheres. Similar measurements for the photoanodes with one (c) and two (d) sub-layers of TiO2 NCs prepared in basic autoclaving pH. The diffuse reflectance spectra of the 1Sa, 1Sb and 1Sc layers of TiO2 hollow spheres and also 1TA and 1TB films of the TiO2 nanocrystals (e).

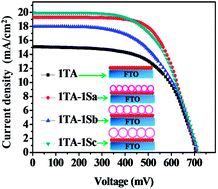
Fig. 10(a) and (b) demonstrate the IV curves of the dye sensitized solar cells made of the 1TA, 1TA-1Sa, 1TA-1Sb, 1TA-1Sc and 2TA, 2TA-1Sa, 2TA-1Sb and 2TA-1Sc photoelectrodes. According to the results, the short-circuit current density (Jsc) is obviously increased for the cells with photoanodes including the light-scattering layer. The open-circuit voltage (Voc) is also slightly increased for the 1TA-1Sa, 1TA-1Sb, 1TA-1Sc photoanodes while it is obviously enhanced for the 2TA group of the electrodes with light-scattering layers. The photovoltaic parameters of the dye sensitized solar cells are extracted from the IV curves and shown in Table 1. It could be seen that the Jsc is increased from 15.1 mA cm−2 for the 1TA photoelectrode to the values above 18.0 mA cm−2 for the photoanodes with scattering layers. According to the results, this value is about 19.2, 18.0 and 20.0 mA cm−2 for the 1TA-1Sa, 1TA-1Sb, 1TA-1Sc photoanodes, respectively. The Voc is also about 706 mV for the 1TA electrode. It is then slightly increased to 714, 713 and 718 mV when 1Sa, 1Sb and 1Sc scattering layers are applied in the photoanodes. Finally the energy conversion efficiency is calculated about 6.7%, 8.9%, 7.6% and 8.5% for the devices with 1TA, 1TA-1Sa, 1TA-1Sb and 1TA-1Sc photoelectrodes. The thicknesses are also shown in Table 1 as 6 μm 13 μm for the photoanodes without and with scattering layers, respectively.


image file: c4ra09244a-f10.tif
Fig. 10 Photocurrent–voltage (IV) characteristics of the dye sensitized solar cells with photoanodes composed of one (a) and two (b) transparent sub-layers of TiO2 NCs prepared in acidic autoclaving pH and one over-layer of different TiO2 hollow spheres.
Table 1 Photovoltaic parameters of DSSCs with photoanodes composed of one and two sub-layers of TiO2 NCs grown in acidic autoclaving pH and one over-layer of different TiO2 hollow spheres
Photoanode Jsc (mA cm−2) Voc (mV) FF η ± 0.2 (%) Thickness ± 1 (μm)
1TA 15.1 706 0.63 6.7 6
1TA-1Sa 19.2 714 0.65 8.9 13
1TA-1Sb 18 713 0.6 7.6 13
1TA-1Sc 20 718 0.6 8.5 13
2TA 16.4 655 0.65 7 8
2TA-1Sa 17 720 0.54 6.6 17
2TA-1Sb 18.2 726 0.66 8.73 17
2TA-1Sc 17.7 746 0.73 9.7 17


The photovoltaic performance of the cells with 2TA-1Sa, 2TA-1Sb and 2TA-1Sc photoanodes are also improved compared to that of the cell with 2TA photoelectrode. The Jsc is about 16.4 mA cm−2 for the cell with 2TA transparent electrode. This value is increased to 17.0 and 18.2 mA cm−2 for the cells with 2TA-1Sa and 2TA-1Sb photoanodes. It is finally decreased to 17.6 mA cm−2 for the device with 2TA-1Sc photoelectrode. The Voc is also about 655 mV for the cell with 2TA photoanode. It is then increased to 720, 726 and 746 mV when the 1Sa, 1Sb and 1Sc scattering layers are applied in the photoanodes. The FF is also increased to around 70% for the cells with photoanode structures of 2TA-1Sb and 2TA-1Sc. Finally the efficiency is considerably increased from 7.0% for the cell with 2TA transparent electrode to 8.73% and 9.7% for the devices with the 2TA-1Sb and 2TA-1Sc photoanodes, respectively.

According to the whole series of results, application of a light scattering layer of TiO2 hollow spheres in the photoanode of the DSSCs could considerably increase the short-circuit current density. It could also slightly enhance the open-circuit voltage of the dye sensitized solar cells. The improvement of these two parameters could finally result in the energy conversion efficiencies as high as 9.7%. The reason of these improvements could be attributed to the increased path length of the incident photons inside the cells. This could increase the number of photon–dye interactions and enhance the electron injection to the semiconductor TiO2 scaffold. This would result in a higher quasi Fermi level and consequently in higher Jsc, Voc and efficiency of the solar cells.67 The higher amount of dye adsorption for the photoanodes with scattering layers could have a minor effect on improvement of the efficiencies. As mentioned earlier, the dye loading is higher in the photoanodes with 1Sa scattering layer. Nevertheless, the maximum efficiency is achieved for the device with 2TA-1SC photoanode. This could show the dominant effect of the increased light scattering on the cell performance.

Fig. 11(a) and (b) represent the similar results for the dye sensitized solar cells made of TB category of the photoanodes. According to the results, Jsc is increased for the cells with scattering layer of the TiO2 hollow spheres. This increase is quite higher compared to that of the cells with nanocrystalline TiO2 scaffold prepared in acidic autoclaving pH. The Voc is also nearly constant for the cells with 1TB and 2TB category of the photoanodes. The photovoltaic parameters of the cells are summarized in Table 2. It could be seen that the Jsc is about 8.5 mA cm−2 for the 1TB photoanode. It is then increased to 14.56 and 17.5 mA cm−2 for the 1TB-1Sa and 1TB-1Sb photoelectrodes. Finally the Jsc is decreased to 13.66 mA cm−2 for the 1TB-1Sc electrode. The Voc of the cells is also about 725 mV with slight changes. Besides, The FF is around 70% for the cells with different photoanode structures. Finally the energy conversion efficiency is equal to 4.3%, 7.3%, 9.4% and 6.4% for cells with 1TB, 1TB-1Sa, 1TB-1Sb and 1TB-1Sc photoanodes, respectively. It could be concluded that the efficiency of the best cell is increased about 118% compared to the cell with 1TB photoelectrode. The thickness of the photoanodes are also shown in Table 2 for comparison. The value of the thickness is about 6 μm for the 1TB and 13 μm for the other photoanodes with light scattering layers.


image file: c4ra09244a-f11.tif
Fig. 11 IV characteristics of the dye sensitized solar cells with photoanodes composed of one (a) and two (b) transparent sub-layers of TiO2 NCs prepared in basic autoclaving pH and one over-layer of different TiO2 hollow spheres.
Table 2 Photovoltaic parameters of DSSCs with photoanodes composed of one and two sub-layers of TiO2 NCs grown in basic autoclaving pH and one over-layer of different TiO2 hollow spheres
Photoanode Jsc (mA cm−2) Voc (mV) FF η ± 0.2 (%) Thickness ± 1 (μm)
1TB 8.5 725 0.7 4.3 6
1TB-1Sa 14.56 724 0.69 7.3 13
1TB-1Sb 17.5 722 0.74 9.4 13
1TB-1Sc 13.66 730 0.64 6.4 13
2TB 11.03 730 0.68 5.5 14
2TB-1Sa 20 746 0.59 8.7 20
2TB-1Sb 14.89 732 0.61 6.7 20
2TB-1Sc 21.1 723 0.57 8.7 20


The photovoltaic parameters of the dye sensitized solar cells made of 2TB, 2TB-1Sa, 2TB-1Sb and 2TB-1Sc photoanodes are also listed in Table 2. The Jsc is increased from 11 mA cm−2 for the cell with 2TB transparent photoanode to 20, 14.9 and 21.0 mA cm−2 for the cells with 2TB-1Sa, 2TB-1Sb and 2TB-1Sc photoelectrodes. The Voc is also about 746 mV and 732 mV for the cells with 2TB-1Sa and 2TB-1Sb photoanodes. This value is slightly decreased to 723 mV for the cell with 2TB-1Sc photoanode. The reason could be attributed to the higher current density of the cell with 2TB-1Sc electrode. The FF is also about 60% for the cells with light scattering layers. Finally the efficiencies are equal to 5.5%, 8.5%, 6.7% and 8.7% for the cells with 2TB, 2TB-1Sa, 2TB-1Sb and 2TB-1Sc photoanodes, respectively. The photoanode thickness is also about 14 μm for the semi-transparent 2TB electrode while it is about 20 μm for the photoanodes with light scattering layers.

As was observed, an energy conversion efficiency as high as 9.4% was achieved for the cell with 1TB-1Sc photoanode. This could show that the semi-transparent sub-layers composed of TiO2 nanocrystals prepared in basic autoclaving pH could operate well in the photoanode of the dye sensitized solar cells. Although the amount of the changes in Jsc and Voc was different for the cells made of TiO2 nanocrystals prepared in acidic and basic autoclaving pH but both photoanode structures could be well-improved by application of scattering layers. The reason of the improved performance of the cells with 1TB-1Sa, 1TB-1Sb, 1TB-1Sc, 2TB-1Sa, 2TB-1Sb and 2TB-1Sc photoanodes is similarly related to the increased path length of the incident photons inside the cells together with the slightly higher amount of the dye adsorption.

Fig. 12 demonstrates the result of EIS analysis for the dye sensitized solar cells with different 1TB, 1TB-1Sb, 2TA, and 2TA-1Sc photoanodes. The electrochemical impedance spectroscopy was carried out at −0.8 V in dark. The equivalent circuit for modeling of the experimental data is shown in the inset of the Figure. Various parameters including the series resistance of the cell (RS), electron lifetime within the photoanode (τeff), charge-transfer resistance at the TiO2/electrolyte interface (Rrec), chemical capacitance of the TiO2 photoanode (Cμ) and charge-transfer resistance at the interface of the counter electrode and electrolyte (RCE) were extracted. The theory of the model and calculation details were previously reported by Adachi et al.68 The simulation results are represented in Table 3. According to the results the values of Rrec and τeff are decreased for the photoanodes with light scattering layers. In contrast, the chemical capacitance of TiO2 photoanode (Cμ) is increased for the 1TB-1Sb and 2TA-1Sc photoelectrodes. The reason of higher Cμ and lower Rrec could be attributed to the higher amount of light absorption for the DSSCs with scattering layers. This could create higher level of electron injection to the TiO2 photoanode and raise the quasi-Fermi level. It could result in higher Cμ and higher probability of charge recombination at the interface of the photoelectrode and electrolyte.


image file: c4ra09244a-f12.tif
Fig. 12 Nyquist plots of the dye sensitized solar cells with 1TB, 2TA, 1TB-1Sb and 2TA-1Sc photoanodes measured at −0.8 V in dark. The inset of the figure shows the equivalent circuit used for modeling of the impedance data.
Table 3 EIS parameters of the dye sensitized solar cells with 1TB, ITB-1Sb, 2TA and 2TA-1Sc photoelectrodes
Photoanode Rs (Ω) Rrec (Ω) C (μF) τeff (ms)
1TB 15 99 341 34
1TB-1Sb 18 46 685 32
2TA 16.5 92 376 35
2Ta-1Sc 18 50 510 25


Conclusions

Carbon spheres with different average sizes of 230, 325 and 450 nm were prepared by a hydrothermal method. Then the liquid phase deposition (LPD) of TiO2 was performed on the surface of the carbon templates. Titanium tetra isopropoxide (TTIP) was used as the precursor in the LPD process. This process was carried out at room temperature and different deposition times. Finally, the TiO2 hollow spheres of different size and thickness were achieved by burning the carbon templates. The SEM images showed that the TiO2 hollow spheres were formed in the LPD times of 24 and 48 h for 230 nm carbon templates and in 24 h for the 325 and 450 nm carbon spheres. Two kinds of TiO2 NCs were also prepared by hydrothermal method in acidic (pH = 1.5) and basic (pH = 10) autoclaving pHs. These nanocrystals with different average sizes were deposited on FTO glass substrates to be applied as the transparent photoanode of the dye sensitized solar cells. Three kinds of TiO2 hollow spheres with external diameters around 310 nm (Sa), 435 nm (Sb) and 550 nm (Sc) were selected and used in a modified paste preparation process. Then they were deposited on the surface of the nanocrystalline TiO2 sub-layers as the light scattering layer. Two categories of the photoanodes were prepared using two kinds of TiO2 nanocrystals applied in transparent sub-layers and one over-layer of light scattering hollow spheres. The light scattering and dye adsorption of the photoanodes were accurately studied and discussed. The results demonstrated that the light scattering was quite high for the photoanodes with scattering layers. Nevertheless, the dye adsorption was not considerably changed specially for larger TiO2 hollow spheres. The photovoltaic parameters of the corresponding dye sensitized solar cells were also investigated. According to the results, the maximum efficiencies of 9.7% and 9.4% were achieved for the cells with 2TA-1Sc and 1TB-1Sb photoanodes. The first electrode was composed of 2 layers of TiO2 NCs prepared in acidic autoclaving pH and 1 layer of Sc TiO2 hollow spheres. The 1TB-1Sc photoelectrode was also made of 1 transparent sub-layer of TiO2 NCs prepared in basic autoclaving pHs and 1 over-layer of the Sb hollow spheres. These efficiencies demonstrated an increase about 40% and 118% compared to those of the similar cells without the scattering layers. The electrochemical impedance spectroscopy was also performed for the best cells and similar devices without the scattering components. According to the results the Rrec and τeff were decreased and Cμ was increased for the cells with scattering layers. This was attributed to higher quasi-Fermi level of TiO2 electrode which could be created by increased light scattering and electron injection to the TiO2 layer.

Notes and references

  1. B. O'Regan and M. Gratzel, Nature, 1991, 353, 737–740 CrossRef.
  2. M. Gratzel, Nature, 2001, 414, 338–344 CrossRef CAS PubMed.
  3. H. J. Snaith, Adv. Funct. Mater., 2010, 20, 13–19 CrossRef CAS.
  4. A. Hagfeldt, G. Boschloo, L. Sun, L. Kloo and H. Pettersson, Chem. Rev., 2010, 110, 6595–6663 CrossRef CAS PubMed.
  5. Y. J. Lee, M. H. Kim, H. J. Lim, G. Choi, Y. S. Park, N. G. Kim and K. Lee, Adv. Mater., 2009, 21, 3668 CrossRef.
  6. D. Chen, F. Huang, Y. B. Cheng and R. A. Caruso, Adv. Mater., 2009, 21, 2206 CrossRef CAS; W. G. Yang, F. R. Wan, Q. W. Chen, J. J. Li and D. S. J. Xu, Mater. Chem., 2010, 20, 2870 RSC.
  7. F. Sauvage, D. Chen, P. Comte, F. Huang, L. P. Heiniger, Y. B. Cheng, R. A. Caruso and M. Gratzel, ACS Nano, 2010, 4, 4420 CrossRef CAS PubMed.
  8. W. Shao, F. Gu, C. Li and M. Lu, Inorg. Chem., 2010, 49, 5453–5459 CrossRef CAS PubMed.
  9. K. Yan, Y. Qiu, W. Chen, M. Zhang and S. Yang, Energy Environ. Sci., 2011, 4, 2168 CAS.
  10. H. E. Wang, L. X. Zheng, C. P. Liu, Y. K. Liu, C. Y. Luan, H. Cheng, Y. Y. Li, L. Martinu, J. A. Zapien and I. J. Bello, J. Phys. Chem. C, 2011, 115, 10419 CAS.
  11. T. Chen, L. Qiu, Z. Yang and H. Peng, Chem. Soc. Rev., 2013, 42, 5031 RSC.
  12. S. Pan, Z. Yang, H. Li, L. Qiu, H. Sun and H. Peng, J. Am. Chem. Soc., 2013, 135, 10622 CrossRef CAS PubMed.
  13. Z. Yang, T. Chen, R. He, G. Guan, H. Li and H. Peng, Adv. Mater., 2011, 23, 5636 Search PubMed.
  14. Z. S. Wang, H. Kawauchi, T. Kashima and H. Arakawa, Chem. Rev., 2004, 248, 1381 CAS.
  15. Y. Tachibana, K. Hara, K. Sayama and H. Arakawa, Chem. Mater., 2002, 14, 2527 CrossRef CAS.
  16. H. J. Koo, Y. J. Kim, Y. H. Lee, W. I. Lee, K. Kim and N. G. Park, Adv. Mater., 2008, 20, 195 CrossRef CAS.
  17. K. Hara, M. Kurashige, Y. Dan-oh, C. Kasada, A. Shinpo, S. Suga, K. Sayama and H. Arakawa, New J. Chem., 2003, 27, 783–785 RSC.
  18. K. R. J. Thomas, J. T. Lin, Y. C. Hsu and K. C. Ho, Chem. Commun., 2005, 4100 Search PubMed.
  19. S. L. Li, K. J. Jiang, K. F. Shao and L. M. Yang, Chem. Commun., 2006, 2794 Search PubMed.
  20. K. Hara, T. Sato, R. Katoh, A. Furube, T. Yoshihara, M. Murai, M. Kurashige, S. Ito, A. Shinpo, S. Suga and H. Arakawa, Adv. Funct. Mater., 2005, 15, 246–252 CrossRef CAS.
  21. J. E. Moser, M. Wolf, F. Lenzmann and M. Gratzel, Z. Phys. Chem., 1999, 212, 85–92 CrossRef CAS.
  22. Y. Tachibana, J. E. Moser, M. Gratzel, D. R. Klug and J. R. Durrant, J. Phys. Chem., 1996, 100, 20056–20062 CrossRef CAS.
  23. Y. Wang, J. B. Asbury and T. Lian, J. Phys. Chem. A, 2000, 104, 4291–4299 CrossRef CAS.
  24. B. Burfeindt, C. Zimmermann, S. Ramakrishna, T. Hannappel, B. Meissner, W. Storck and F. Willig, Z. Phys. Chem., 1999, 212, 67–75 CrossRef CAS.
  25. P. Wang, S. Zakeeruddin, P. Comte, R. Charvet, R. Humphry-Baker and M. Gratzel, J. Phys. Chem. B, 2003, 107, 14336–14341 CrossRef CAS.
  26. K. Doo-Hwan, H. Jong-Hyun, K. Dong-Joo and S. Youl-Moon, Journal of Electrical Engineering & Technology, 2010, 5, 146–150 Search PubMed.
  27. K. Dinga, J. Melas-Kyriazia, N. L. Cevey-Hab, K. G. Chittibabuc, S. M. Zakeeruddinb, M. Grätzelb and M. D. McGeheea, Org. Electron., 2010, 11, 1217–1222 CrossRef PubMed.
  28. J. H. Park, K. J. Choi, S. W. Kang, Y. S. Kang, J. Kim and s. Lee, J. Power Sources, 2008, 183, 812–816 CrossRef CAS PubMed.
  29. N. G. Park, Korean J. Chem. Eng., 2010, 27, 375–384 CrossRef CAS.
  30. V. K. Narasimhan and Y. Cui, Nanostructures for photon management in solar cells, Science Wise Publishing, 2013, vol. 1515, p. 0001 Search PubMed.
  31. F. Gao, Y. Wang, D. Shi, J. Zhang, M. k. Wang, X. Y. Jing, R. Humphry-Baker, P. Wang, S. M. Zakeeruddin and M. Gratzel, J. Am. Chem. Soc., 2008, 130, 10720 CrossRef CAS PubMed; S. Ito, T. N. Murakami, P. Comte, P. Liska, C. Gratzel, M. K. Nazeeruddin and M. Gratzel, Thin Solid Films, 2008, 516, 4613 CrossRef PubMed.
  32. J. H. Park, K. J. Choi, S. W. Kang, Y. S. Kang, J. Kim J and s. Lee, J. Power Sources, 2008, 183, 812–816 CrossRef CAS PubMed.
  33. E. Stathatos, P. Lianos, A. Surca Vuk and B. Orel, Adv. Funct. Mater., 2004, 14, 45–48 CrossRef CAS.
  34. Z. Changneng, W. Miao, Z. Xiaowen, L. Yuan, F. Shibi, L. Xueping, X. Xuri and C. Kuang, Chin. Sci. Bull., 2004, 49, 2033–2036 CrossRef.
  35. Y. Yang, C. H. Zhou, S. Xu, J. Zhang, S. J. Wu, H. Hu, B. L. Chen, Q. D. Tai, Z. H. Sun, W. Liu and X. Z. Zhao, Nanotechnology, 2009, 20, 105204 CrossRef PubMed.
  36. T. Qunwei, C. Hongyuan, Y. Shuangshuang and W. Xin, J. Mater. Chem. A, 2013, 1, 317–323 Search PubMed.
  37. E. Shaker, S. Moataz, M. Anas, M. Hafez and M. Tarek, Int. J. Photoenergy, 2013, 6, 906820 Search PubMed.
  38. X. Zhang, X. Huang, C. Li and H. Jiang, Adv. Mater, 2013, 4093–4096 CrossRef CAS PubMed.
  39. R. Y. Yao, Z. J. Zhou, Z. L. Hou, X. Wang, W. H. Zhou and S. X. Wo, ACS Appl. Mater. Interfaces, 2013, 5, 3143–3148 CAS.
  40. L. Dongmei, Q. Da, D. Minghui, L. Yanhong and M. Qingbo, Energy Environ. Sci., 2009, 2, 283–291 Search PubMed.
  41. A. B. F. Martinson, J. W. Elam, J. T. Hupp and M. J. Pellin, Nano Lett., 2007, 7, 2183–2187 CrossRef CAS PubMed.
  42. P. Teesetsopon, S. Kumar and J. Dutta, Int. J. Electrochem. Sci., 2012, 7, 4988–4999 CAS.
  43. Q. Zhang, C. S. Dandeneau, X. Zhou and G. Cao, Adv. Mater., 2009, 21, 4087–4108 CrossRef CAS.
  44. S. Nagaminea, A. Sugiokab, H. Iwamotob and Y. Konishib, Powder Technol., 2008, 186, 168–175 CrossRef PubMed.
  45. C. Dwivedi and V. Dutta, Proc. World Acad Sci. Eng. Tech., 2012, 6, 216–218 Search PubMed.
  46. H. J. Koo, Y. J. Kim, Y. H. Lee, W. I. Lee, K. Kim and N. G. Park, Adv. Mater., 2008, 20, 195–199 CrossRef CAS.
  47. Y. J. Kim, S. Y. Chai and W. I. Lee, Langmuir, 2007, 23, 9567–9571 CrossRef CAS PubMed.
  48. C. Dwivedia, V. Duttaa, A. K. Chandiranb, M. K. Nazeeruddinb and M. Grätzel, Energy Procedia, 2013, 33, 223–227 CrossRef PubMed.
  49. C. Y. Wu, S. H. Yu, S. F. Chen, G. N. Liu and B. H. Liu, J. Mater. Chem., 2006, 16, 3326 RSC.
  50. Y. G. Sun, B. T. Mayers and Y. N. Xia, Nano Lett., 2002, 2, 481 CrossRef CAS.
  51. K. J. C. Van Bommel, A. Friggeri and S. Shinkai, Angew. Chem., Int. Ed., 2003, 42, 3027 CrossRef PubMed.
  52. Q. Zhang, W. Li and S. Liu, Powder Technol., 2011, 212, 145–150 CrossRef CAS PubMed.
  53. J. H. Parka, S. Y. Jungb, R. Kima, N. GyuParkc, J. Kima and S. S. Leea, J. Power Sources, 2009, 194, 574–579 CrossRef PubMed.
  54. K. J. C. Van Bommel, A. Friggeri and S. Shinkai, Angew. Chem., Int. Ed., 2003, 42, 3027 CrossRef PubMed.
  55. J. Park, S. Jung, A. Yu and S. Lee, Mater. Lett., 2011, 65, 2506–2509 CrossRef CAS PubMed.
  56. Y. Kondo, H. Yoshikawa, K. Awaga, M. Murayama, T. Mori, K. Sunada, S. Bandow and S. Iijima, Langmuir, 2008, 24, 547–550 CrossRef CAS PubMed.
  57. J. Wang, Y. Baia, M. Wub, J. Yinc and W. F. Zhanga, J. Power Sources, 2009, 191, 614–618 CrossRef CAS PubMed.
  58. Y. Zhang, J. Zhang, P. Wang, G. Yang, Q. Sun, J. Zheng and Y. Zhu, Mater. Chem. Phys., 2010, 123, 595–600 CrossRef CAS PubMed.
  59. C. Y. Wu, S. H. Yu, S. F. Chen, G. N. Liu and B. H. Liu, J. Mater. Chem., 2006, 16, 3326 RSC.
  60. Sh. Dadgostar, F. Tajabadi and N. Taghavinia, ACS Appl. Mater. Interfaces, 2012, 4, 2964–2968 CAS.
  61. J. Song, H. Yang, X. Wang, S. Khoo, C. C. Wong, X. Liu and C. Ming Li, ACS Appl. Mater. Interfaces, 2012, 4, 3712–3717 CAS.
  62. G. J. Ke, H. Y. Chen, C. Y. Su and D. B. Kuang, J. Mater. Chem A, 2013, 1, 13274–13282 CAS.
  63. M. Sevilla and A. B. Fuertes, Carbon, 2009, 47, 2281–2289 CrossRef CAS PubMed.
  64. S. Ito, K. Nazeeruddin, P. Liska, P. Comte, R. Charvet, P. Pechy, M. Jirousek, A. Kay, S. M. Zakeeruddin and M. Gratzel, Prog. Photovoltaics, 2006, 14, 589–601 CAS.
  65. S. Ito, T. N. Murakami, P. l. Comte, P. Liska, C. Grätzel, M. K. Nazeeruddin and M. Grätzel, Thin Solid Films, 2008, 516, 4613–4619 CrossRef CAS PubMed.
  66. P. Wang, S. Zakeeruddin, P. Comte, R. Charvet, R. Humphry-Baker and M. Gratzel, J. Phys. Chem. B, 2003, 107, 14336–14341 CrossRef CAS.
  67. M. Peter, Phys. Chem. Chem. Phys., 2007, 9, 2630–2642 RSC.
  68. M. Adachi, M. Sakamoto, J. Jiu, Y. Ogata and S. Isoda, J. Phys. Chem. B, 2006, 110, 13872 CrossRef CAS PubMed.

This journal is © The Royal Society of Chemistry 2014
Click here to see how this site uses Cookies. View our privacy policy here.